Primers:
| 1650 | Hspb11_FWD | ATGTTTCCTGGTCTCCGTCA | JH | 5/21/2015 | 20 | 55 | O.lurida | Heat shock protein beta-11 (Hspb11) (Placental protein 25) (PP25) | Q9Y547 | |
| 1649 | Hspb11_REV | CATCAACGCCAGGGGAACTT | JH | 5/21/2015 | 20 | 55 | O.lurida | Heat shock protein beta-11 (Hspb11) (Placental protein 25) (PP25) | Q9Y547 |
Reagent Table:
| Volume | Reactions X116 | |
| Ssofast Evagreen MM | 10 | 1160 |
| FWD Primer | 0.5 | 58 |
| REV Primer | 0.5 | 58 |
| 1:9 cDNA | 9 |
- Added reagents from greatest to least volume
- Vortexed
- Centrifuged briefly
- Pipetted 11 ul Master Mix to each tube
- Pipetted 9 ul of 1:9 cDNA each column using a channel pipetter
- Centrifuged plate at 2000 rpm for 1 minute
- Ran Program Below
Program:
| Step | Temperature | Time |
| Initiation | 95 C | 10 min |
| Elongation | 95 C | 30 sec |
| 60 C | 1 min | |
| Read | ||
| 72 C | 30 sec | |
| Read | ||
| Repeat Elongation 39 times | ||
| Termination | 95 C | 1 min |
| 55 C | 1 sec | |
| Melt Curve Manual ramp 0.2C per sec Read 0.5 C | 55 - 95 C | 30 sec |
| 21 C | 10 min | |
| End |
Plate Layout:
| 1 | 2 | 3 | 4 | 5 | 6 | 7 |
| DNased 42215 HC1 | DNased 42215 NC1 | DNased 42215 SC1 | DNased 42215 HT1 1 | DNased 42215 NT1 1 | DNased 42215 ST1 1 | NTC |
| DNased 42215 HC2 | DNased 42215 NC2 | DNased 42215 SC2 | DNased 42215 HT1 2 | DNased 42215 NT1 2 | DNased 42215 ST1 2 | NTC |
| DNased 42215 HC3 | DNased 42215 NC3 | DNased 42215 SC3 | DNased 42215 HT1 3 | DNased 42215 NT1 3 | DNased 42215 ST1 3 | NTC |
| DNased 42215 HC4 | DNased 42215 NC4 | DNased 42215 SC4 | DNased 42215 HT1 4 | DNased 42215 NT1 4 | DNased 42215 ST1 4 | NTC |
| DNased 42215 HC5 | DNased 42215 NC5 | DNased 42215 SC5 | DNased 42215 HT1 5 | DNased 42215 NT1 5 | DNased 42215 ST1 5 | |
| DNased 42215 HC6 | DNased 42215 NC6 | DNased 42215 SC6 | DNased 42215 HT1 6 | DNased 42215 NT1 6 | DNased 42215 ST1 6 | |
| DNased 42215 HC7 | DNased 42215 NC7 | DNased 42215 SC7 | DNased 42215 HT1 7 | DNased 42215 NT1 7 | DNased 42215 ST1 7 | |
| DNased 42215 HC8 | DNased 42215 NC8 | DNased 42215 SC8 | DNased 42215 HT1 8 | DNased 42215 NT1 8 | DNased 42215 ST1 8 |
Results:
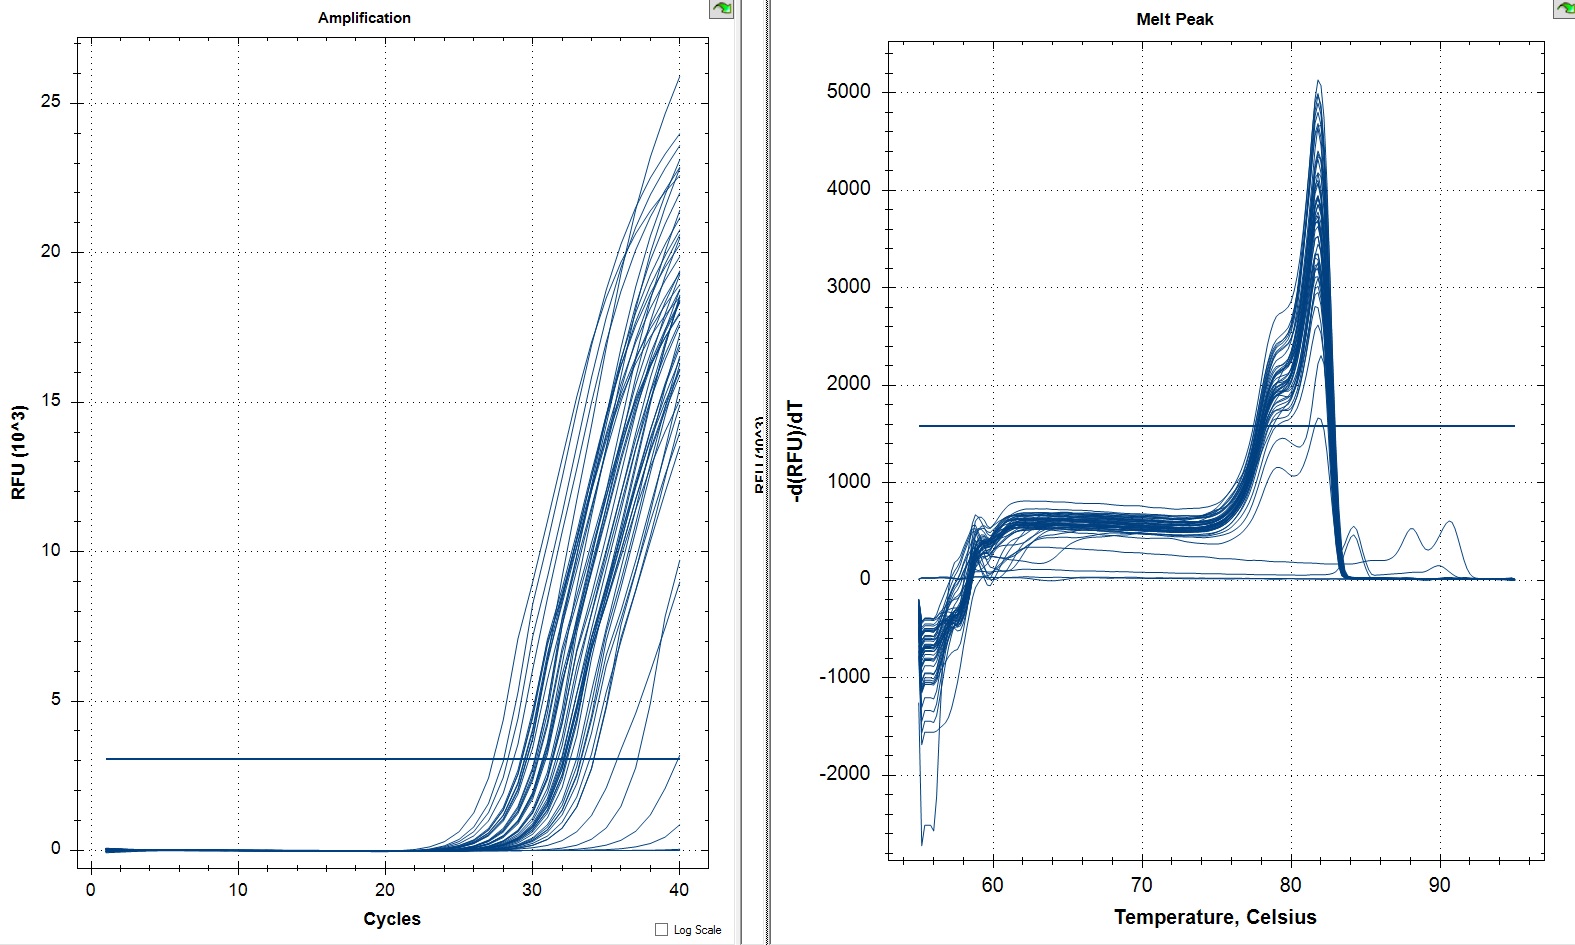
All samples
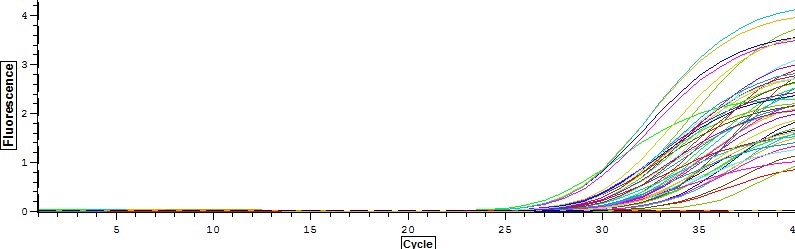
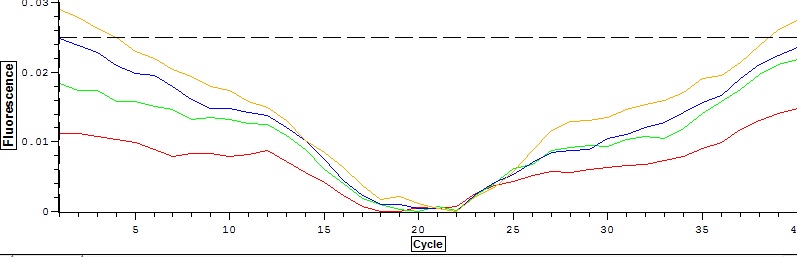
Amp
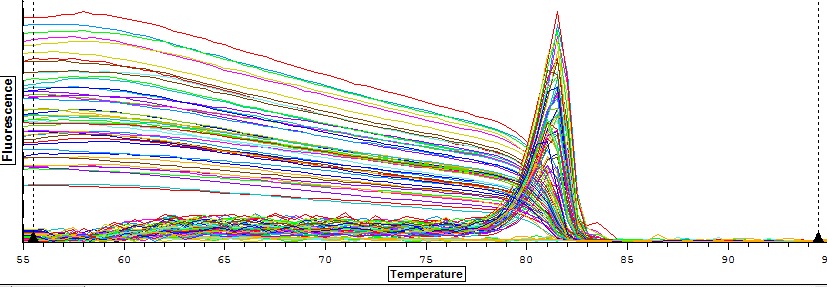
Melt
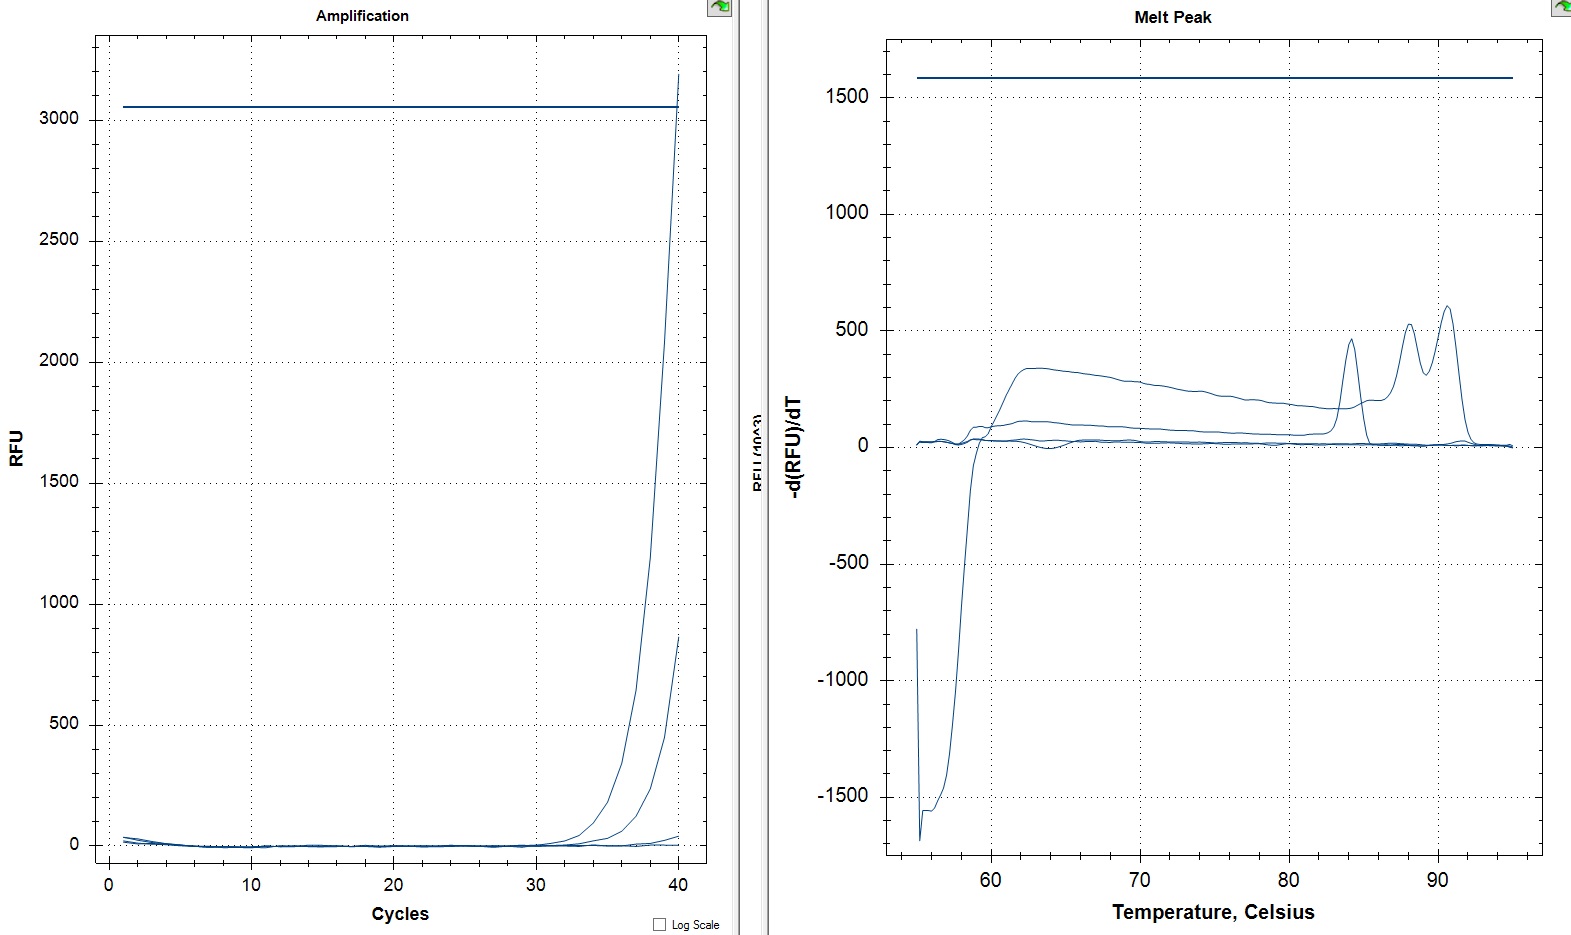
NTCs
Amp
Melt
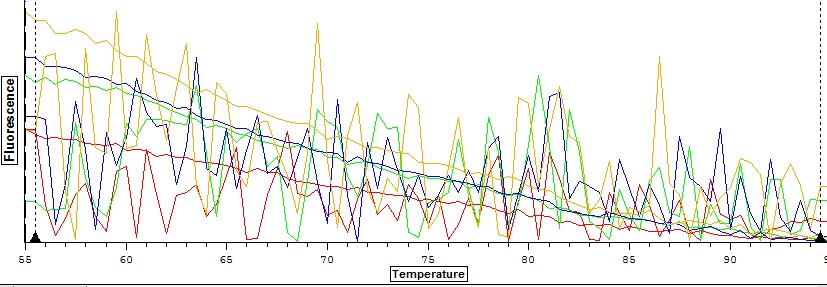
The amplification and melt curves look good. There's no amplification in the NTCs. To analyze this data I ran it through a script to do stats and make some graphs.
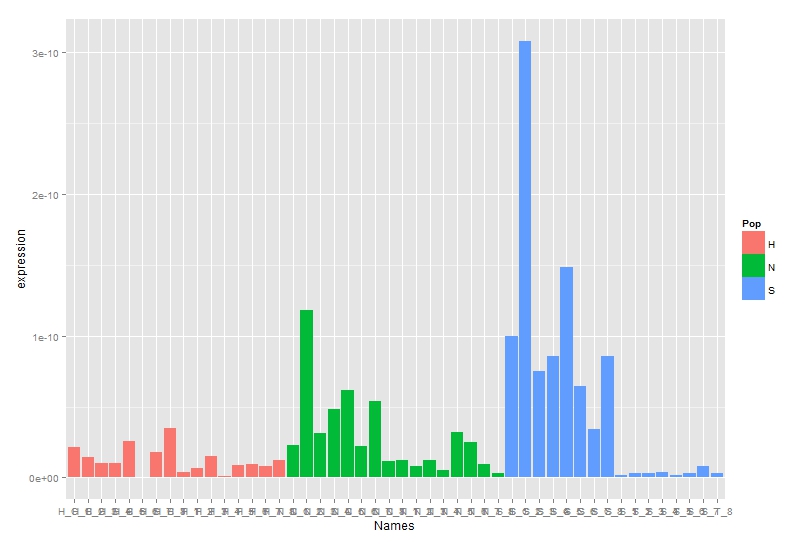
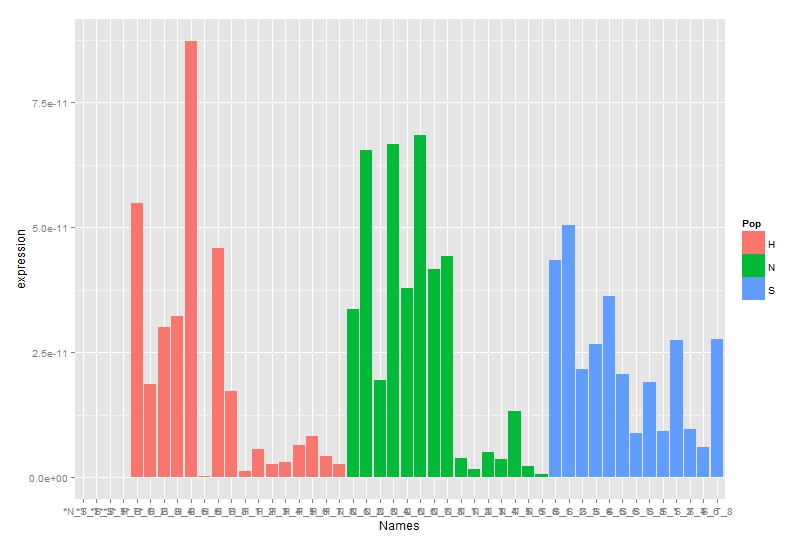
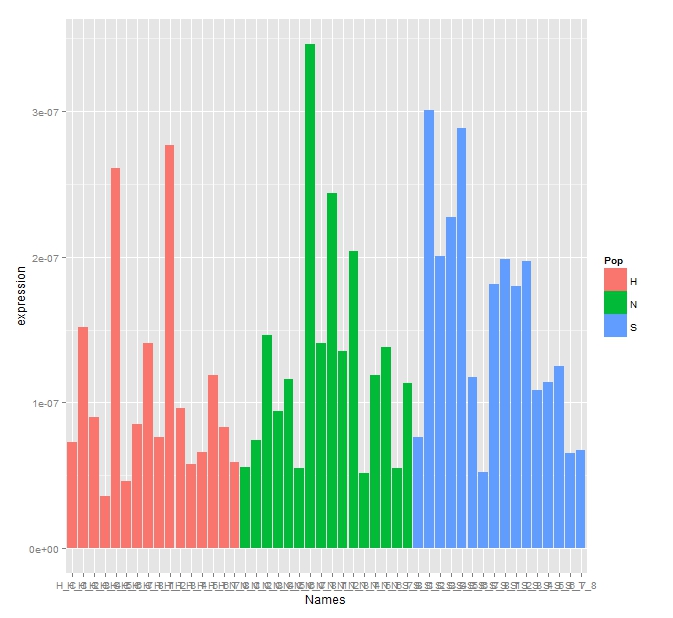
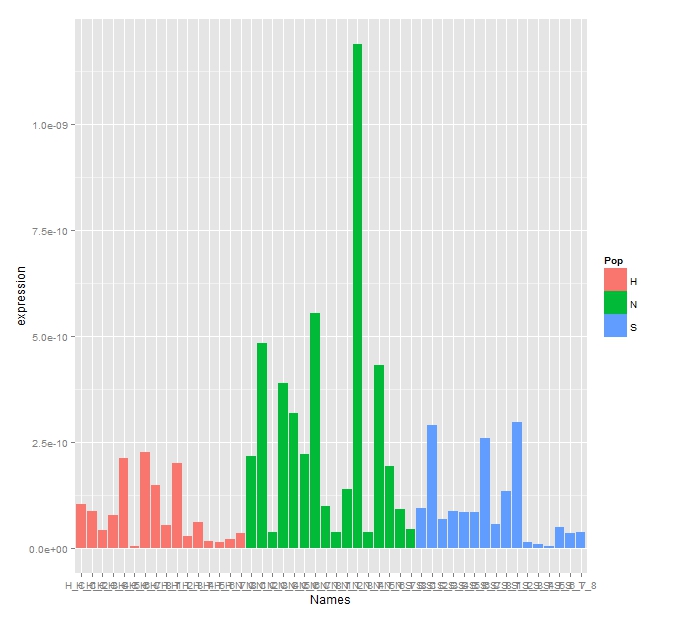
Expression Bar Graph
Statistics
Call:
aov(formula = expression ~ Pop + Treat + Pop:Treat, data = rep2res2)
Terms:
Pop Treat Pop:Treat Residuals
Sum of Squares 1.913763e-14 3.460040e-15 6.197430e-15 2.482985e-13
Deg. of Freedom 2 1 2 42
Residual standard error: 7.688868e-08
Estimated effects may be unbalanced
> TukeyHSD(fit)
Tukey multiple comparisons of means
95% family-wise confidence level
Fit: aov(formula = expression ~ Pop + Treat + Pop:Treat, data = rep2res2)
$Pop
p adj
N-H 0.6743300
S-H 0.1825199
S-N 0.6131938
$Treat
p adj
T-C 0.4485315
$`Pop:Treat`
p adj
N:C-H:C 0.9968662
S:C-H:C 0.4617887
H:T-H:C 0.9999847
N:T-H:C 0.9924229
S:T-H:C 0.9930620
S:C-N:C 0.7546118
H:T-N:C 0.9879773
N:T-N:C 0.9999986
S:T-N:C 0.9999992
H:T-S:C 0.3687373
N:T-S:C 0.8077927
S:T-S:C 0.8022228
N:T-H:T 0.9771056
S:T-H:T 0.9785530
S:T-N:T 1.0000000
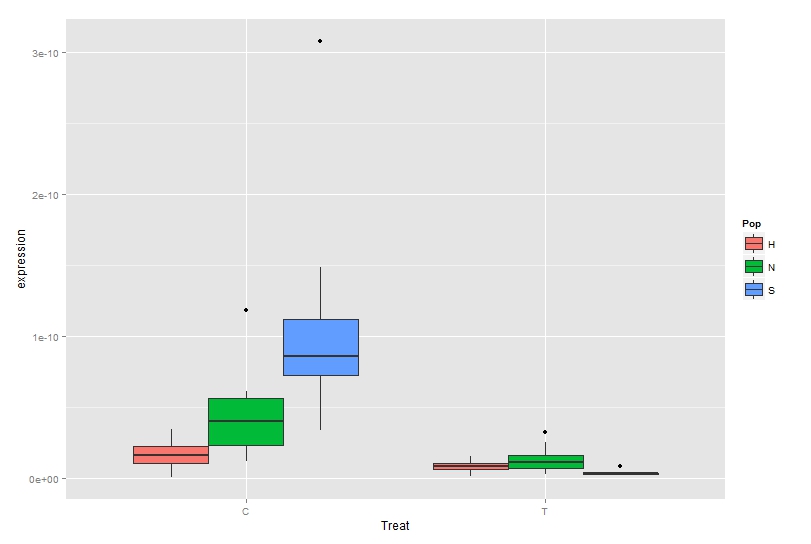
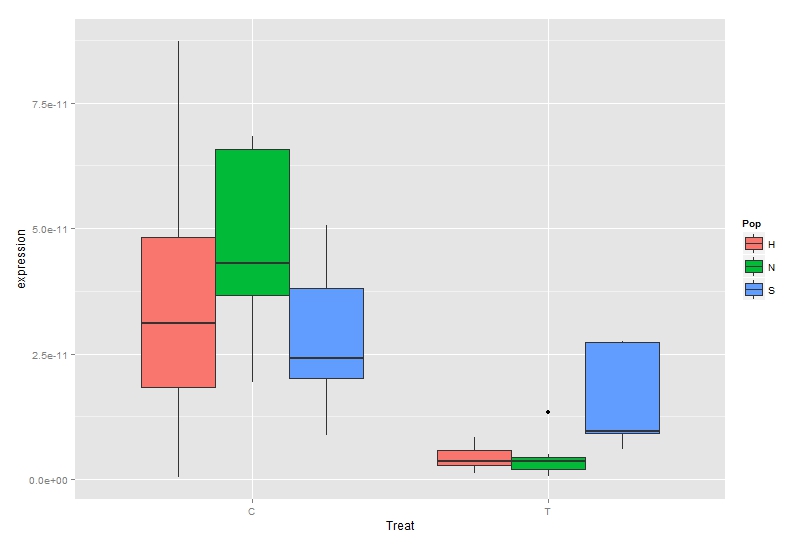
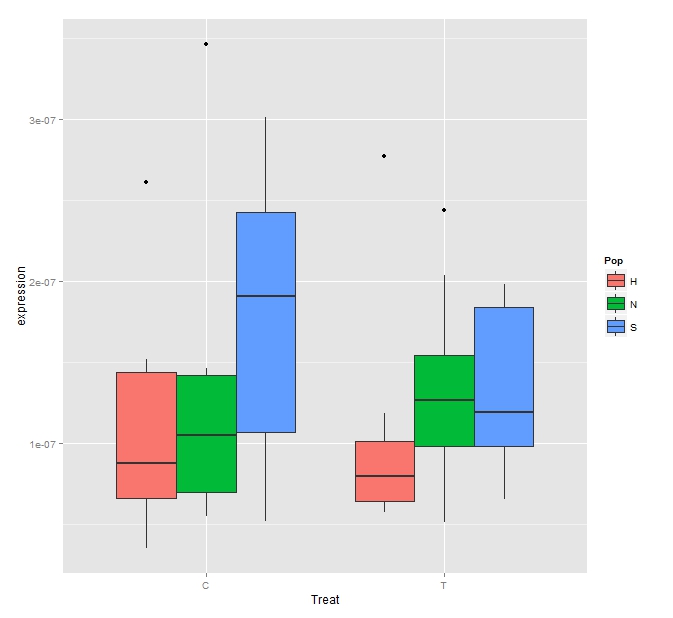
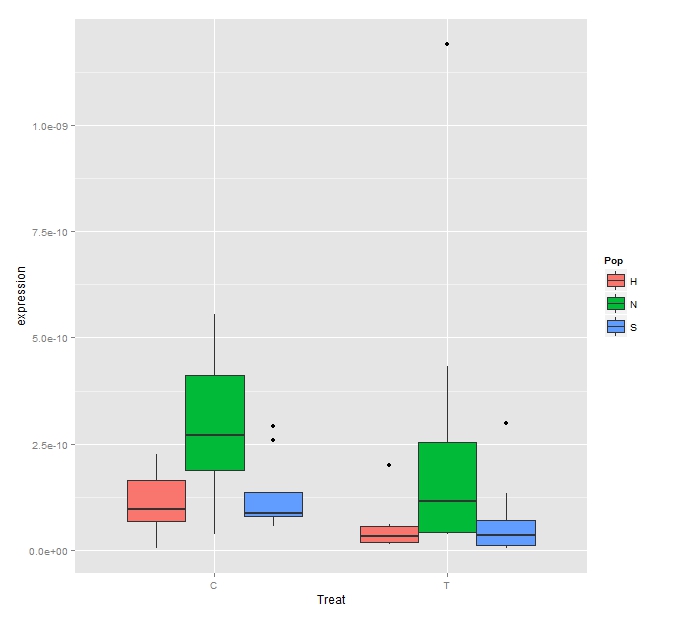
The Stats show there are no significant differences between the treatment or controls or populations which can be seen in the expression graphs and boxplot.
This like the BMP2 data shows there are huge differences in the stats between the reps. I re ran the previous data without removing the outliers to see how it changes the data.
Expression Bargraph
Statistics
Call:
aov(formula = expression ~ Pop + Treat + Pop:Treat, data = rep2res2)
Terms:
Pop Treat Pop:Treat Residuals
Sum of Squares 3.811151e-19 2.405560e-20 3.873500e-21 1.510927e-18
Deg. of Freedom 2 1 2 42
Residual standard error: 1.896693e-10
Estimated effects may be unbalanced
> TukeyHSD(fit)
Tukey multiple comparisons of means
95% family-wise confidence level
Fit: aov(formula = expression ~ Pop + Treat + Pop:Treat, data = rep2res2)
$Pop
p adj
N-H 0.0145606
S-H 0.9658692
S-N 0.0273635
$Treat
p adj
T-C 0.418125
$`Pop:Treat`
p adj
N:C-H:C 0.4354280
S:C-H:C 0.9999831
H:T-H:C 0.9888451
N:T-H:C 0.5629155
S:T-H:C 0.9980358
S:C-N:C 0.5358964
H:T-N:C 0.1506397
N:T-N:C 0.9999464
S:T-N:C 0.2184309
H:T-S:C 0.9688693
N:T-S:C 0.6656163
S:T-S:C 0.9911381
N:T-H:T 0.2232571
S:T-H:T 0.9999602
S:T-N:T 0.3113530
Even with the outliers the expression changes enough that stats still show there being a significant difference between the oyster bay population and the other two sites. This can be seen with the boxplot below.
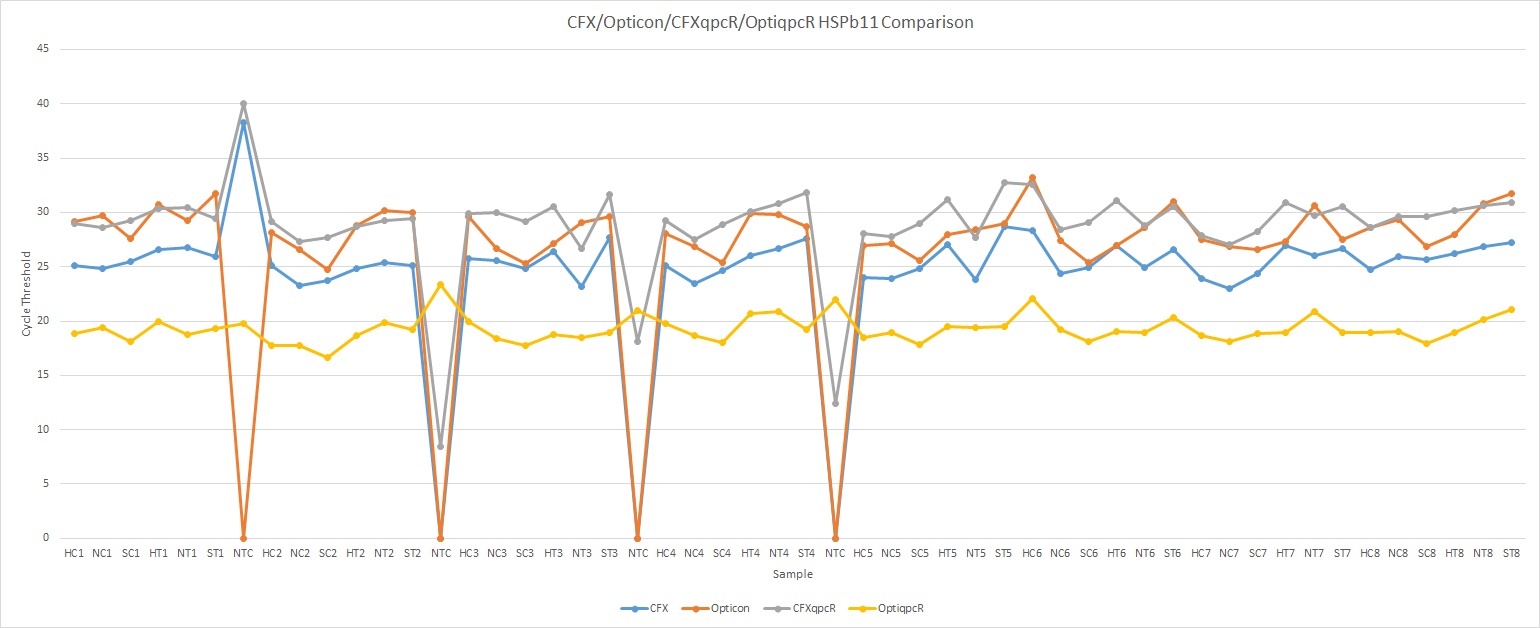
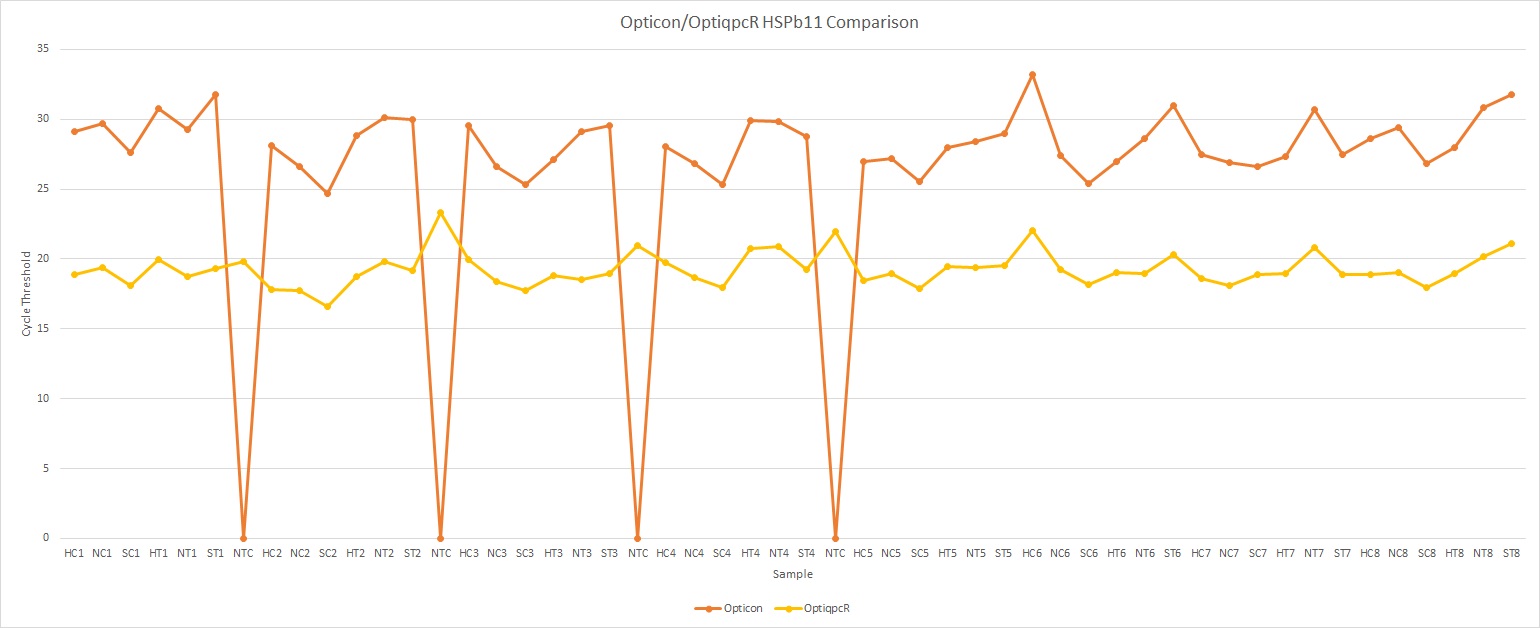
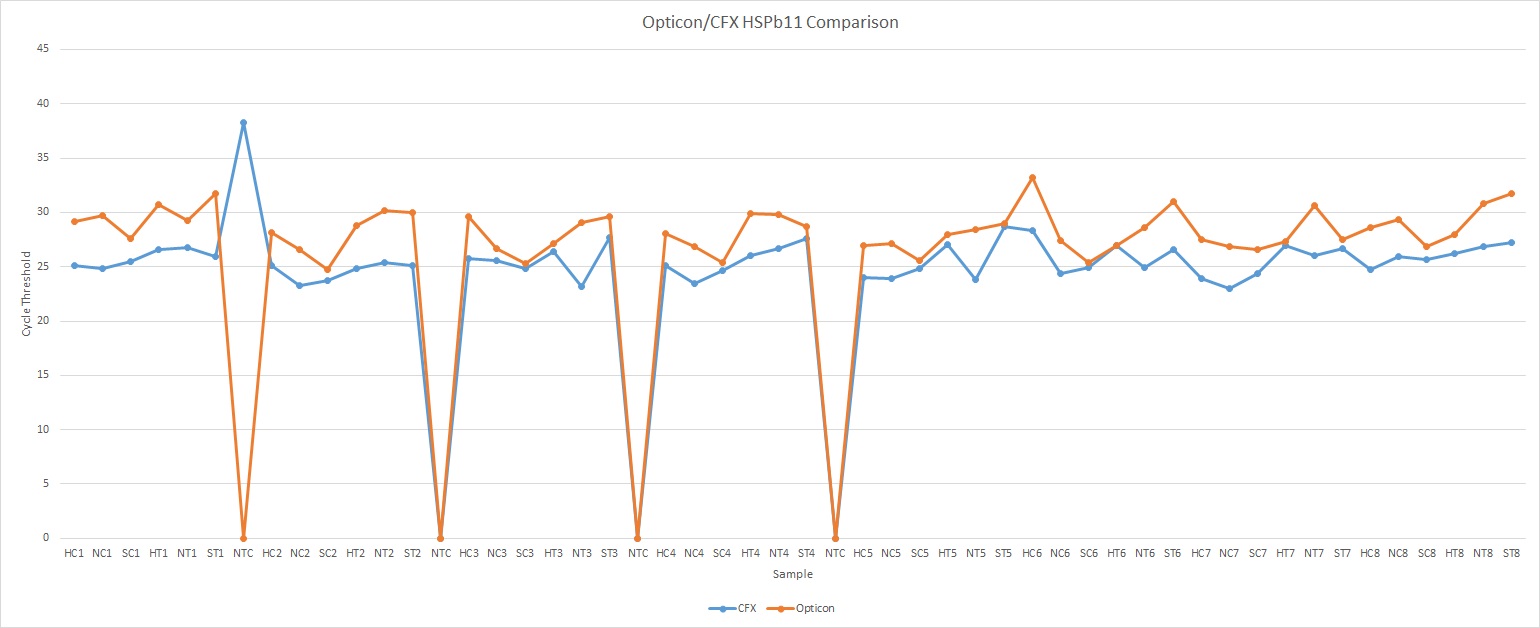
For comparison sake I pulled out the Ct values from qpcR for both the CFX and Opticon data to compare to the Ct values generated by the Opticon and CFX programs. Below are some line graphs produced from the Ct data.
All
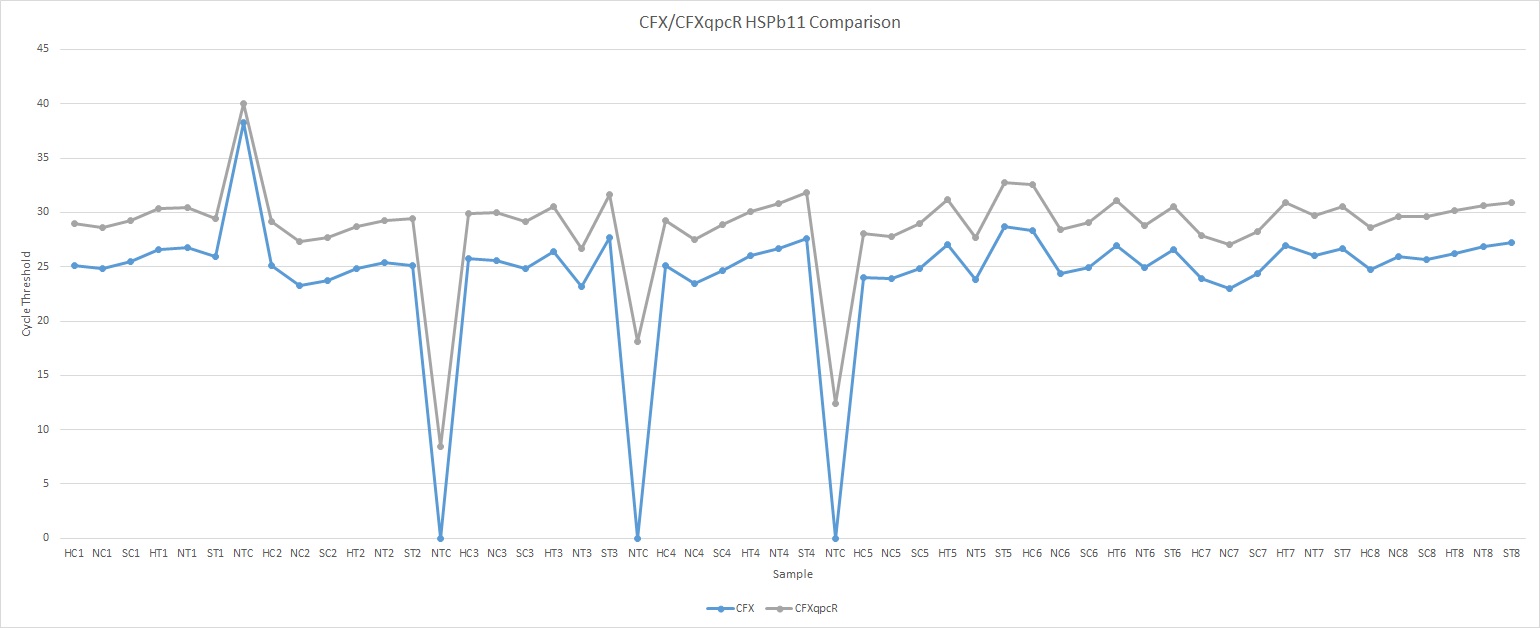
CFX/CFXqpcR
Opticon/OptiqpcR
Opticon/CFX
OptiqpcR/CFXqpcR
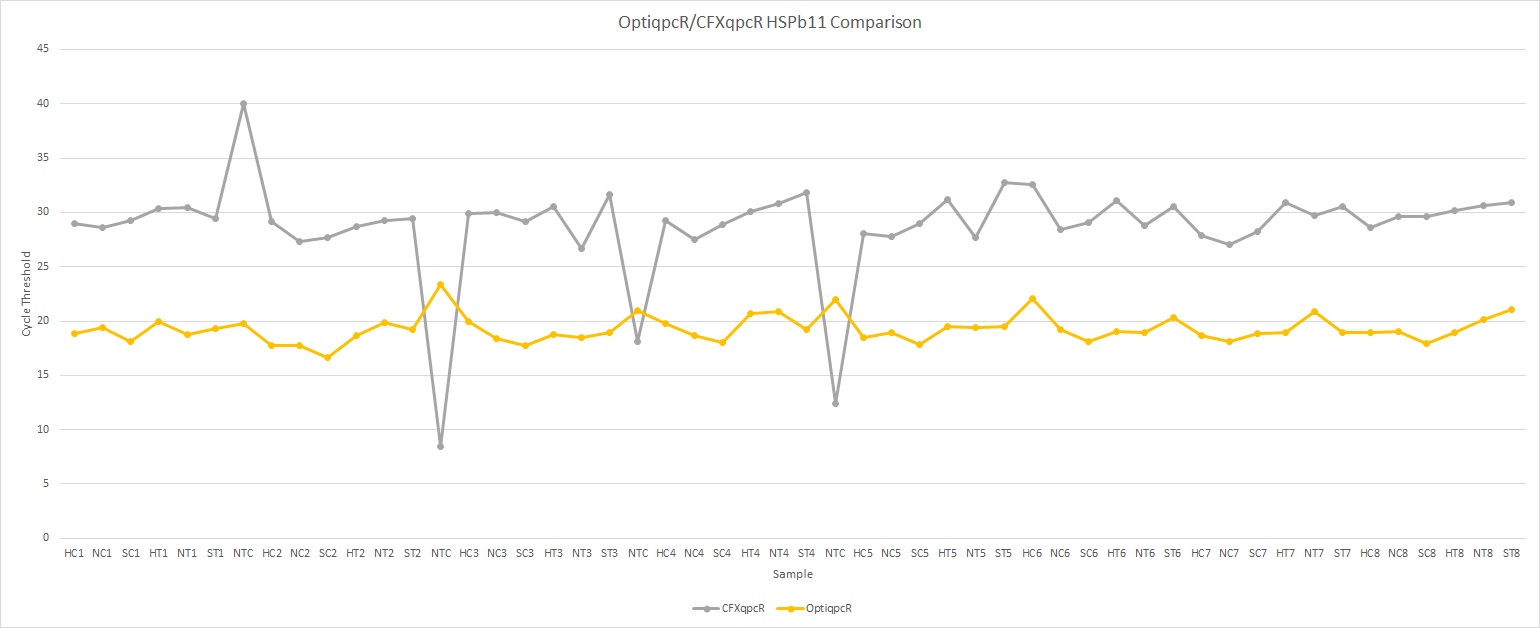
You can see that the Opticon and OptiqpcR values don't match. The qpcR values are somewhat deflated compared to the Opticon ct values. The CFX and CFXqpcR data looks much closer with only some small differences between the read outs.
It looks like the qpcR package doesn't handle the raw fluorescence data from the Opticon as well as it does with the CFX data. This suggests that the CFX may be the better machine.
Sadly this doesn't fix the issue between the reps as the BMP2 data was run on the same machine. I'm unsure what to do at this point.
You can see the raw data for the qPCR runs last week here and this week here. You can also see the Ct value comparison CSV here.