Primers:
| 1624 | p29ING4_FWD | TACCTTTGGGCTTCACCGTC | JH | 5/21/2015 | 20 | 55 | O.lurida | Inhibitor of growth protein 4 (p29ING4) | Q8C0D7 | |
| 1623 | p29ING4_REV | GTCCATCACACACCCCTCAG | JH | 5/21/2015 | 20 | 55 | O.lurida | Inhibitor of growth protein 4 (p29ING4) | Q8C0D7 |
Reagent Table:
| Volume | Reactions X116 | |
| Ssofast Evagreen MM | 10 | 1160 |
| FWD Primer | 0.5 | 58 |
| REV Primer | 0.5 | 58 |
| 1:9 cDNA | 9 |
- Added reagents from greatest to least volume
- Vortexed
- Centrifuged briefly
- Pipetted 11 ul Master Mix to each tube
- Pipetted 9 ul of 1:9 cDNA each column using a channel pipetter
- Centrifuged plate at 2000 rpm for 1 minute
- Ran Program Below
Program:
| Step | Temperature | Time |
| Initiation | 95 C | 10 min |
| Elongation | 95 C | 30 sec |
| 60 C | 1 min | |
| Read | ||
| 72 C | 30 sec | |
| Read | ||
| Repeat Elongation 39 times | ||
| Termination | 95 C | 1 min |
| 55 C | 1 sec | |
| Melt Curve Manual ramp 0.2C per sec Read 0.5 C | 55 - 95 C | 30 sec |
| 21 C | 10 min | |
| End |
Plate Layout:
| 1 | 2 | 3 | 4 | 5 | 6 | 7 |
| DNased 42215 HC1 | DNased 42215 NC1 | DNased 42215 SC1 | DNased 42215 HT1 1 | DNased 42215 NT1 1 | DNased 42215 ST1 1 | NTC |
| DNased 42215 HC2 | DNased 42215 NC2 | DNased 42215 SC2 | DNased 42215 HT1 2 | DNased 42215 NT1 2 | DNased 42215 ST1 2 | NTC |
| DNased 42215 HC3 | DNased 42215 NC3 | DNased 42215 SC3 | DNased 42215 HT1 3 | DNased 42215 NT1 3 | DNased 42215 ST1 3 | NTC |
| DNased 42215 HC4 | DNased 42215 NC4 | DNased 42215 SC4 | DNased 42215 HT1 4 | DNased 42215 NT1 4 | DNased 42215 ST1 4 | NTC |
| DNased 42215 HC5 | DNased 42215 NC5 | DNased 42215 SC5 | DNased 42215 HT1 5 | DNased 42215 NT1 5 | DNased 42215 ST1 5 | |
| DNased 42215 HC6 | DNased 42215 NC6 | DNased 42215 SC6 | DNased 42215 HT1 6 | DNased 42215 NT1 6 | DNased 42215 ST1 6 | |
| DNased 42215 HC7 | DNased 42215 NC7 | DNased 42215 SC7 | DNased 42215 HT1 7 | DNased 42215 NT1 7 | DNased 42215 ST1 7 | |
| DNased 42215 HC8 | DNased 42215 NC8 | DNased 42215 SC8 | DNased 42215 HT1 8 | DNased 42215 NT1 8 | DNased 42215 ST1 8 |
Results:
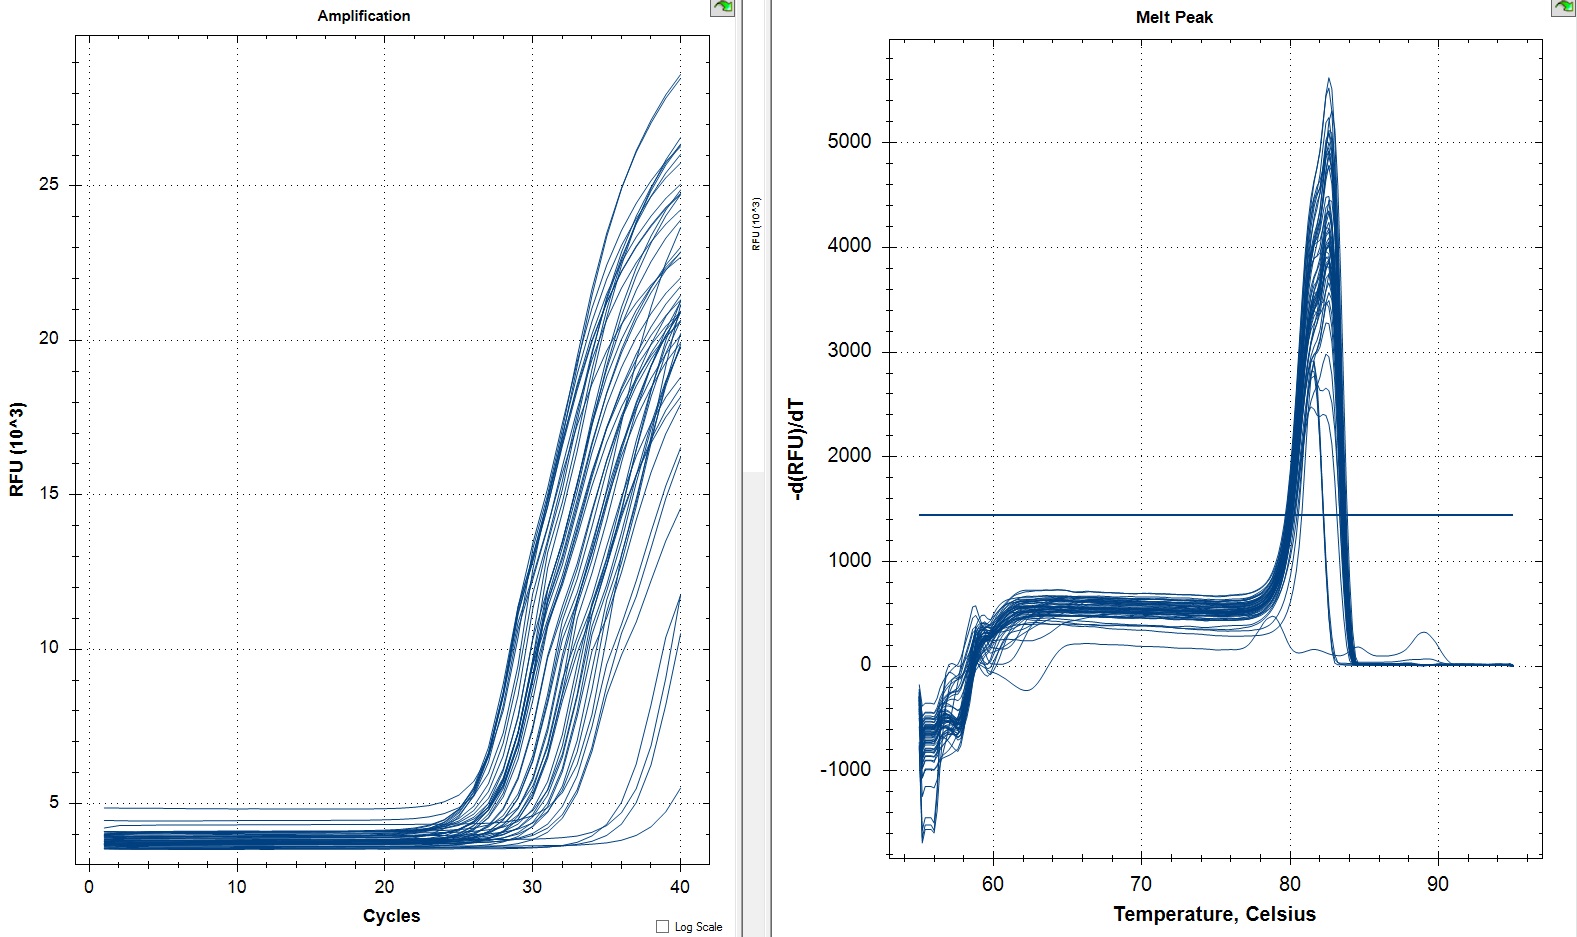
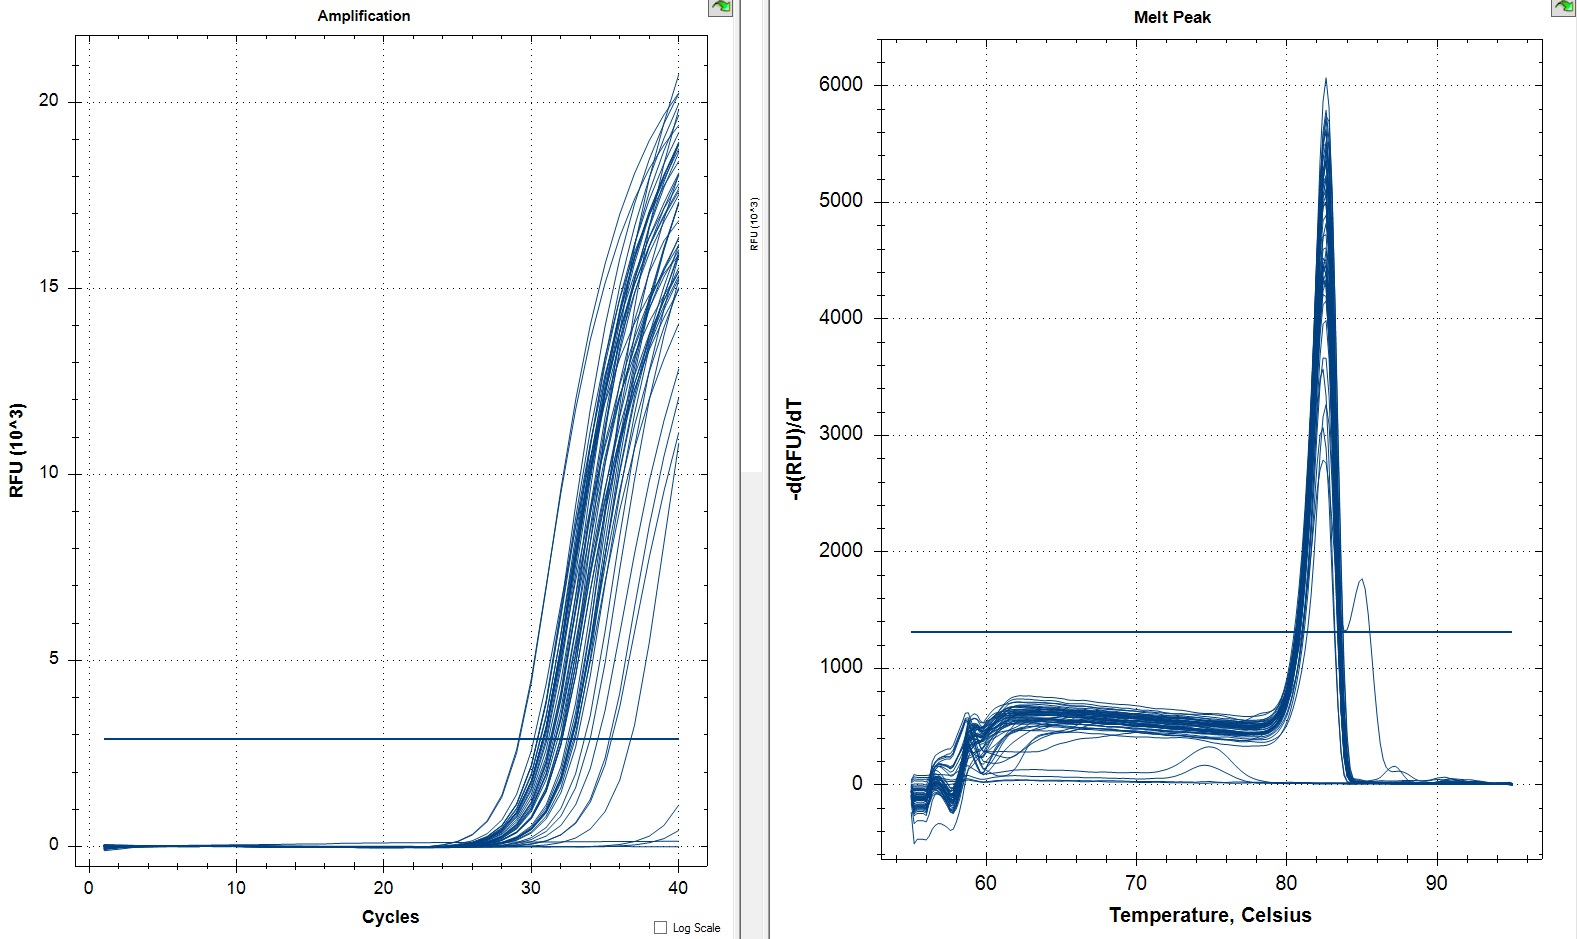
All samples
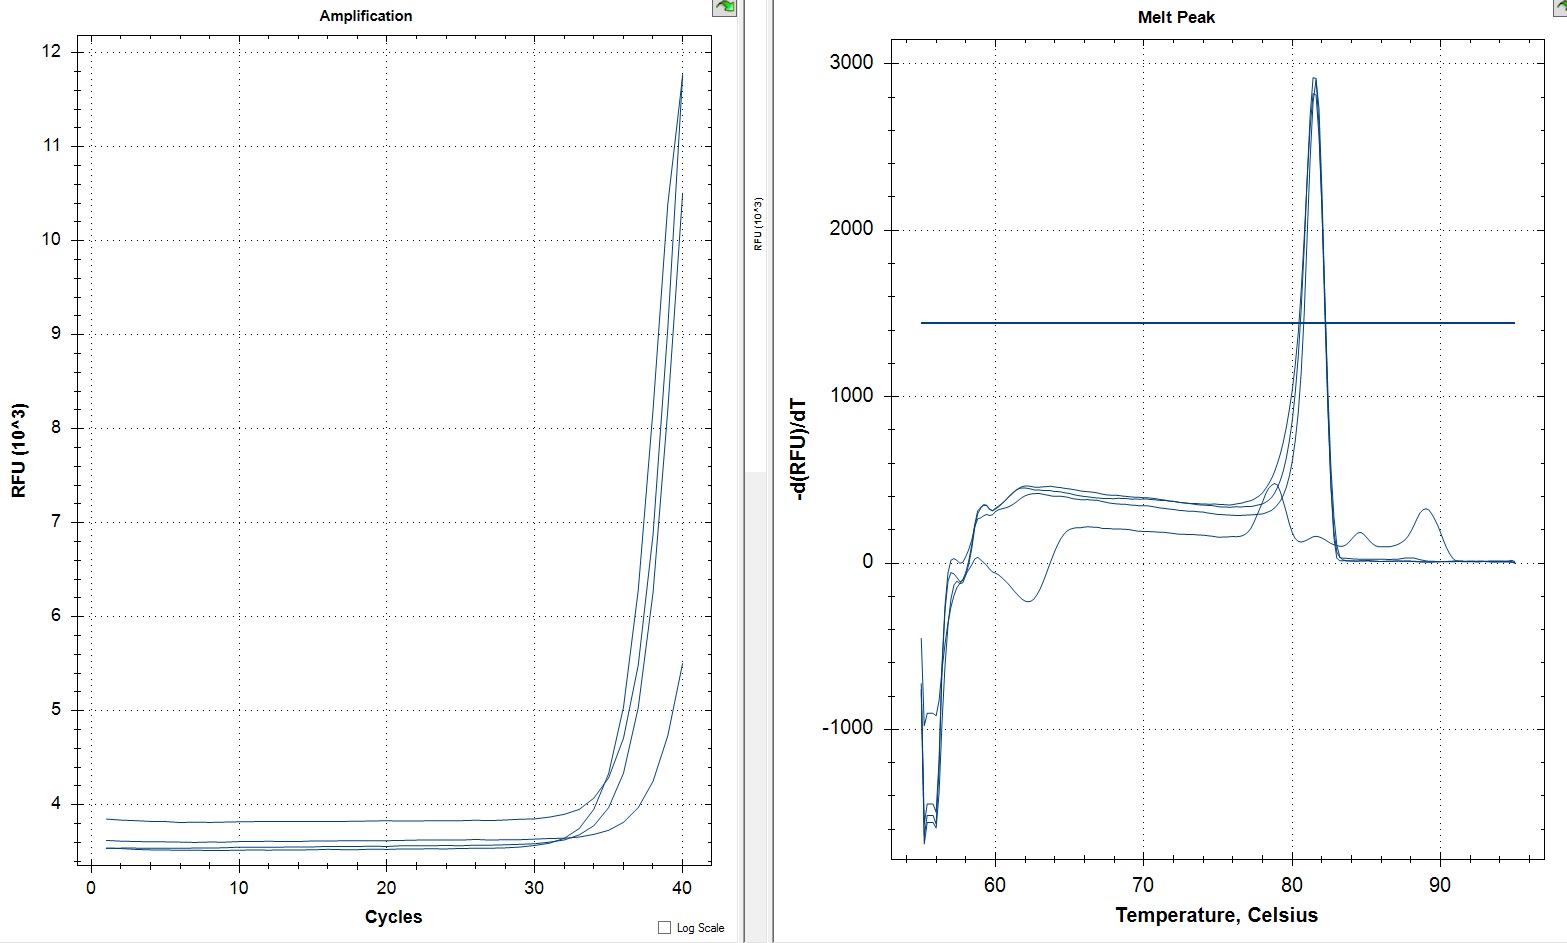
NTCs
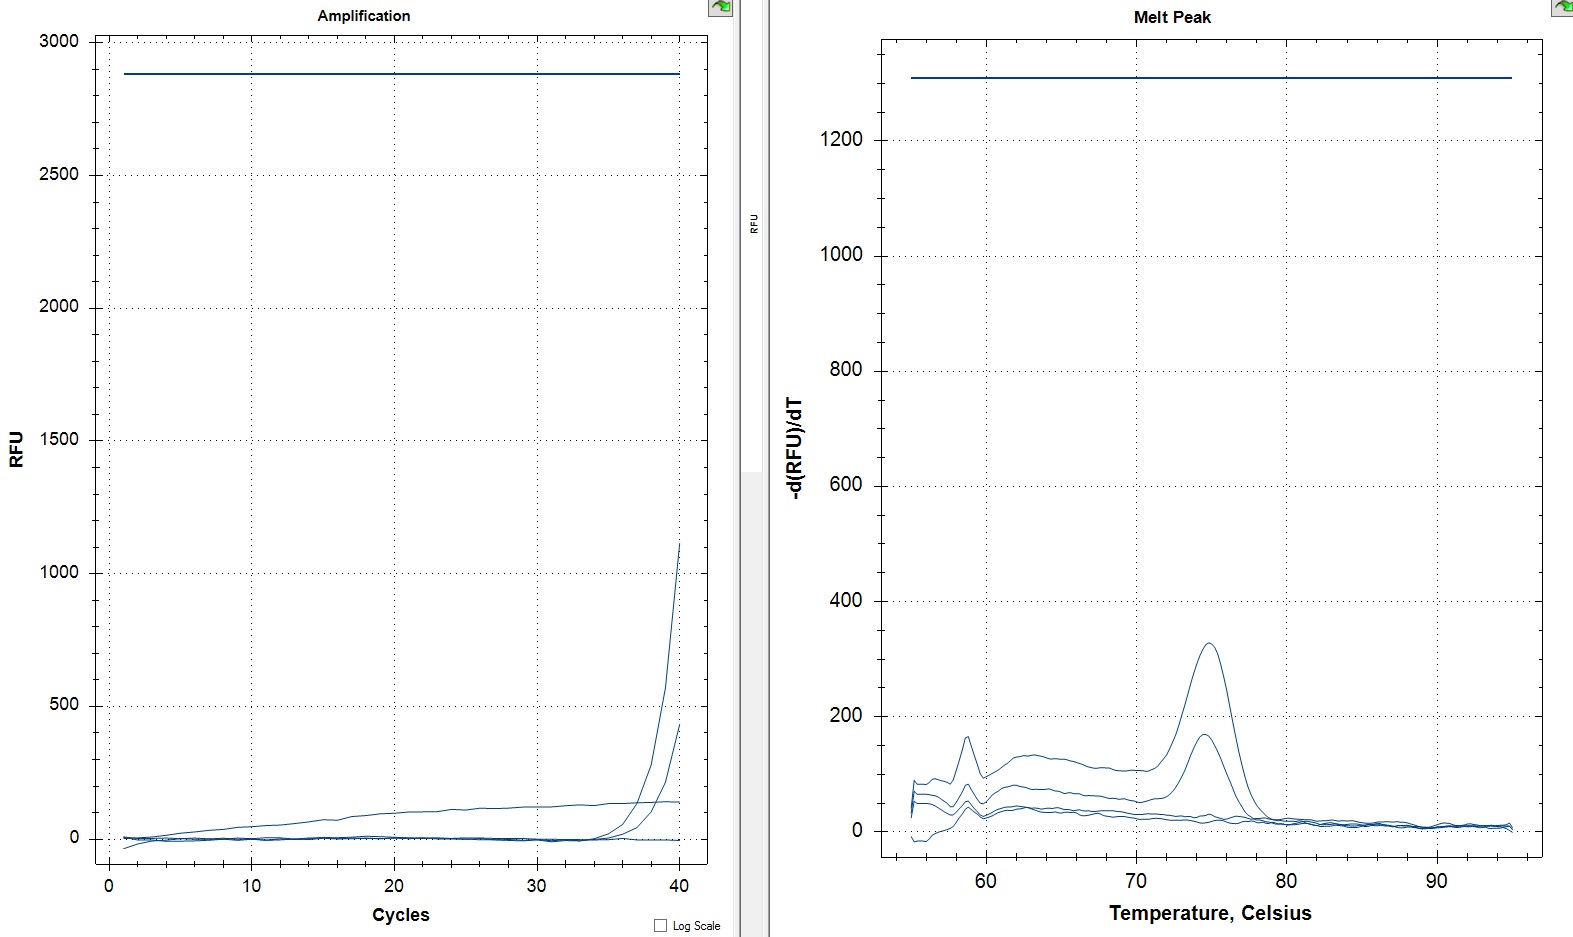
These amplification curves look much better than the GRB2. There is some minor amplification in 2 of the 4 NTCs but the product was smaller than the target. The one weird issue is that one sample has a double peak in the melt curve. I'm not sure what caused this as it doesn't appear anywhere else. It may be something odd with the gene being expressed. I then analyzed the data with my stats and graphs script to see what the significant differences are.
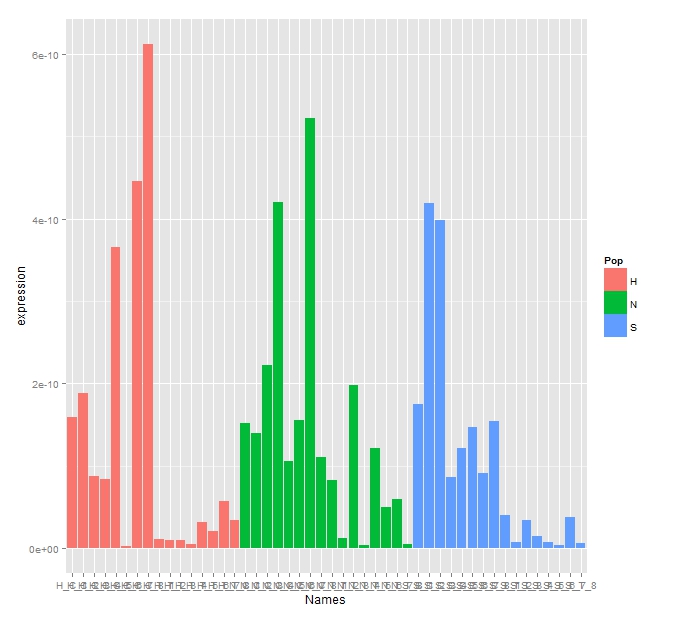
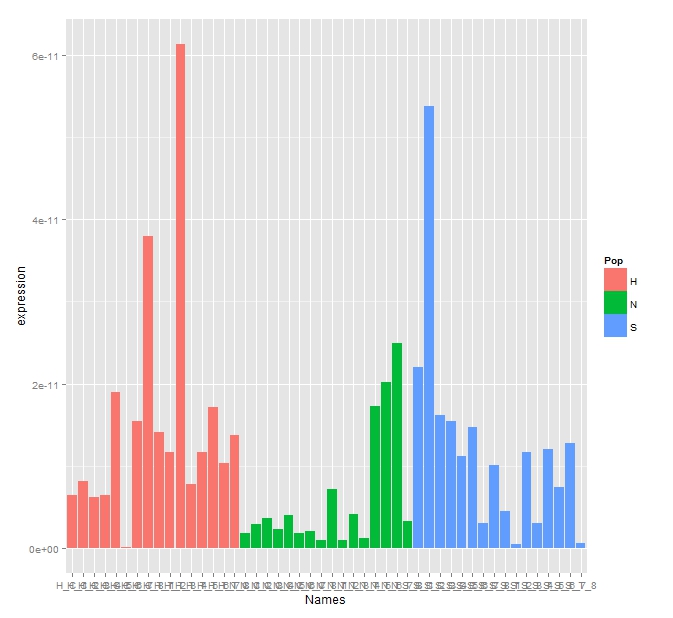
Adjusted Expression Bargraph
Adjusted Statistics
One Way ANOVA comparing Population Controls
Call:
aov(formula = expression ~ Pop, data = rep2res2[Treat == "C"])
Terms:
Pop Residuals
Sum of Squares 1.026249e-21 2.641735e-21
Deg. of Freedom 2 21
Residual standard error: 1.121592e-11
Estimated effects may be unbalanced
> TukeyHSD(fit2)
Tukey multiple comparisons of means
95% family-wise confidence level
Fit: aov(formula = expression ~ Pop, data = rep2res2[Treat == "C"])
$Pop
diff lwr upr p adj
N-H 0.1997946
S-H 0.5595058
S-N 0.0263669
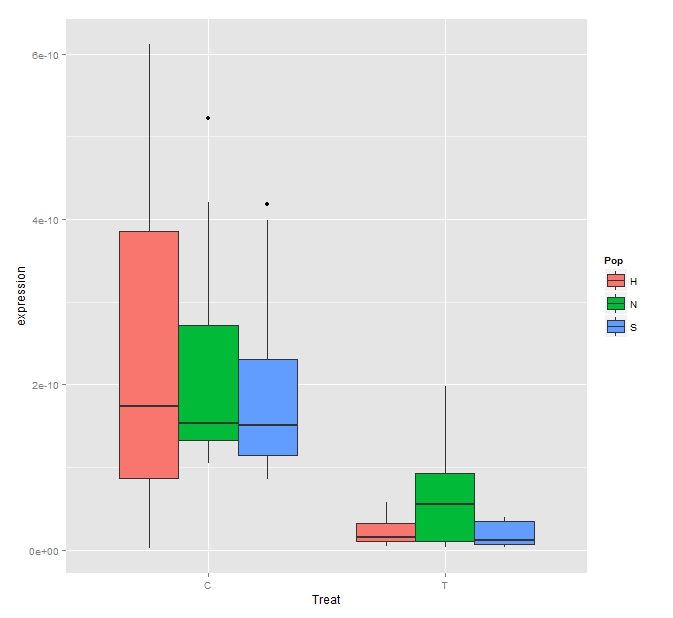
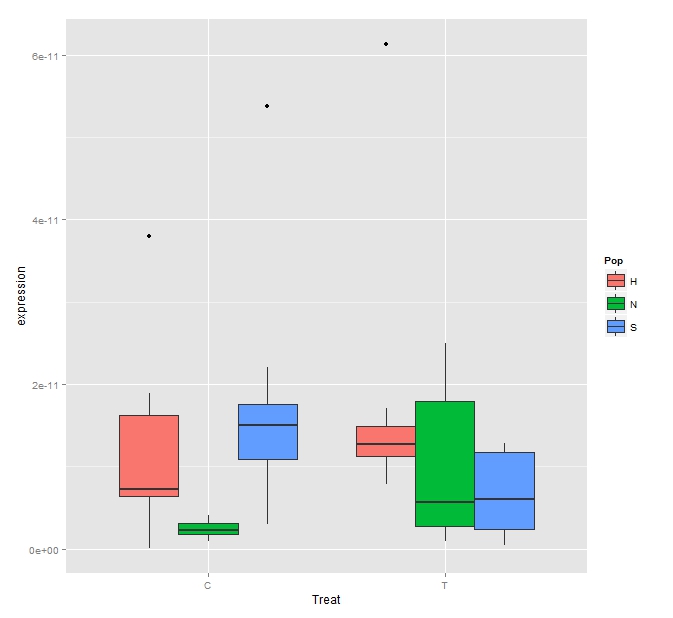
Only the Oyster Bay was significantly different from Fidalgo in the control group.The bloxplot represents this very well.
Adjusted Expression Boxplot
You can see the raw data here.