On Friday I created cDNA using a complicated system calculate concentration and volume of RNA needed to produce equivalent concentrations of cDNA across the board.
First I need to get updated concentrations on all the RNA samples to calculate the volume needed for cDNA creation.
| Sample ID | Date | ng/ul | A260 | A280 | 260/280 | 260/230 |
| 42715ST1 | 5/8/2015 | 385.82 | 9.646 | 5.076 | 1.9 | 0.94 |
| 42715ST2 | 5/8/2015 | 287.1 | 7.178 | 3.929 | 1.83 | 0.71 |
| 42715ST3 | 5/8/2015 | 267.75 | 6.694 | 3.623 | 1.85 | 0.89 |
| 42715ST4 | 5/8/2015 | 322.48 | 8.062 | 4.324 | 1.86 | 0.77 |
| 42715ST5 | 5/8/2015 | 244.87 | 6.122 | 3.424 | 1.79 | 0.66 |
| 42715HT1 | 5/8/2015 | 172.11 | 4.303 | 2.502 | 1.72 | 0.57 |
| 42715HT2 | 5/8/2015 | 323.01 | 8.075 | 4.359 | 1.85 | 0.75 |
| 42715HT3 | 5/8/2015 | 141.12 | 3.528 | 1.808 | 1.95 | 1.5 |
| 42715HT4 | 5/8/2015 | 177.02 | 4.425 | 2.597 | 1.7 | 0.59 |
| 42715HT5 | 5/8/2015 | 294.26 | 7.357 | 4.019 | 1.83 | 0.72 |
| 42815SM1 | 5/8/2015 | 110.13 | 2.753 | 1.482 | 1.86 | 0.96 |
| 42815SM2 | 5/8/2015 | 43.08 | 1.077 | 0.624 | 1.73 | 0.57 |
| 42815SM3 | 5/8/2015 | 38.87 | 0.972 | 0.638 | 1.52 | 0.42 |
| 42815SM4 | 5/8/2015 | 112.83 | 2.821 | 1.738 | 1.62 | 0.42 |
| 42815SM5 | 5/8/2015 | 67.16 | 1.679 | 1.047 | 1.6 | 0.36 |
| 42815HM1 | 5/8/2015 | 52.7 | 1.318 | 0.758 | 1.74 | 0.75 |
| 42815HM2 | 5/8/2015 | 72.28 | 1.807 | 1.202 | 1.5 | 0.35 |
| 42815HM3 | 5/8/2015 | 59.05 | 1.476 | 1.043 | 1.42 | 0.26 |
| 42815HM4 | 5/8/2015 | 82.5 | 2.062 | 1.27 | 1.62 | 0.34 |
| 42815HM5 | 5/8/2015 | 128.42 | 3.21 | 1.911 | 1.68 | 0.4 |
Per Sam's instructions on the genefish wiki:
- Use as much RNA as possible (up to 1ug); max volume of RNA = 17.75uL. Generally, identify the RNA sample with the lowest concentration and multiply by 17.75uL. Use this quantity (ug) of RNA for each and every sample.
- Transfer calculated volume(s) of RNA to 0.5mL snap cap tubes or PCR plate. Adjust volumes of individual samples to 17.75uL with H2O.
- Add appropriate amount of primer to sample. Use 0.25ug primer per 1ug of RNA in sample (= 0.5uL of Promega oligo dT Cat#C1101 in this example). Total volume (RNA + primers) should equal 18.25uL.
Sample SM3 was the lowest concentration on the table. To use a max of 17.75 ul of RNA I could only produce 690 ng of RNA with SM3. I set the bar to 690 ng and made the following calculations of RNA, Water, and Primer needed. SM2 and SM3 still ended up producing a volume larger than desired due to me having to use a 1:10 dilution of primer to account for the less than optimum concentration of RNA. Instead of using the standard 0.5 ul of oligo Primer, I used 0.345 which I diluted in a 1:10 ratio. For the 1:10 dilution I added 7.6 ul of oligo primer to 76 ul of water to generation 22 reactions worth of primer.
| Sample ID | ng/ul | ul RNA for 690 ng | ul h20 for 17.90 | 1:10 primer ul | total volume |
| 42715ST1 | 385.82 | 1.79 | 13.01 | 3.45 | 18.25 |
| 42715ST2 | 287.1 | 2.40 | 12.39 | 3.45 | 18.25 |
| 42715ST3 | 267.75 | 2.58 | 12.22 | 3.45 | 18.25 |
| 42715ST4 | 322.48 | 2.14 | 12.66 | 3.45 | 18.25 |
| 42715ST5 | 244.87 | 2.82 | 11.98 | 3.45 | 18.25 |
| 42715HT1 | 172.11 | 4.01 | 10.79 | 3.45 | 18.25 |
| 42715HT2 | 323.01 | 2.14 | 12.66 | 3.45 | 18.25 |
| 42715HT3 | 141.12 | 4.89 | 9.91 | 3.45 | 18.25 |
| 42715HT4 | 177.02 | 3.90 | 10.90 | 3.45 | 18.25 |
| 42715HT5 | 294.26 | 2.34 | 12.45 | 3.45 | 18.25 |
| 42815SM1 | 110.13 | 6.27 | 8.53 | 3.45 | 18.25 |
| 42815SM2 | 43.08 | 16.02 | 0.00 | 3.45 | 19.47 |
| 42815SM3 | 38.87 | 17.75 | 0.00 | 3.45 | 21.20 |
| 42815SM4 | 112.83 | 6.12 | 8.68 | 3.45 | 18.25 |
| 42815SM5 | 67.16 | 10.27 | 4.52 | 3.45 | 18.25 |
| 42815HM1 | 52.7 | 13.09 | 1.70 | 3.45 | 18.25 |
| 42815HM2 | 72.28 | 9.55 | 5.25 | 3.45 | 18.25 |
| 42815HM3 | 59.05 | 11.69 | 3.11 | 3.45 | 18.25 |
| 42815HM4 | 82.5 | 8.36 | 6.43 | 3.45 | 18.25 |
| 42815HM5 | 128.42 | 5.37 | 9.42 | 3.45 | 18.25 |
1. Added the water first
2. Added the RNA
3. Added the primer to each reaction tube.
4. Incubated in the Thermocycler for 5 minutes at 70 C
5. Immediately transferred to ice after completion.
Then I made up the reverse transcriptase master mix:
| Reagents | Volume ul | Reactions X22 |
| M-MLV RT Buffer | 5 | 110 |
| 10 mM dNTPs | 1.25 | 27.5 |
| M-MLV RT | 0.345 | 7.59 |
| H20 | 0.155 | 3.41 |
| Total Volume | 6.75 | 148.5 |
1.Added 6.75 ul of the master mix to each tube.
2. Ran the following program on the thermocycler.
| Amplify | 42 C | 1 hr |
| Inactivate | 95 C | 3 min |
During the program run I picked up the new primers from the science depot in the med school.
I rehydrated the primer stock with Nanopure H20 since no TE was available. I determined the rehydration volume based on the nanoMolar concentrations. I then made working stock from these rehydrated stocks using a 1:10 dilution of 10 ul primer to 90 ul Nanopure H20.
Once the cDNA amplification was complete I ran a Primer/cDNA check using a qPCR and all the primers we are using for 310 lab.
Primers:
Superoxide dismutase (SD)
Glutamine synthetase (GS)
Citrate synthase (CS)
HSP70 (HSP)
Actin (ACT)
I made a Master Mix for 6 reactions for each of the 5 primers.
| Volume | Reactions X6 |
| Ssofast Evagreen MM | 10 | 60 |
| FWD Primer | 0.5 | 3 |
| REV Primer | 0.5 | 3 |
| Nuclease Free H2O | 8 | 48 |
I ran a template control and a positive control (Fidalgo seed oysters extracted on 3/23/2015 with a concentration of 167.3 ng/ul) for each primer as well as 4 cDNA samples I produced.
Plate layout:
| 8 | 9 | 10 | 11 | 12 |
| SD | GS | CS | HSP | ACT |
| C- | C- | C- | C- | C- |
| C+ | C+ | C+ | C+ | C+ |
| 42715ST1 | 42715HT1 | 42715SM1 | 42715HM1 | 42715ST5 |
| 42715ST2 | 42715HT2 | 42715SM2 | 42715HM2 | 42715HT5 |
| 42715ST3 | 42715HT3 | 42715SM3 | 42715HM3 | 42715SM5 |
| 42715ST4 | 42715HT4 | 42715SM4 | 42715HM4 | 42715HM5 |
I ran the following program:
| Sybr New Plate+Sybr cDNA 55 melt 2 | | |
| Step | Temperature | Time |
| Initiation | 95 C | 10 min |
| Elongation | 95 C | 15 sec |
| 55 C | 15 sec |
| Read | | |
| 72 C | 15 sec |
| Read | | |
| Repeat Elongation 40 times | | |
| Termination | 95 C | 1 min |
| 55 C | 1 sec |
| Melt Curve Manual ramp 0.2C per sec Read 0.5 C | 65 - 95 C | 30 sec |
| 21 C | 10 min |
| End | |
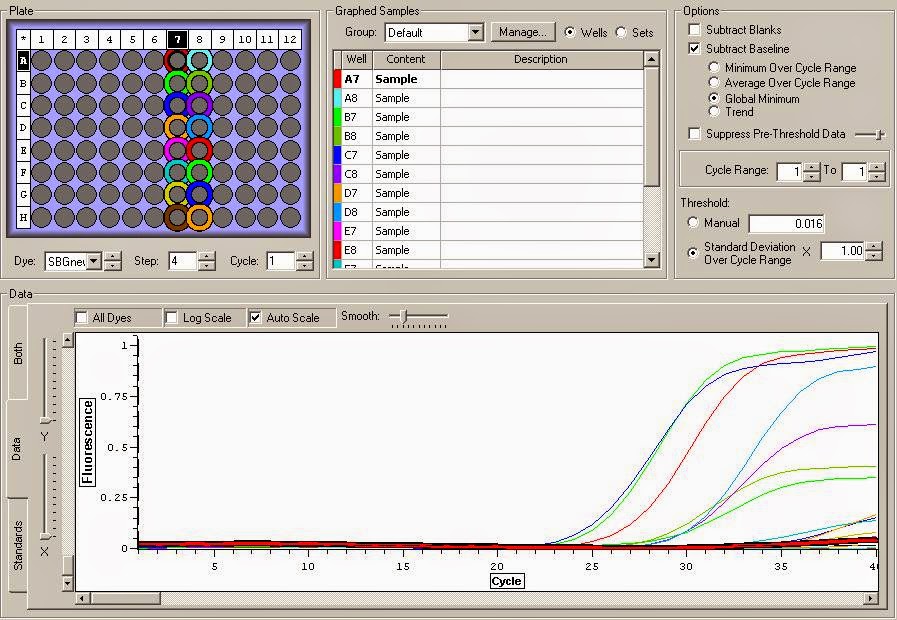
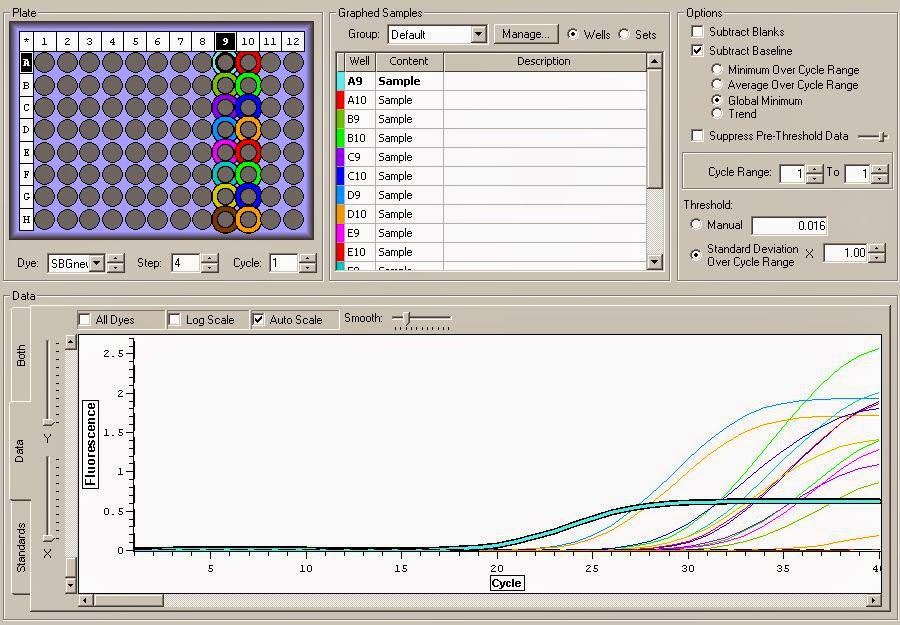
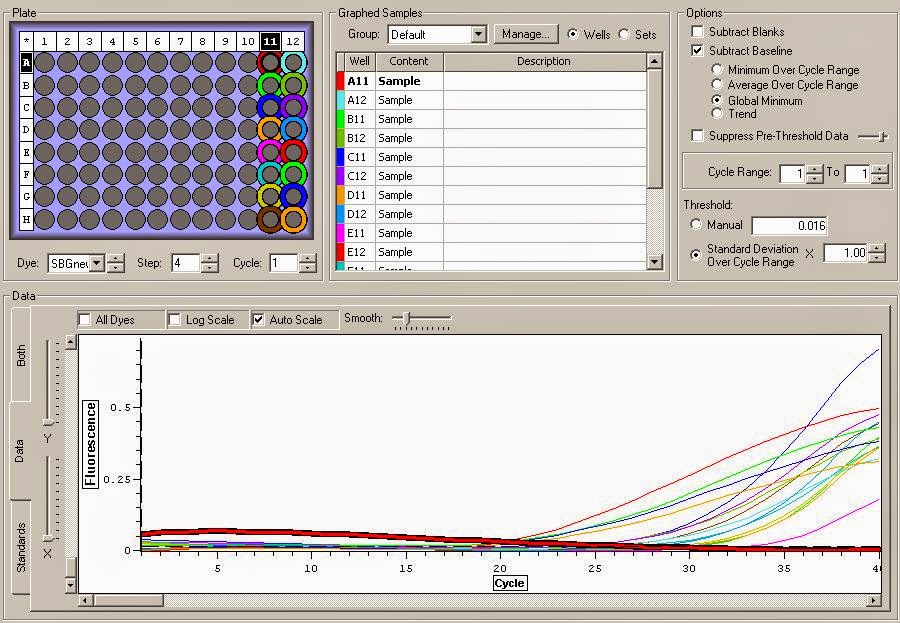
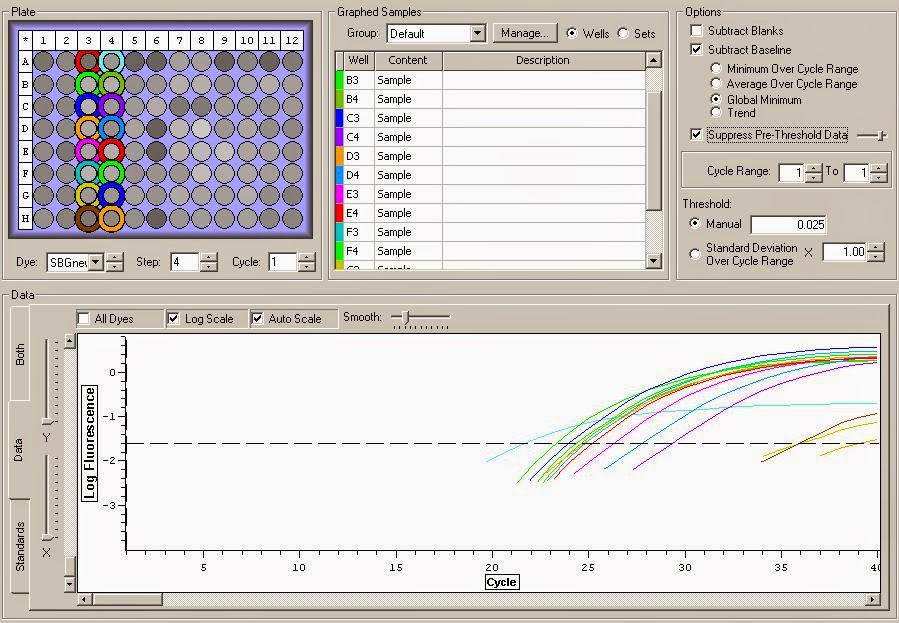
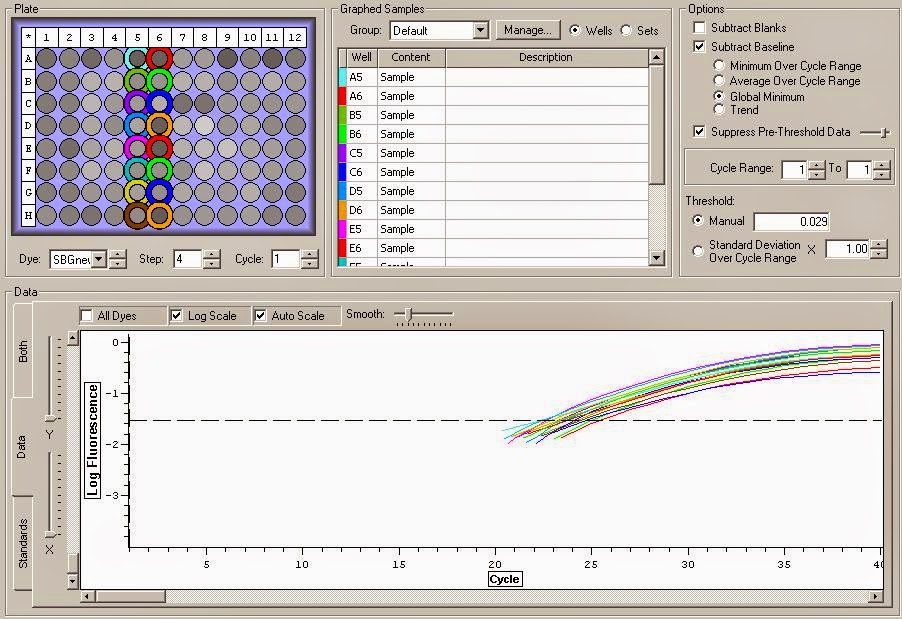
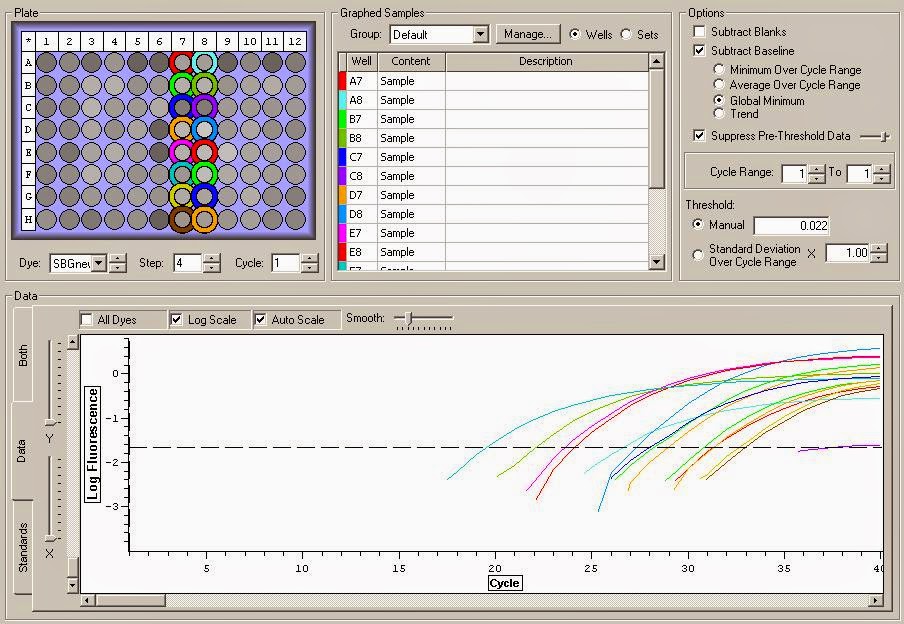
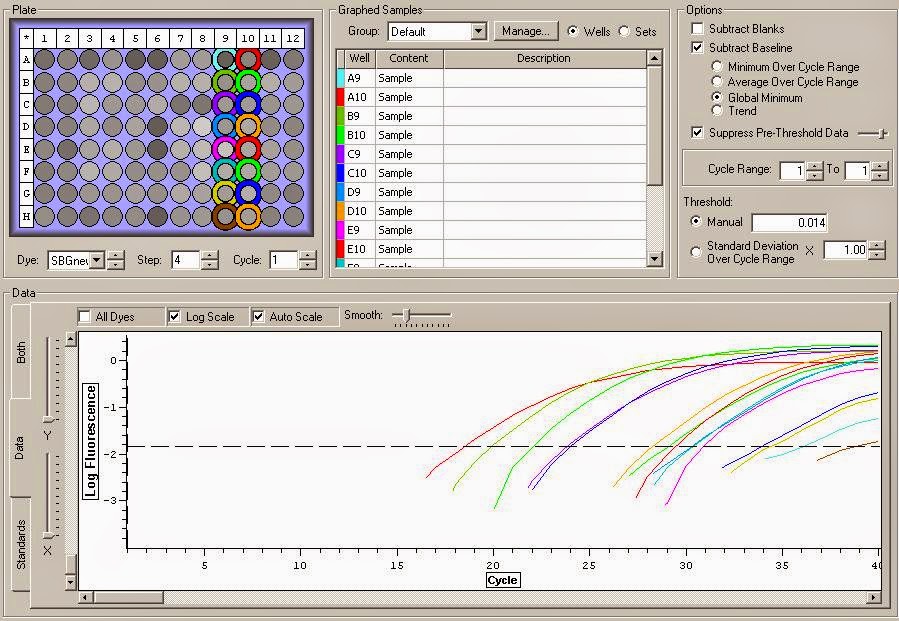
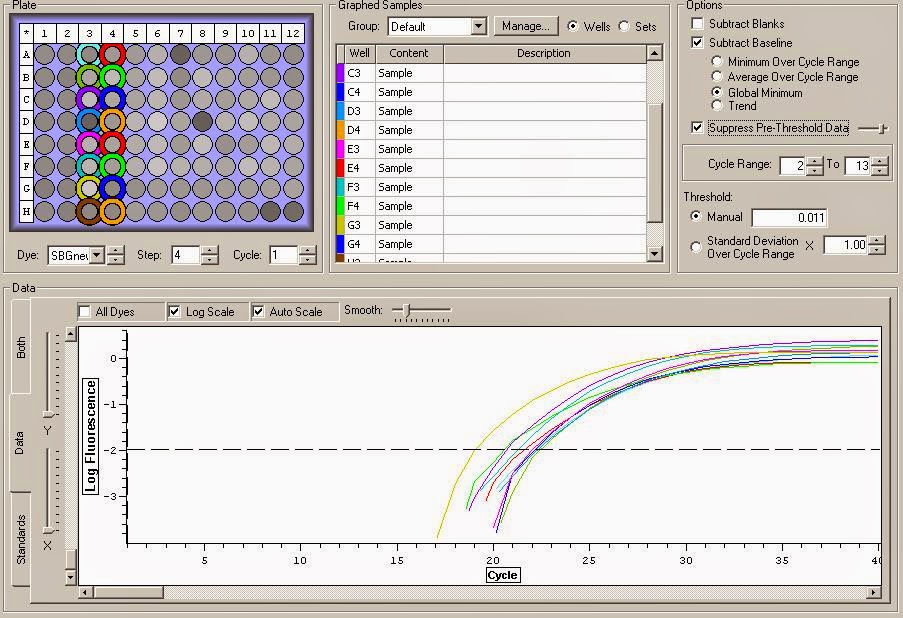
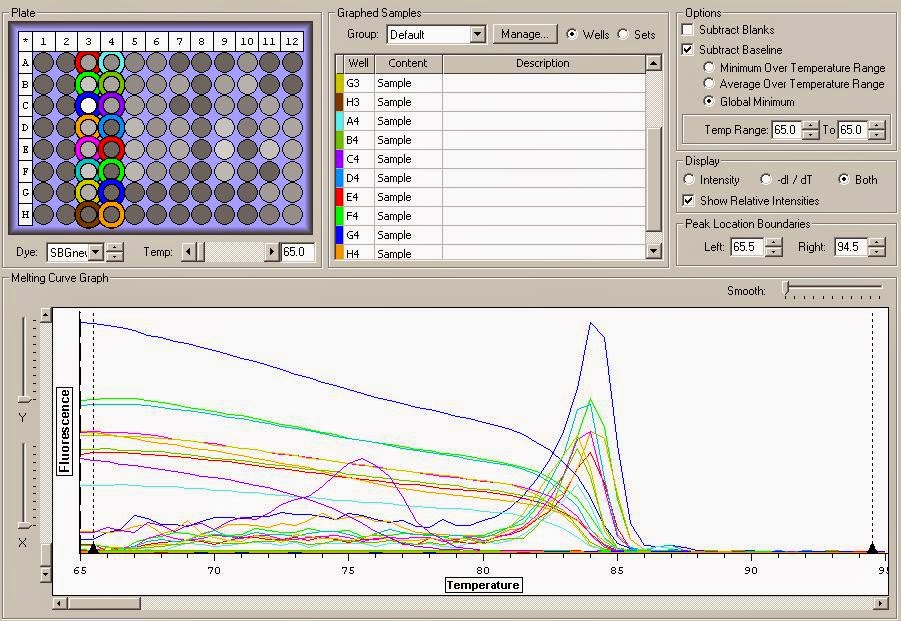
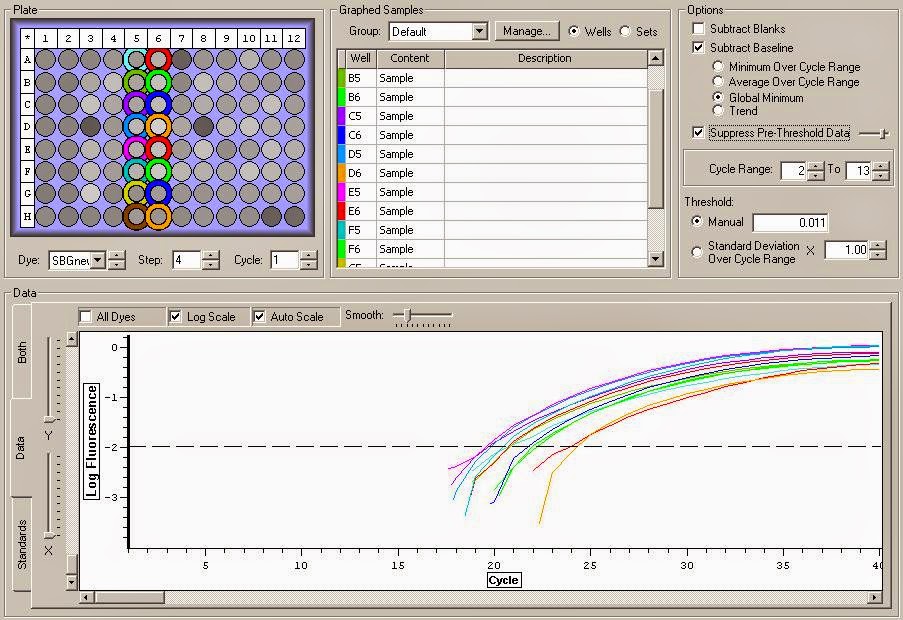
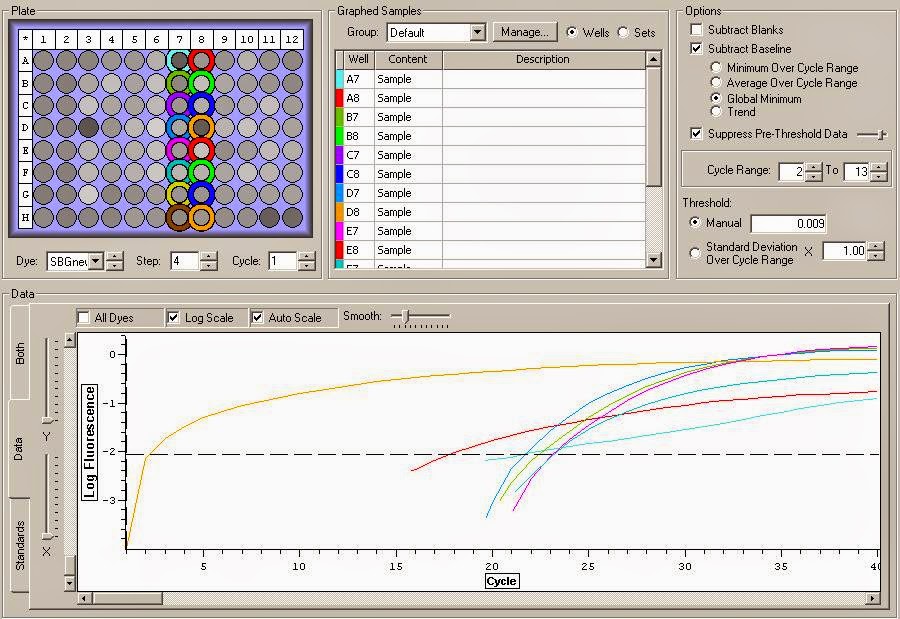
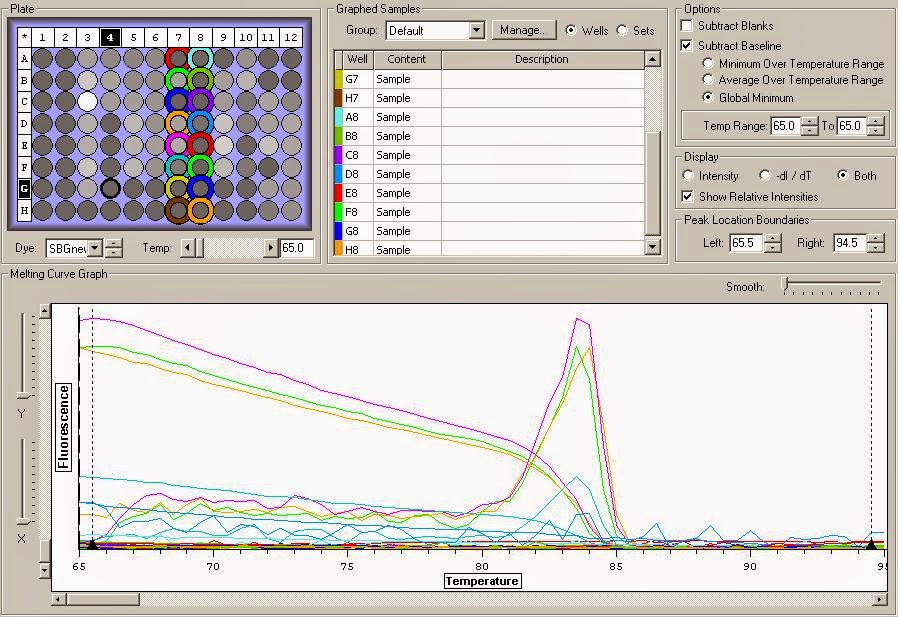
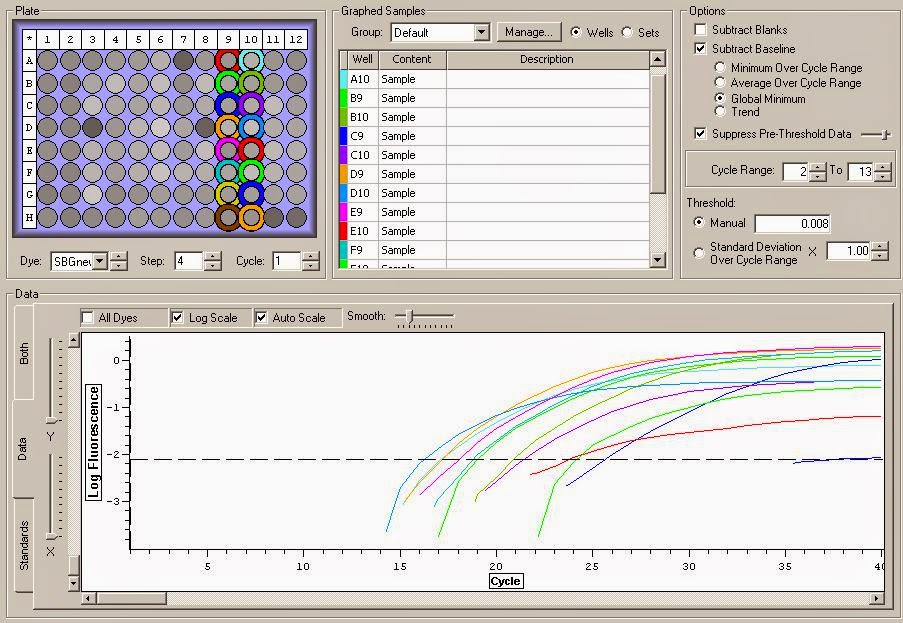
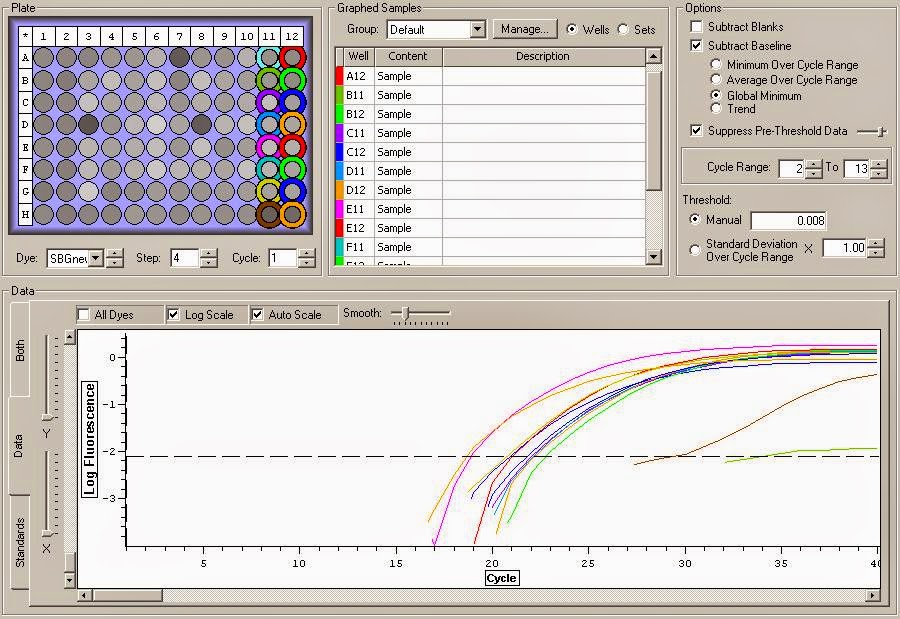
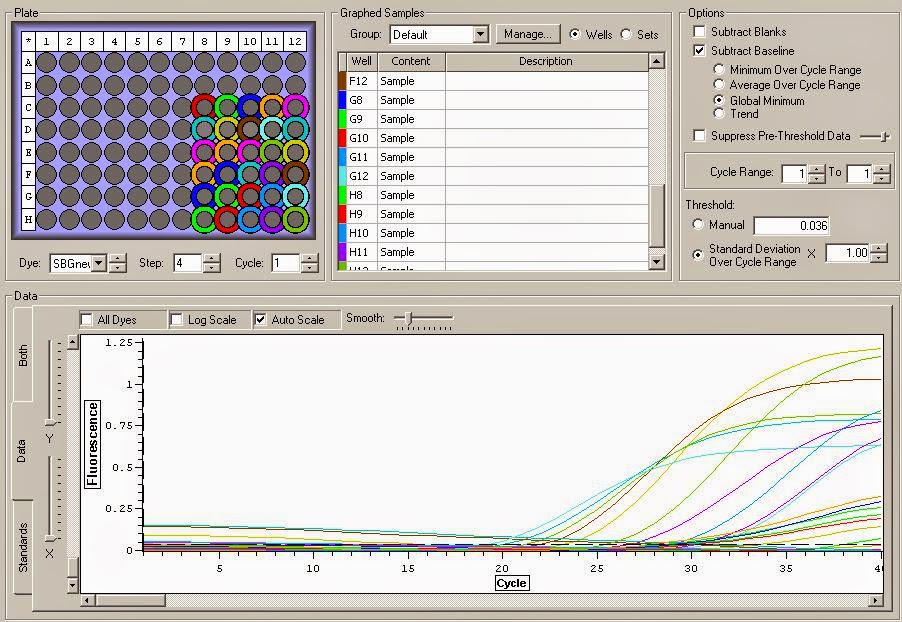
You can see the amplification curves below:
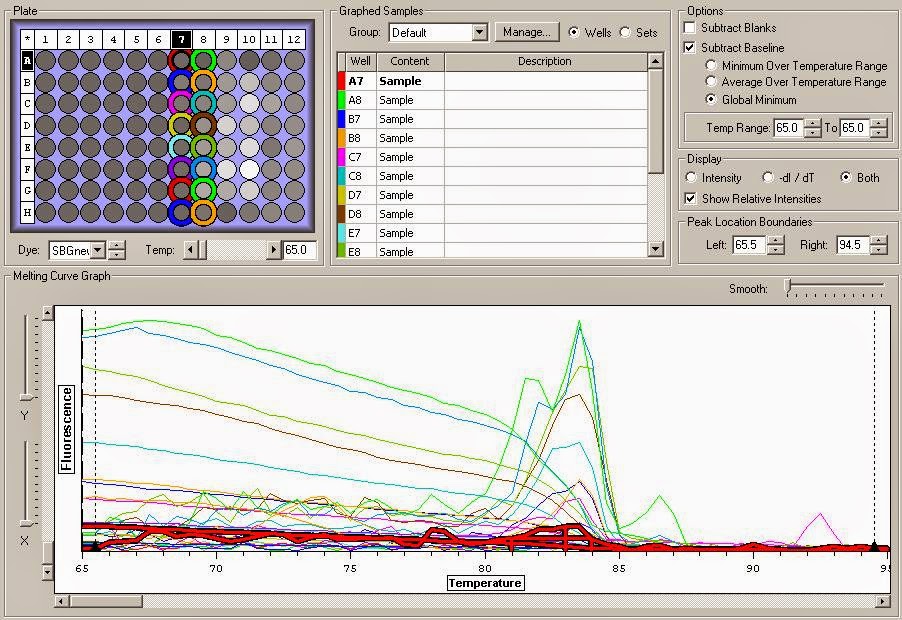
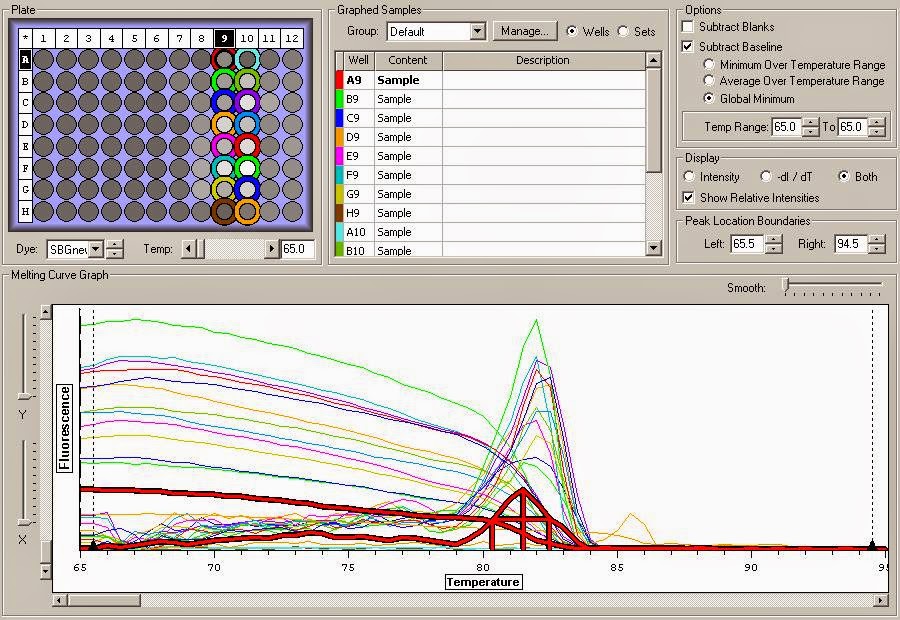
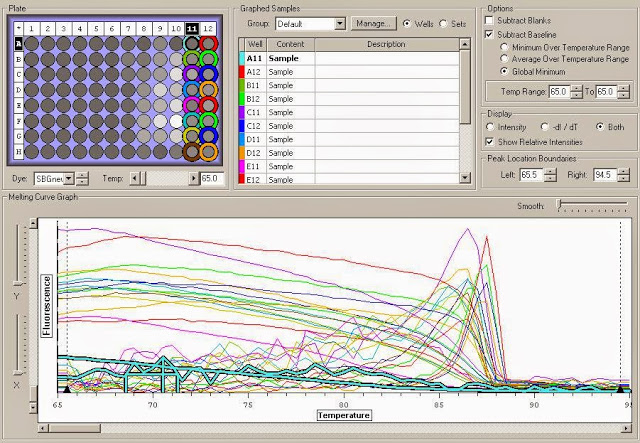
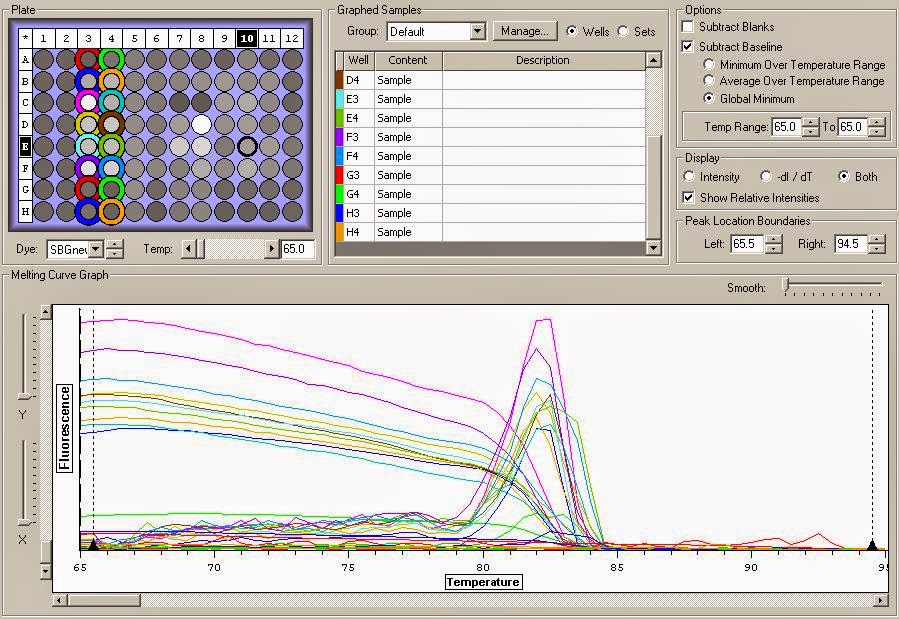
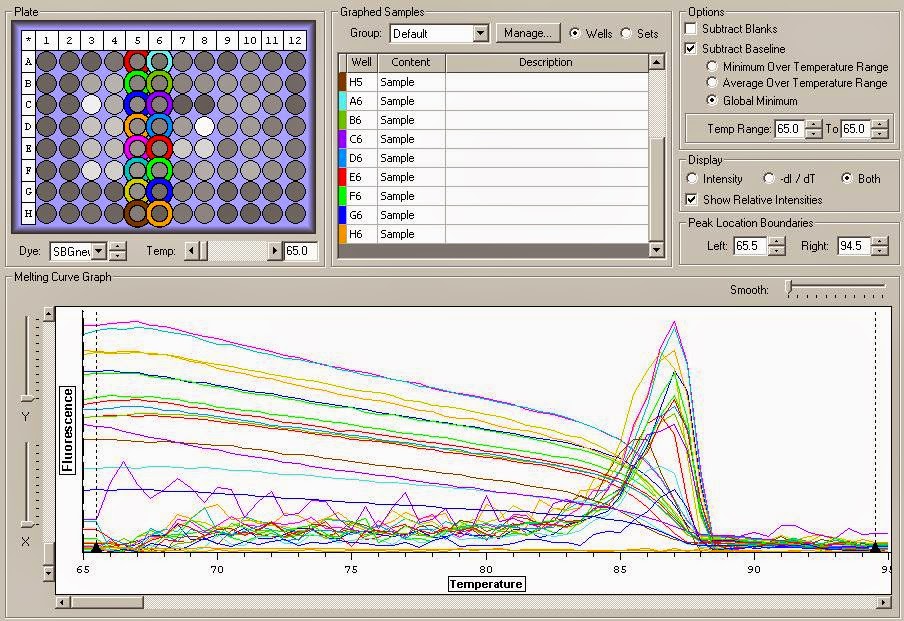
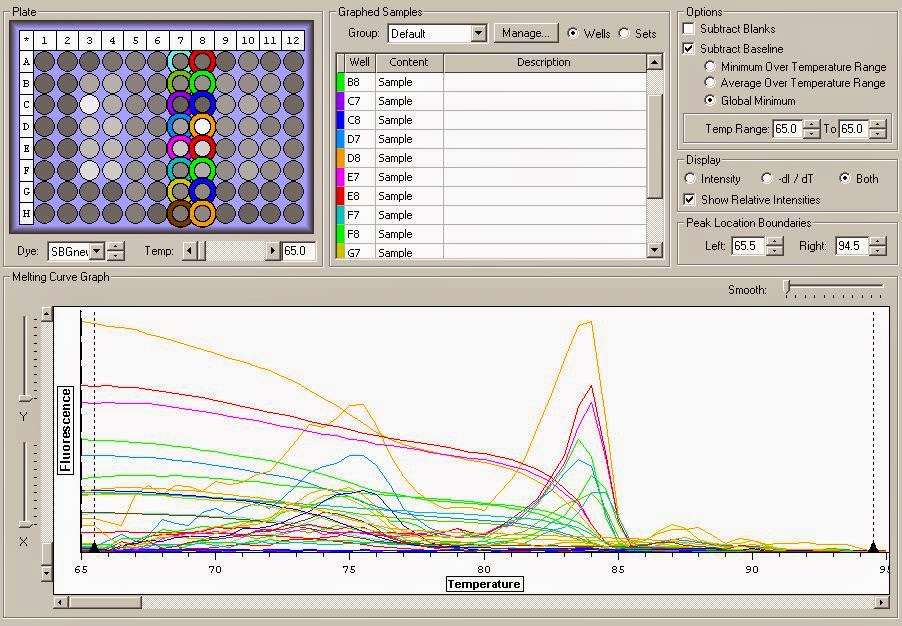
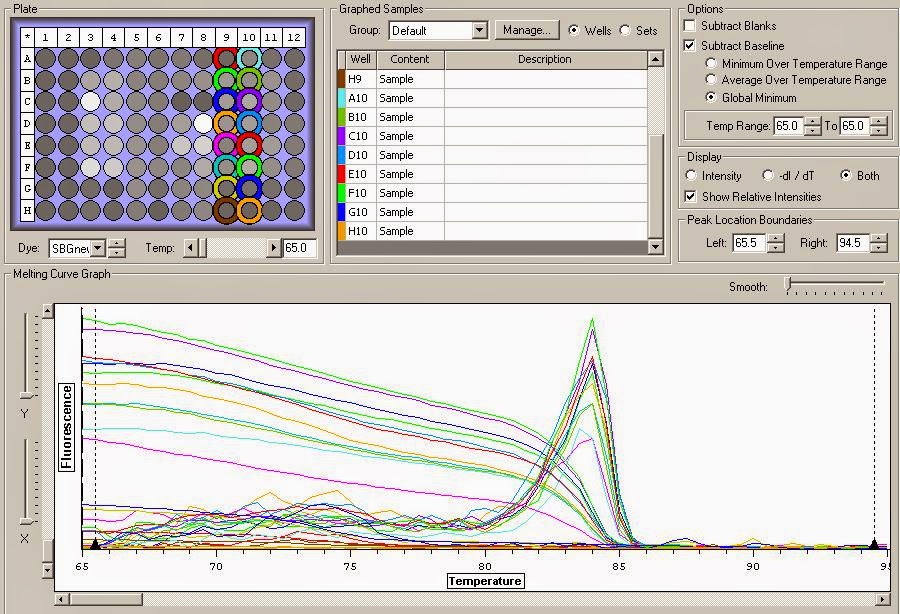
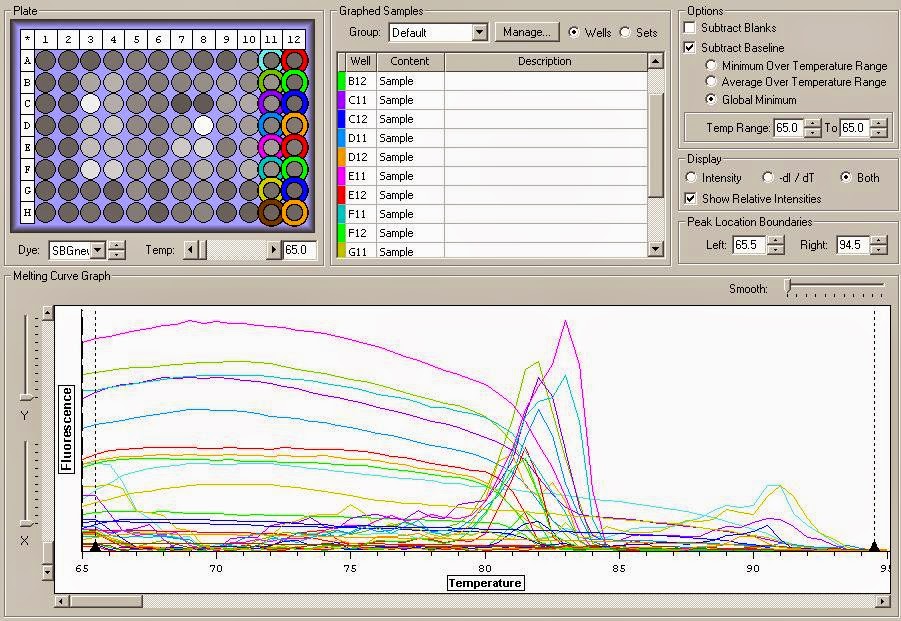
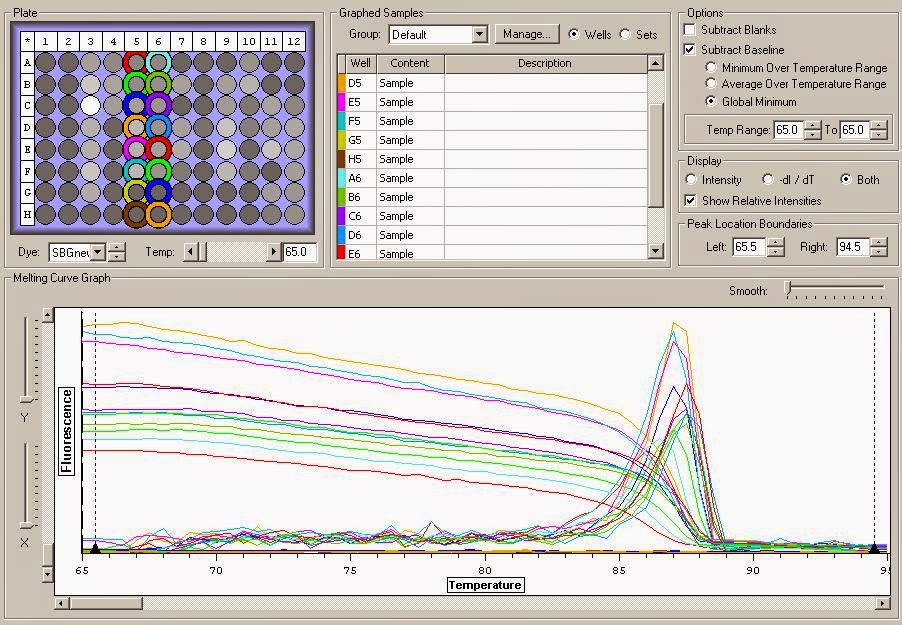
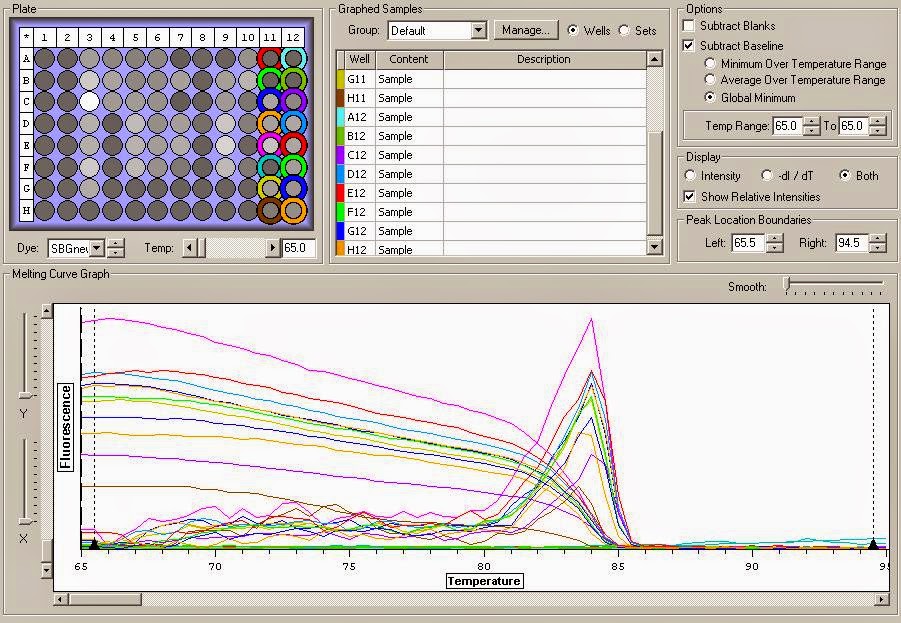
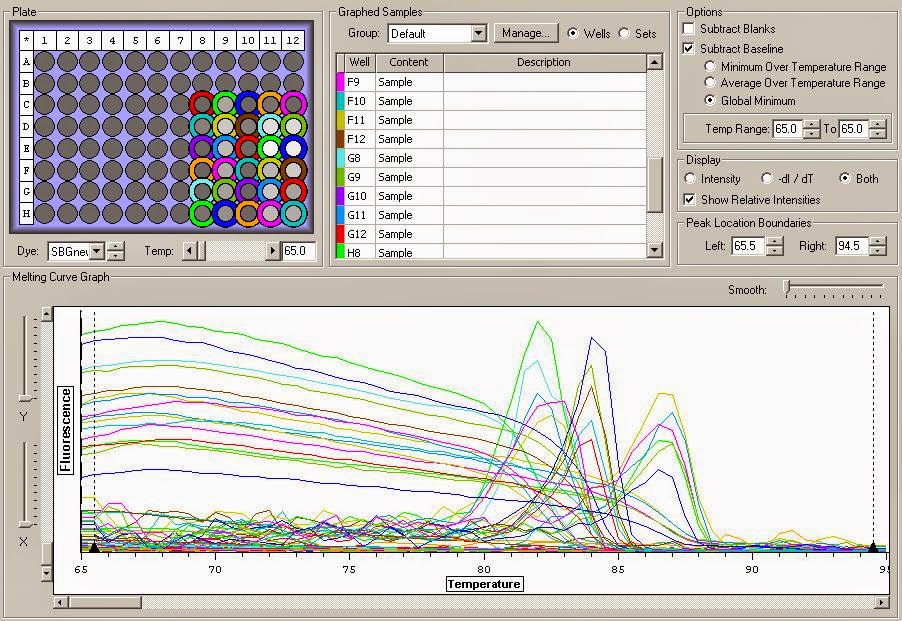
Melt Curves:
The 3 melt curve peaks correlate with HSP70, Actin, and Glutamine synthetase primers working with the cDNA. The Superoxide dismutase and the citrate synthase primers did not work for the cDNA.
You can see the raw qPCR data
here.
Moving forward, the 310 students will be running their samples using the primers today and tomorrow. I'll update the notebook with their data and some graphs to hopefully produce some interesting info about stress resilience mechanisms in the olys.