Primer:
| 1505 | Ol_Act_F | GACCAGCCAAATCCAGACGA | BC | 6/13/2012 | 20 | 55 | 60 | O.lurida | Actin, adductor muscle |
| 1504 | Ol_Act_R | CGGTCGTACCACTGGTATCG | 6/13/2012 | 20 | 60 | 60 | O.lurida | Actin, adductor muscle |
Reagent Table:
| Volume | Reactions X52 | |
| Ssofast Evagreen MM | 10 | 520 |
| FWD Primer | 0.5 | 26 |
| REV Primer | 0.5 | 26 |
| Nuclease Free H2O | 8 | 416 |
| gDNA | 1 | 52 |
The sample I used was from Oly seed oyster isolations I did a while back.
Sample Info:
| Sample ID | Date | Time | ng/ul |
| NF20 | 5/7/2015 | 11:17 AM | 876.31 |
To make the master mix I added all the reagents together from greatest volume to least volume and then added the gDNA template. I vortexed briefly to ensure homogeneous mixture. I then pipetted 20 ul of this mixture into every other well to make a checker board pattern on the plate.
Plate Layout:
| 1 | 2 | 3 | 4 | 5 | 6 | 7 | 8 | 9 | 10 | 11 | 12 |
| Sample | Sample | Sample | Sample | Sample | Sample | ||||||
| Sample | Sample | Sample | Sample | Sample | Sample | ||||||
| Sample | Sample | Sample | Sample | Sample | Sample | ||||||
| Sample | Sample | Sample | Sample | Sample | Sample | ||||||
| Sample | Sample | Sample | Sample | Sample | Sample | ||||||
| Sample | Sample | Sample | Sample | Sample | Sample | ||||||
| Sample | Sample | Sample | Sample | Sample | Sample | ||||||
| Sample | Sample | Sample | Sample | Sample | Sample |
This pattern was to test the machines fluorescence reading capabilities across the entire plate without having to fill every well with sample.
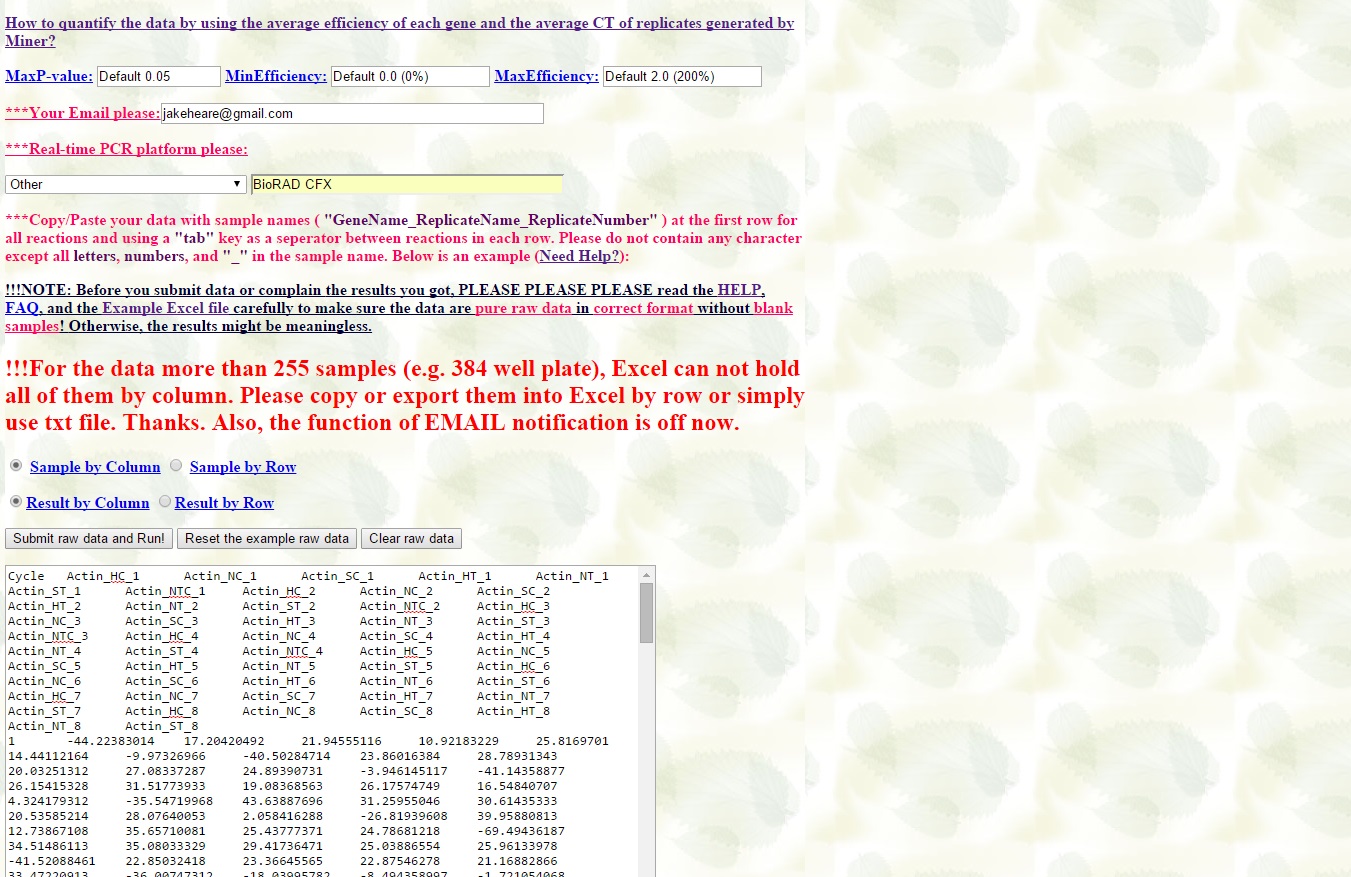
I ran the following program which is the same for all the other qPCR's that I have been running.
| Step | Temperature | Time |
| Initiation | 95 C | 10 min |
| Elongation | 95 C | 30 sec |
| 60 C | 1 min | |
| Read | ||
| 72 C | 30 sec | |
| Read | ||
| Repeat Elongation 39 times | ||
| Termination | 95 C | 1 min |
| 55 C | 1 sec | |
| Melt Curve Manual ramp 0.2C per sec Read 0.5 C | 55 - 95 C | 30 sec |
| 21 C | 10 min | |
| End |
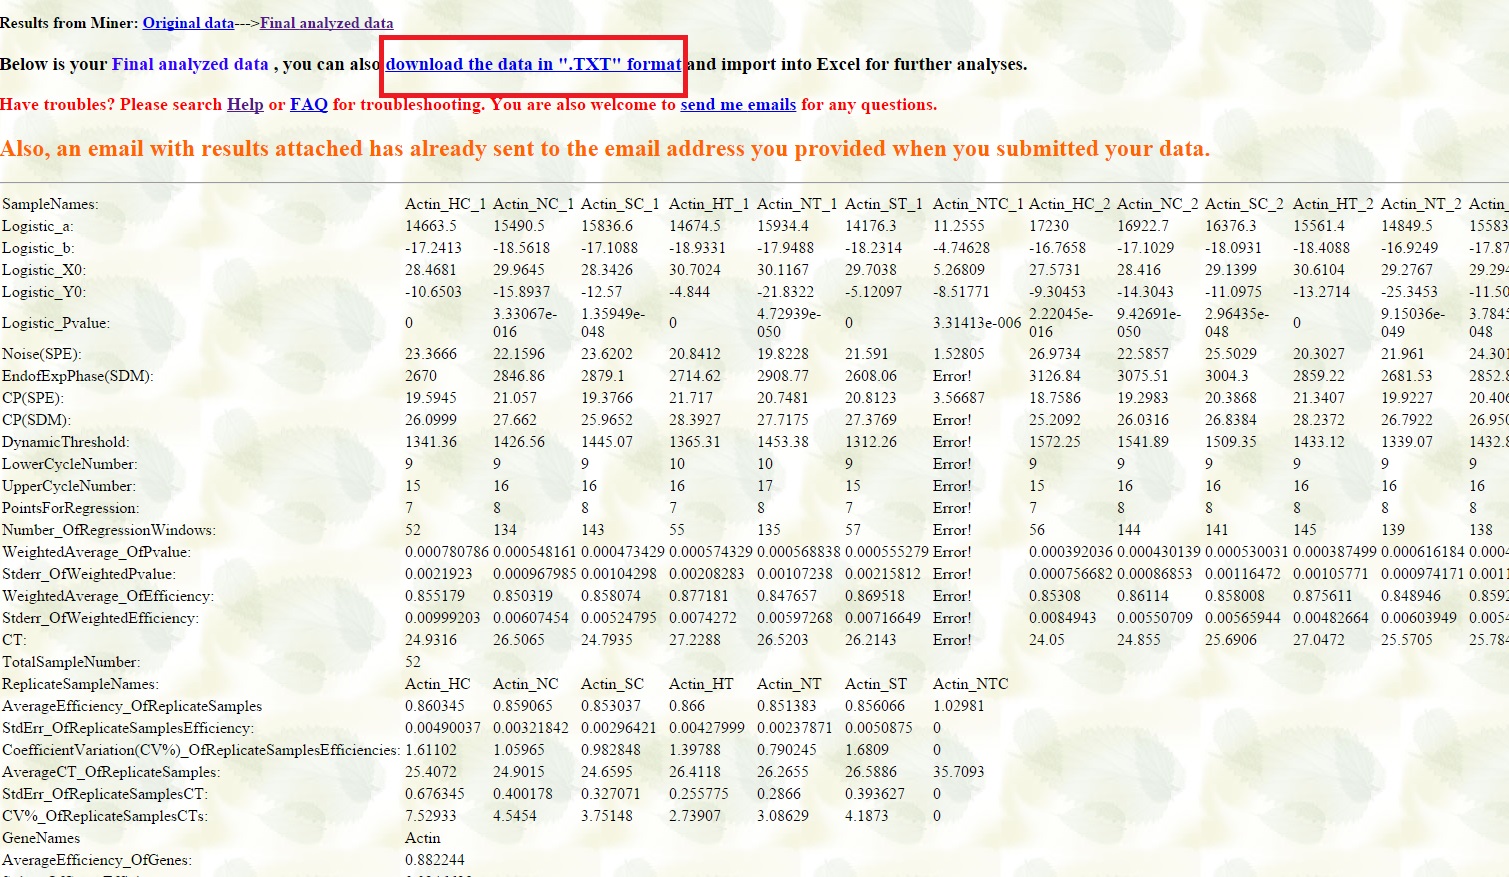
Results:
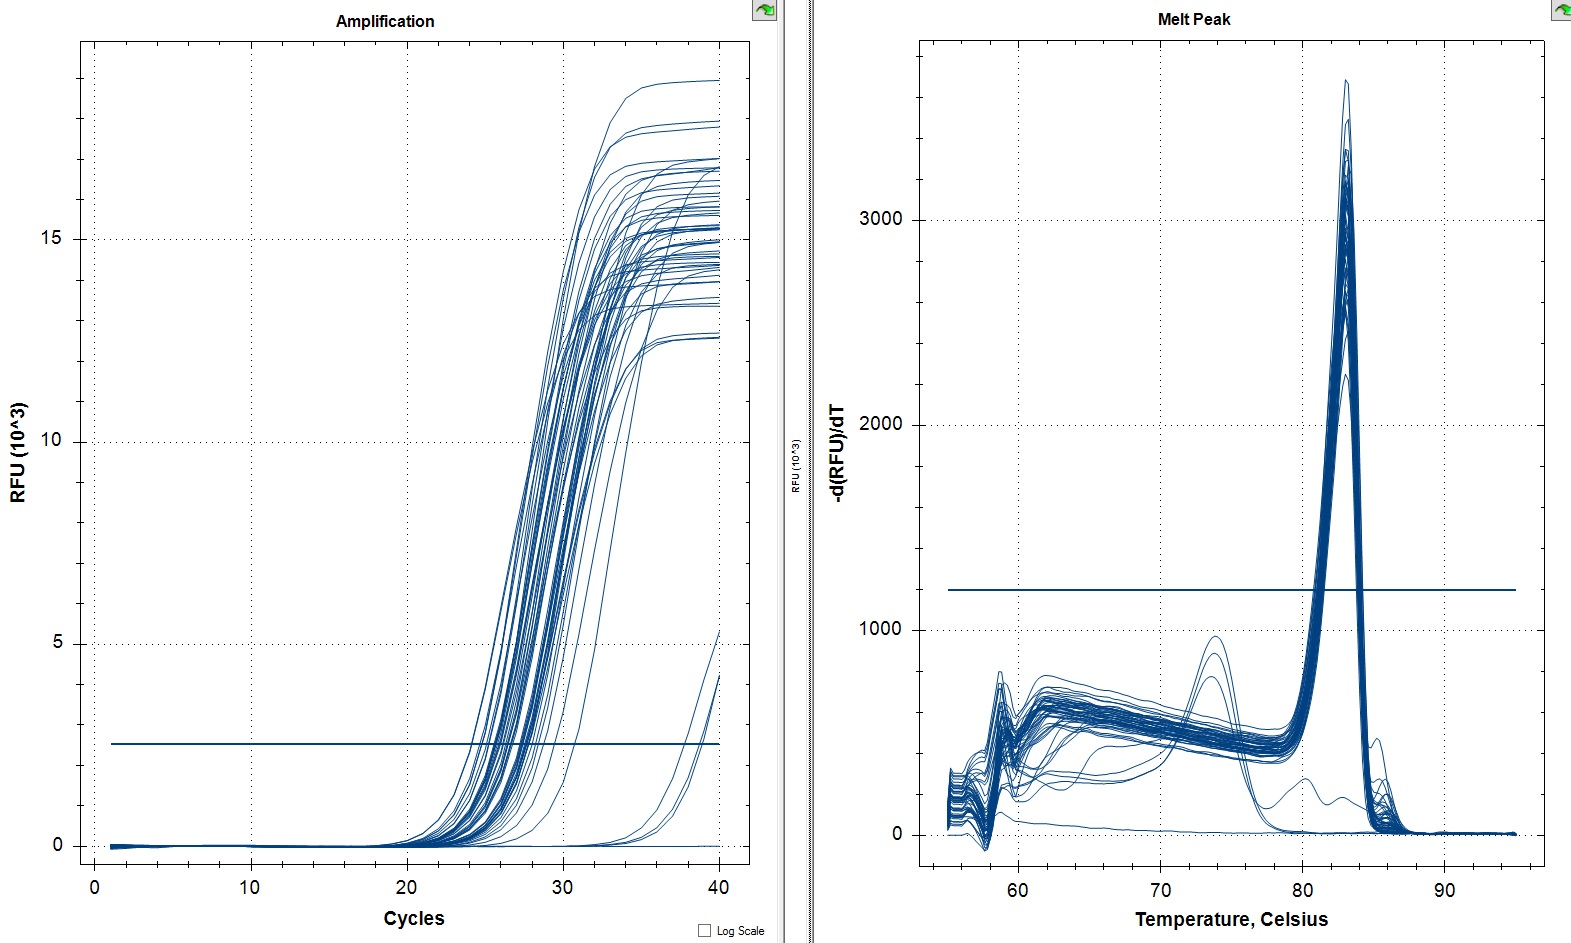
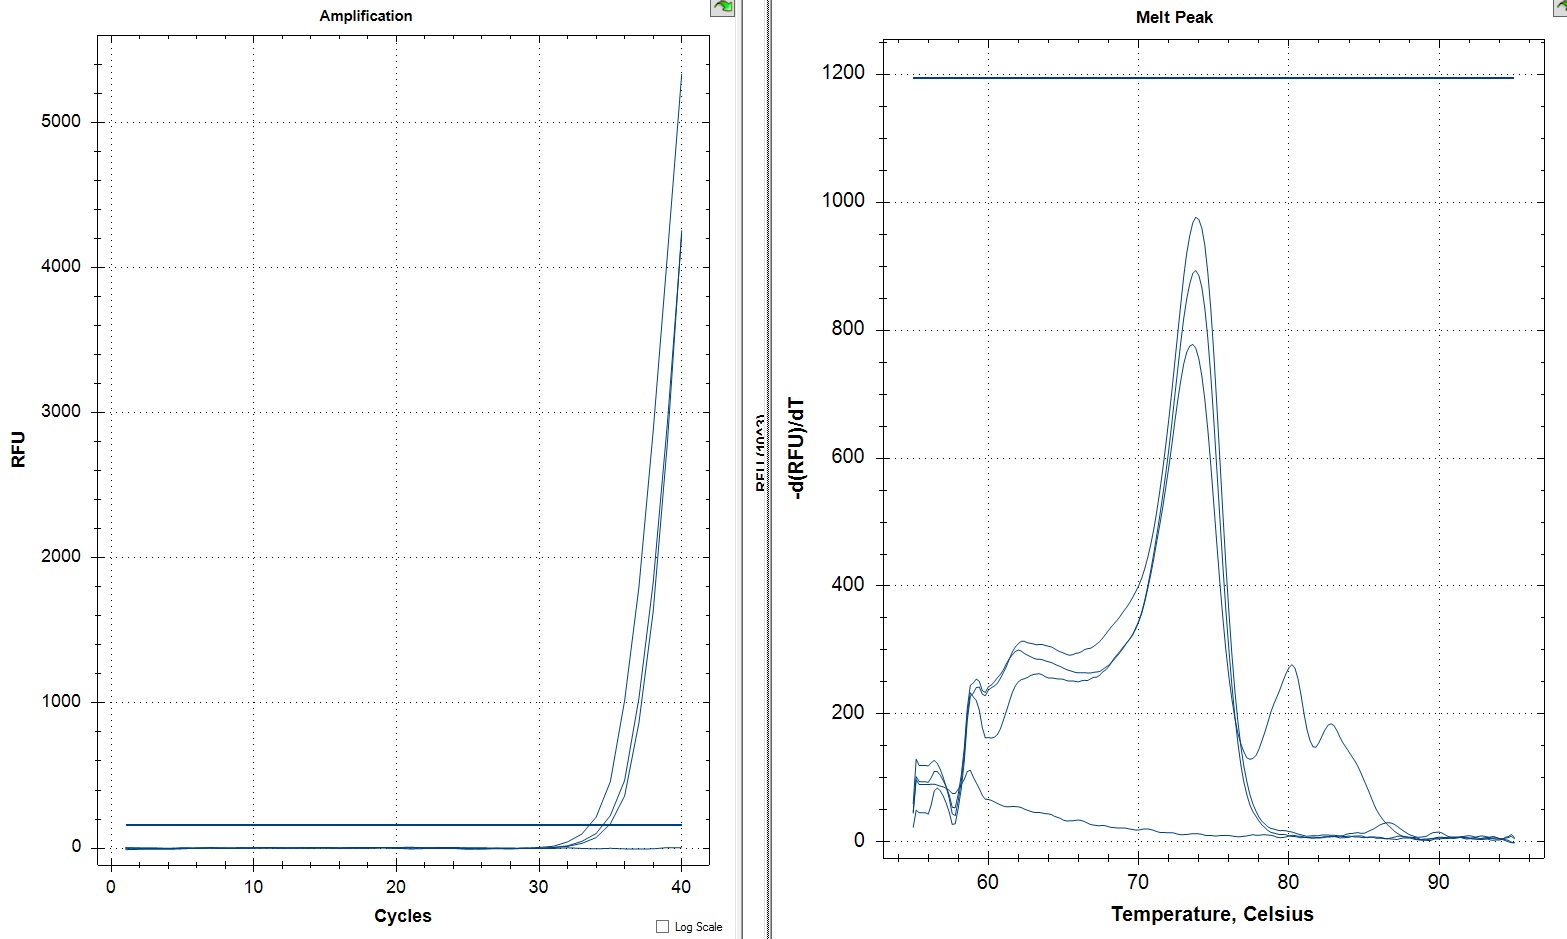
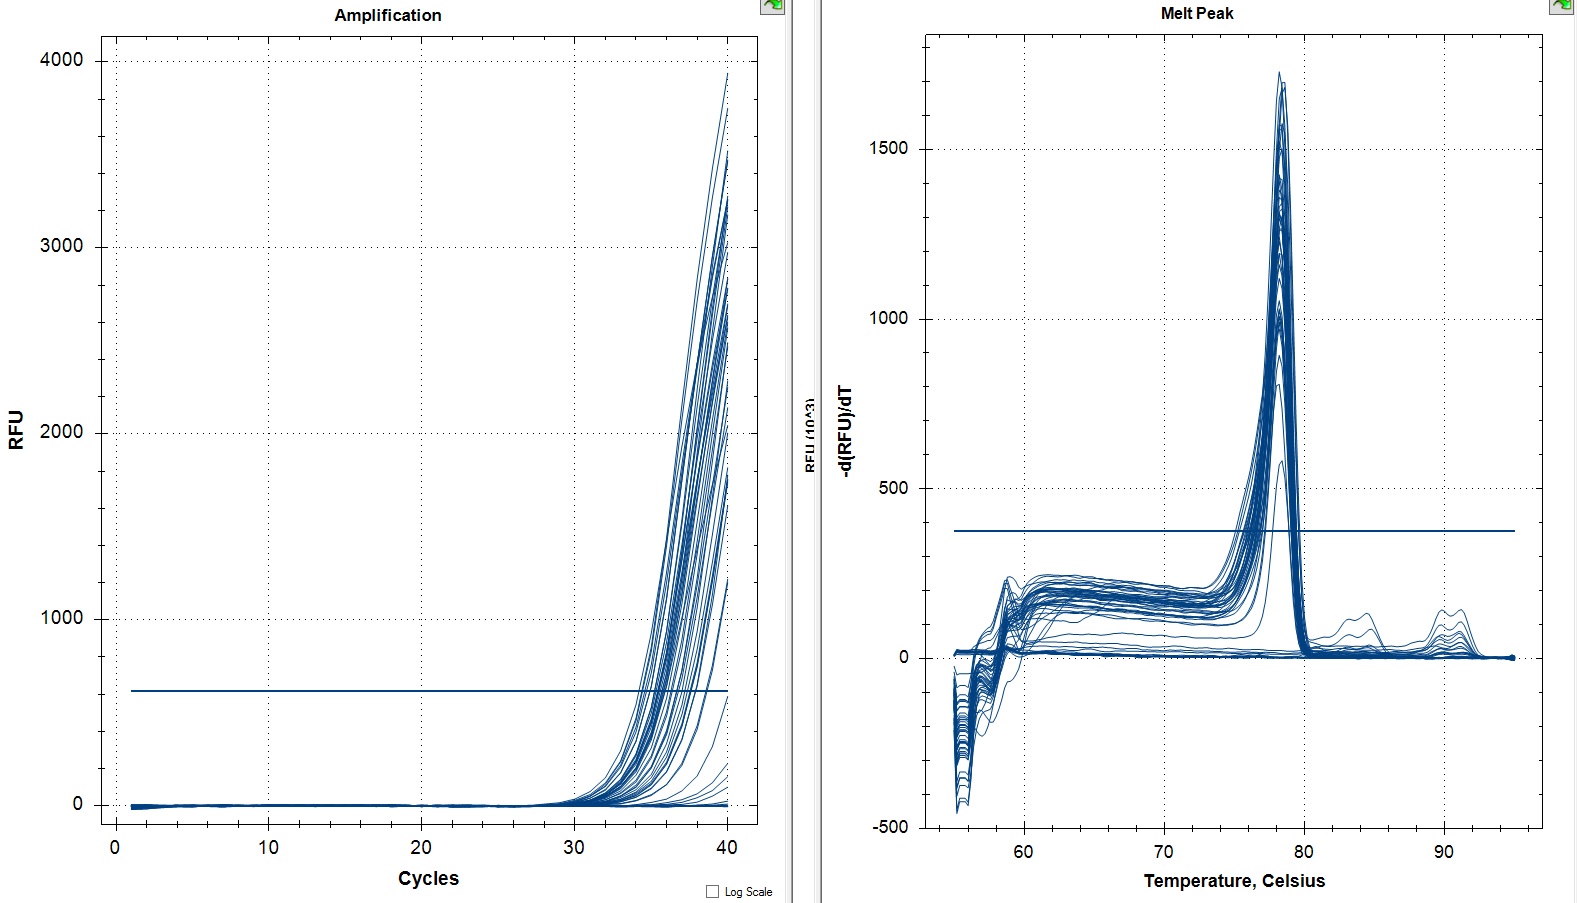
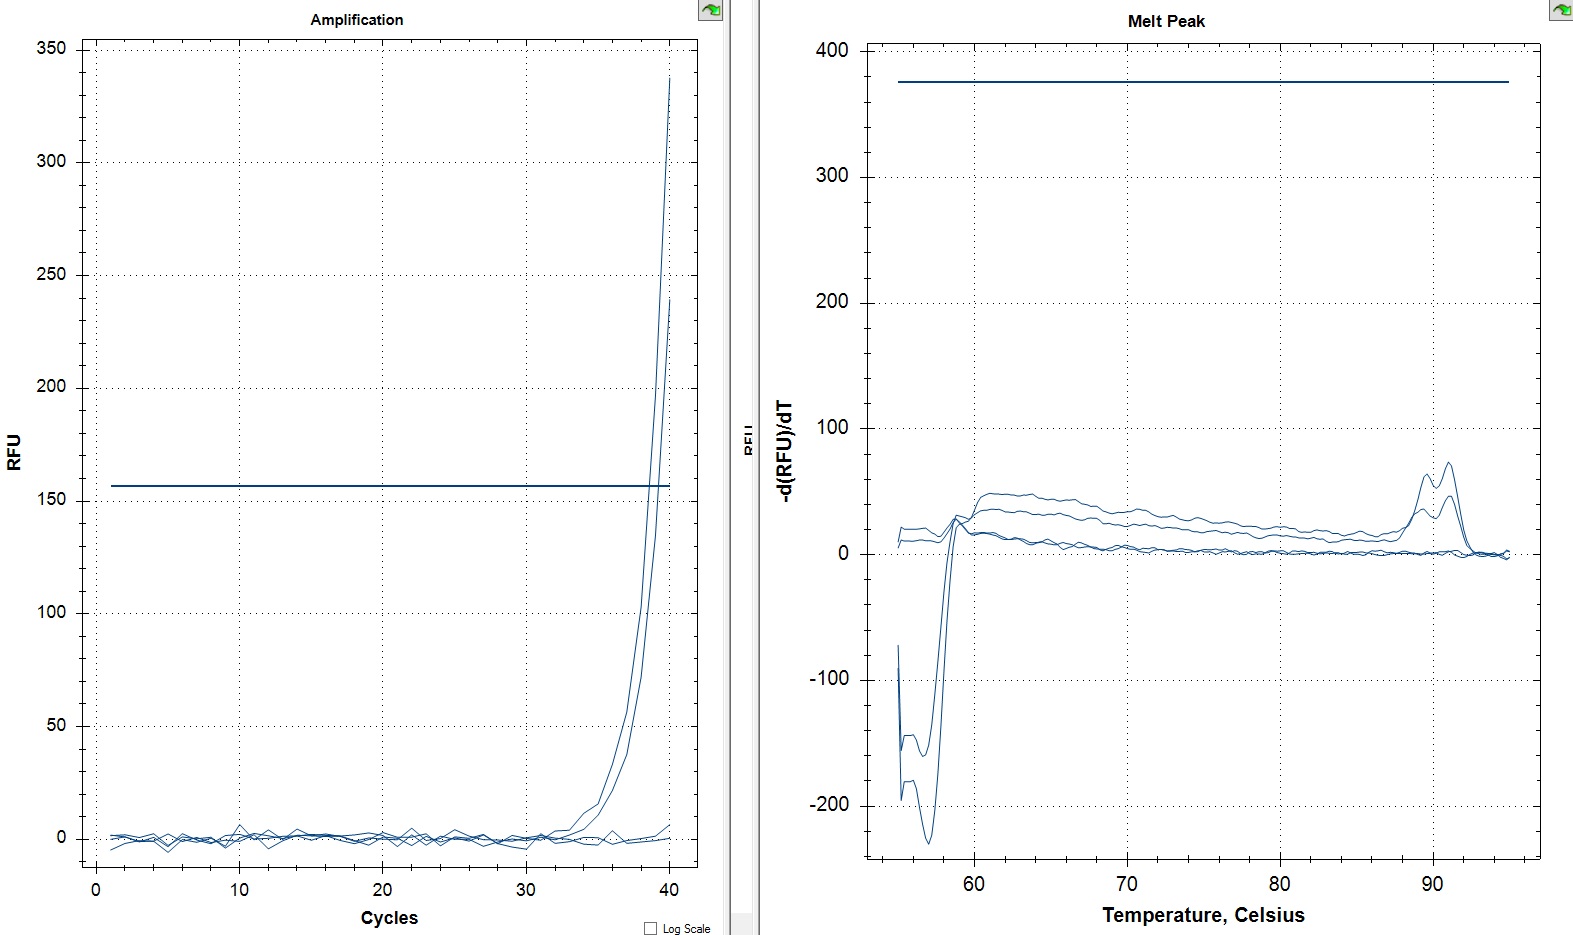
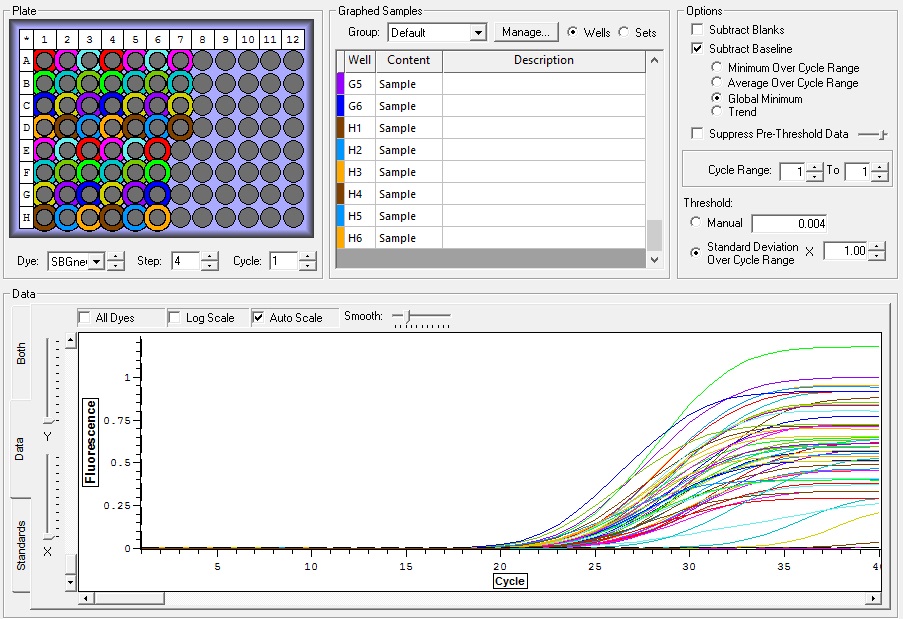
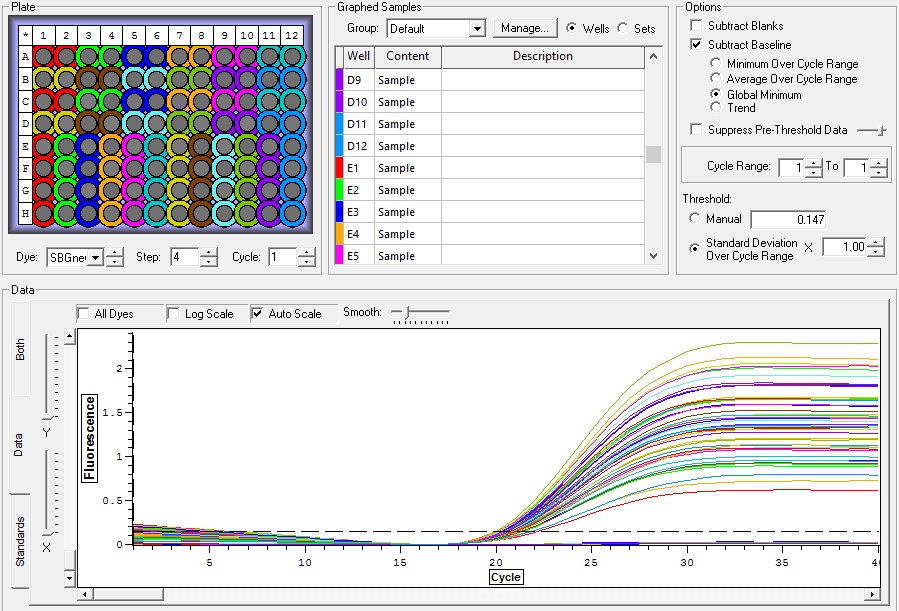
Amplification
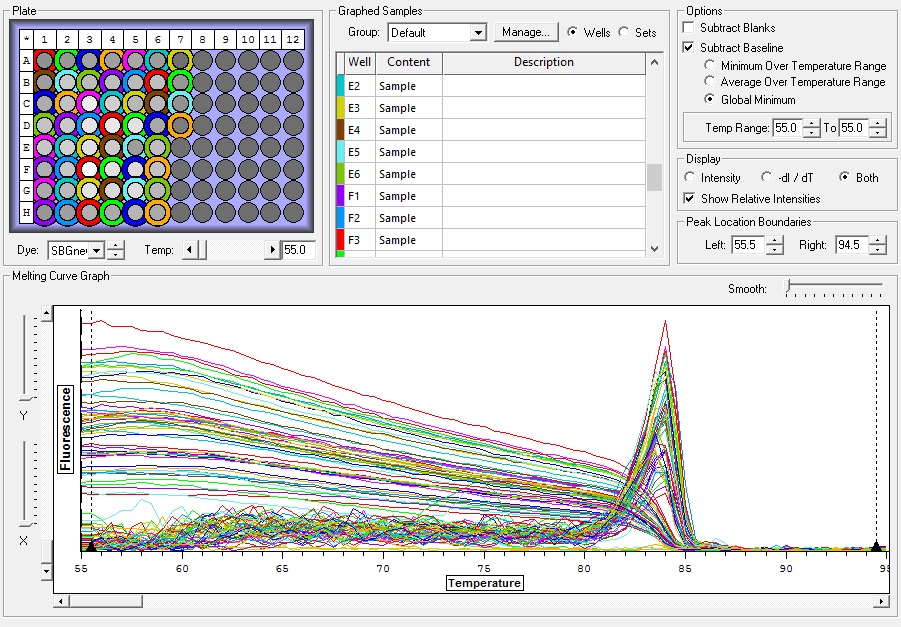
Melt Curve
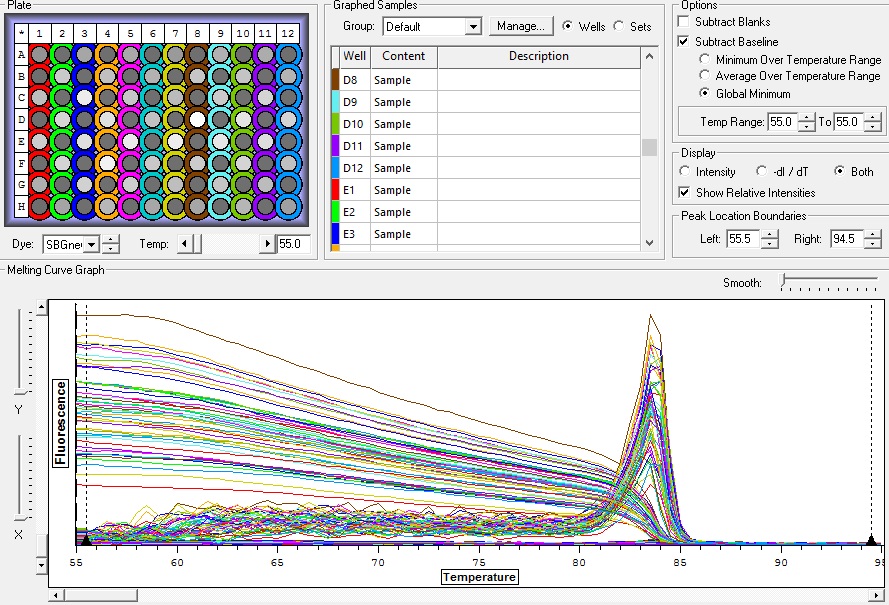

As you can see from the amplification, while all of the well should have had exactly the same amplification there was a significant difference between wells with some wells being orders of magnitude higher. The melt curve shows similar. My favorite image though is the plate fluorescence which shows a rough estimate of the fluorescence detected in each well by the machine. Clearly the center wells have higher fluorescence detection than wells along the edges of the plate. At this time it is apparent that we need to recalibrate the Opticon as it clearly is not producing valid data.