Manchester WA
Cloudy, High 50's/Low 60's
Participants: Sean Bennett and Jake Heare
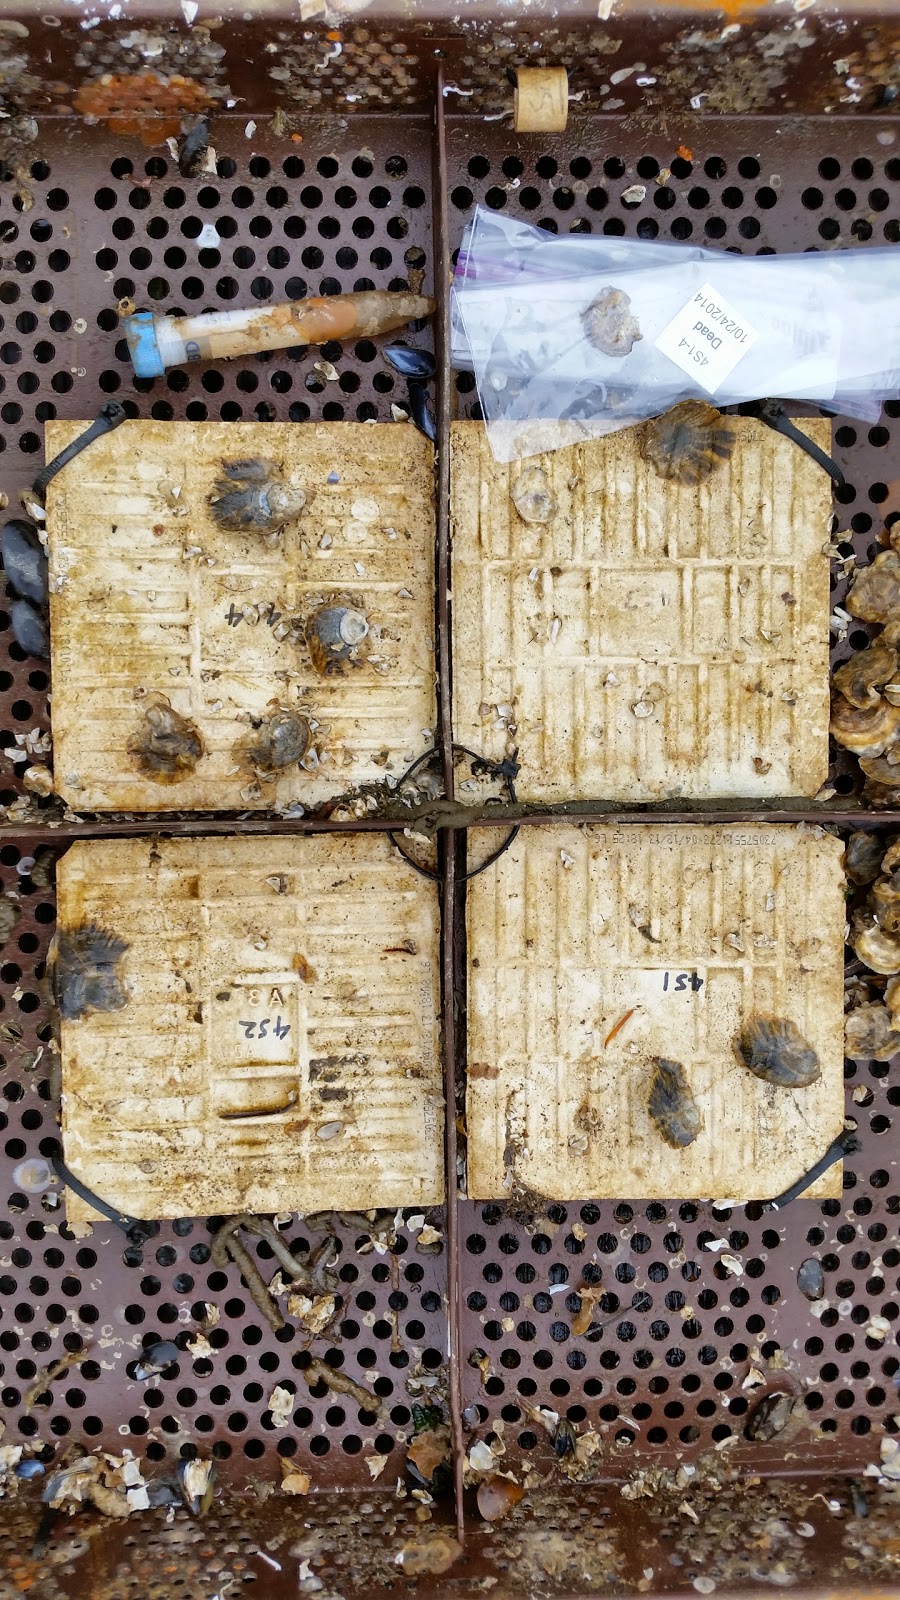
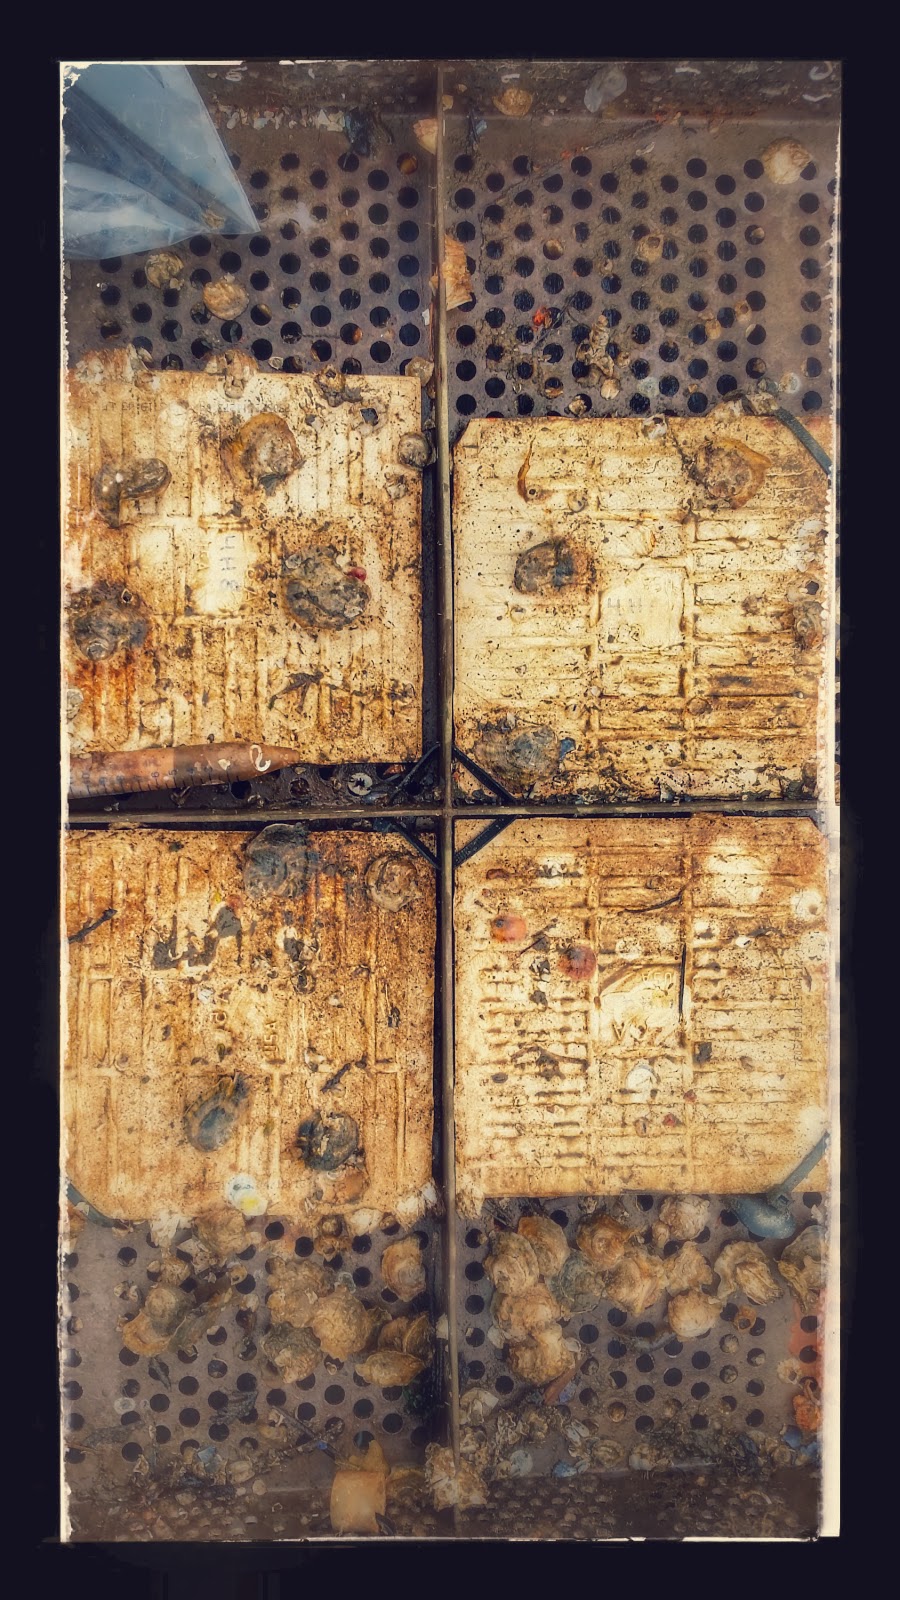
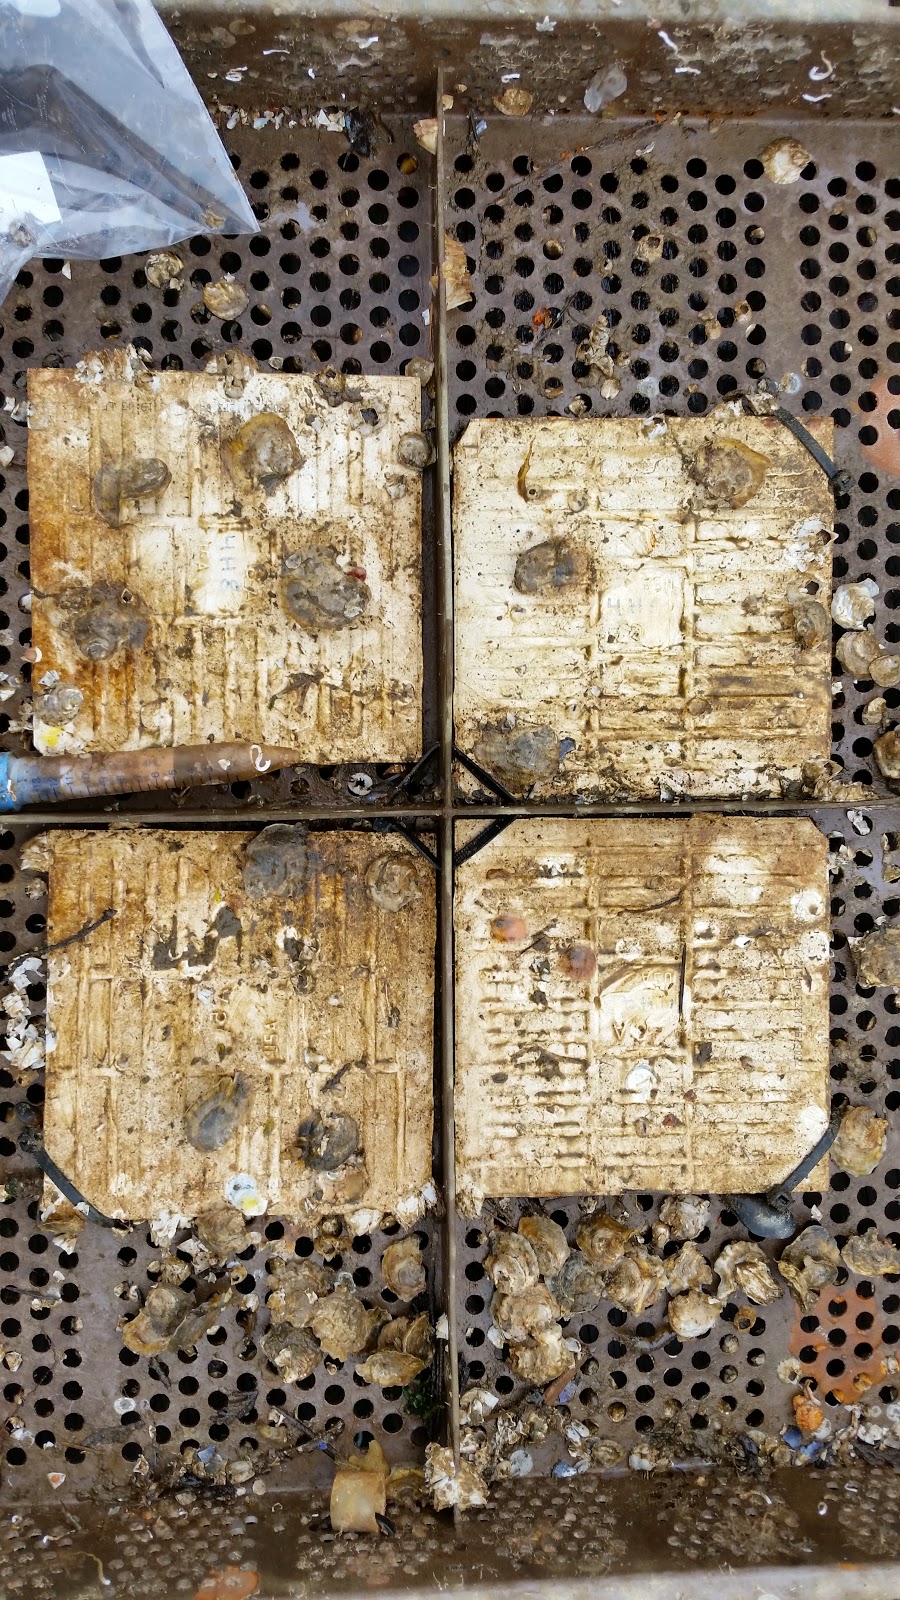
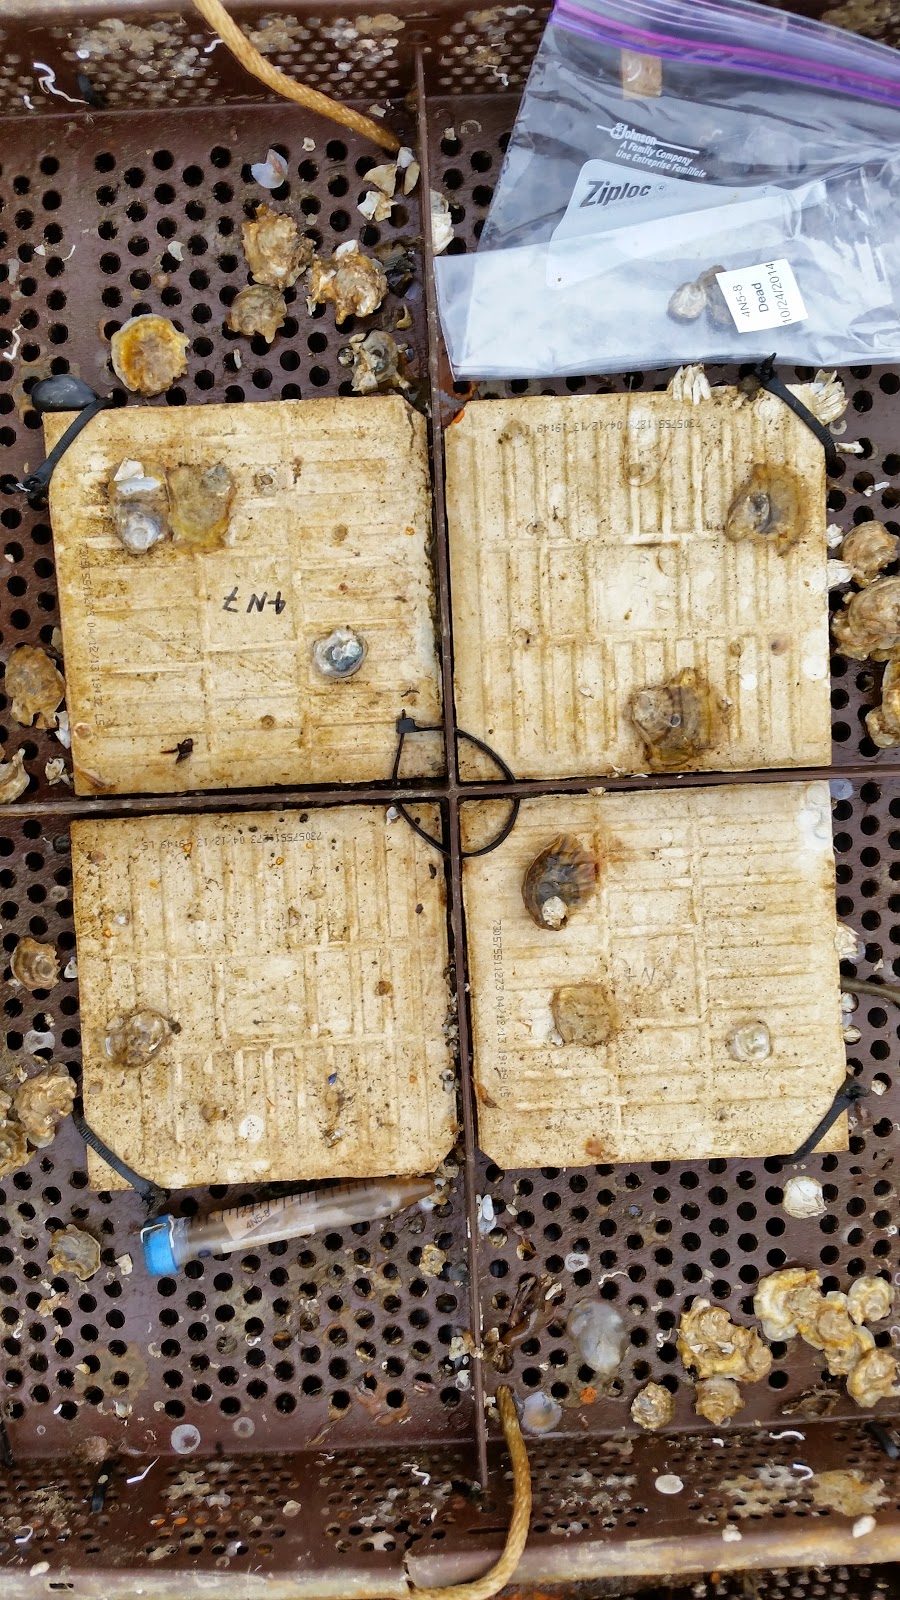
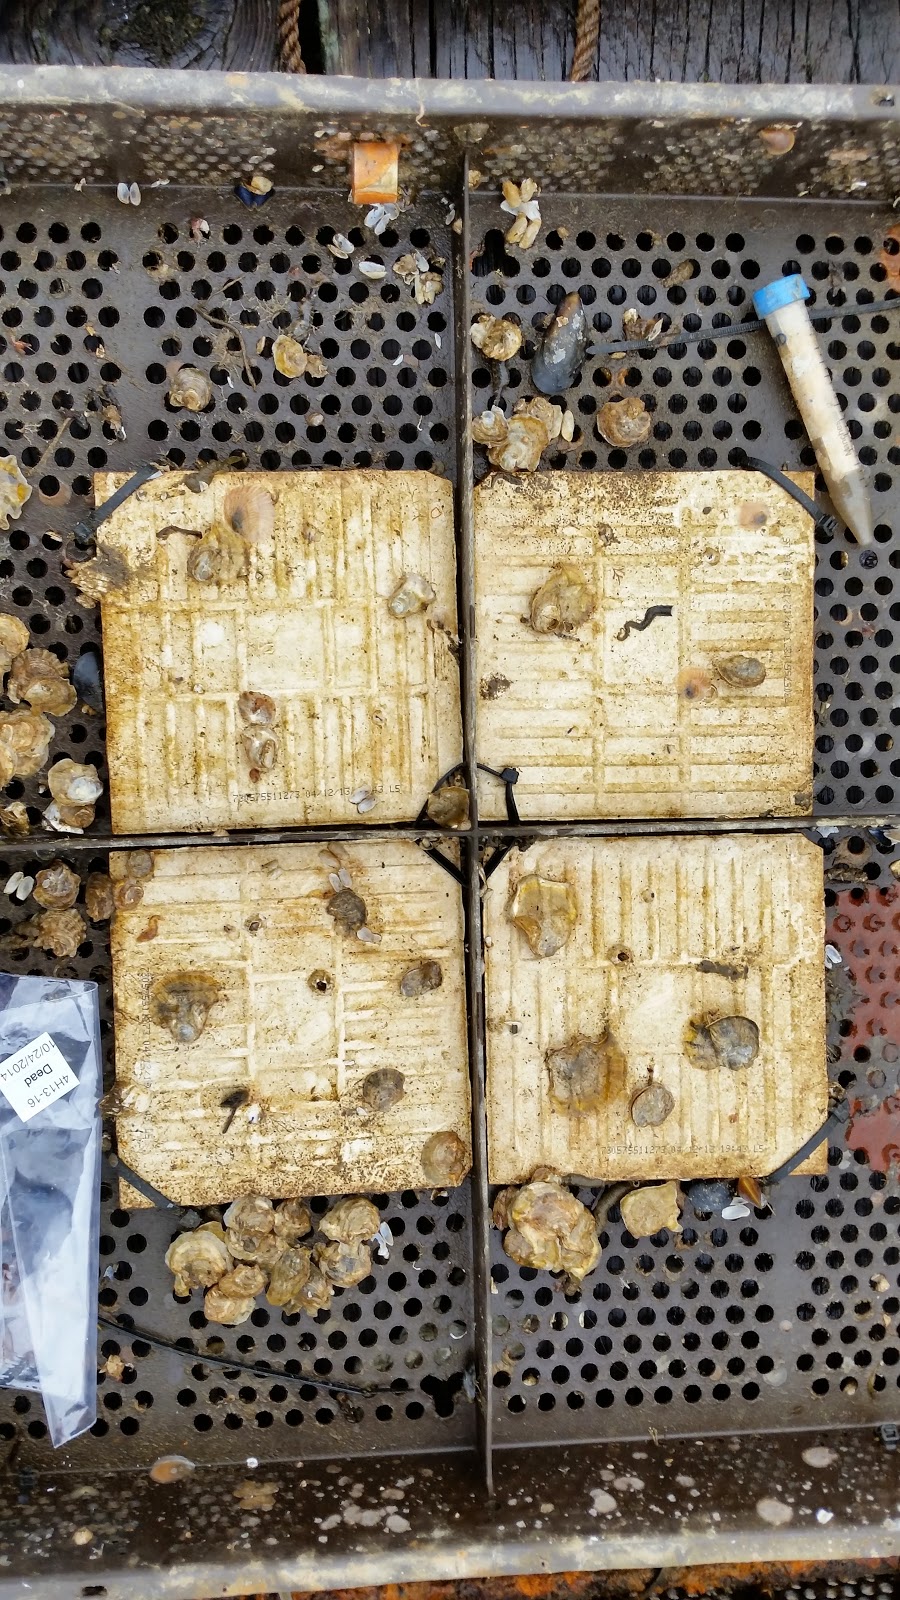
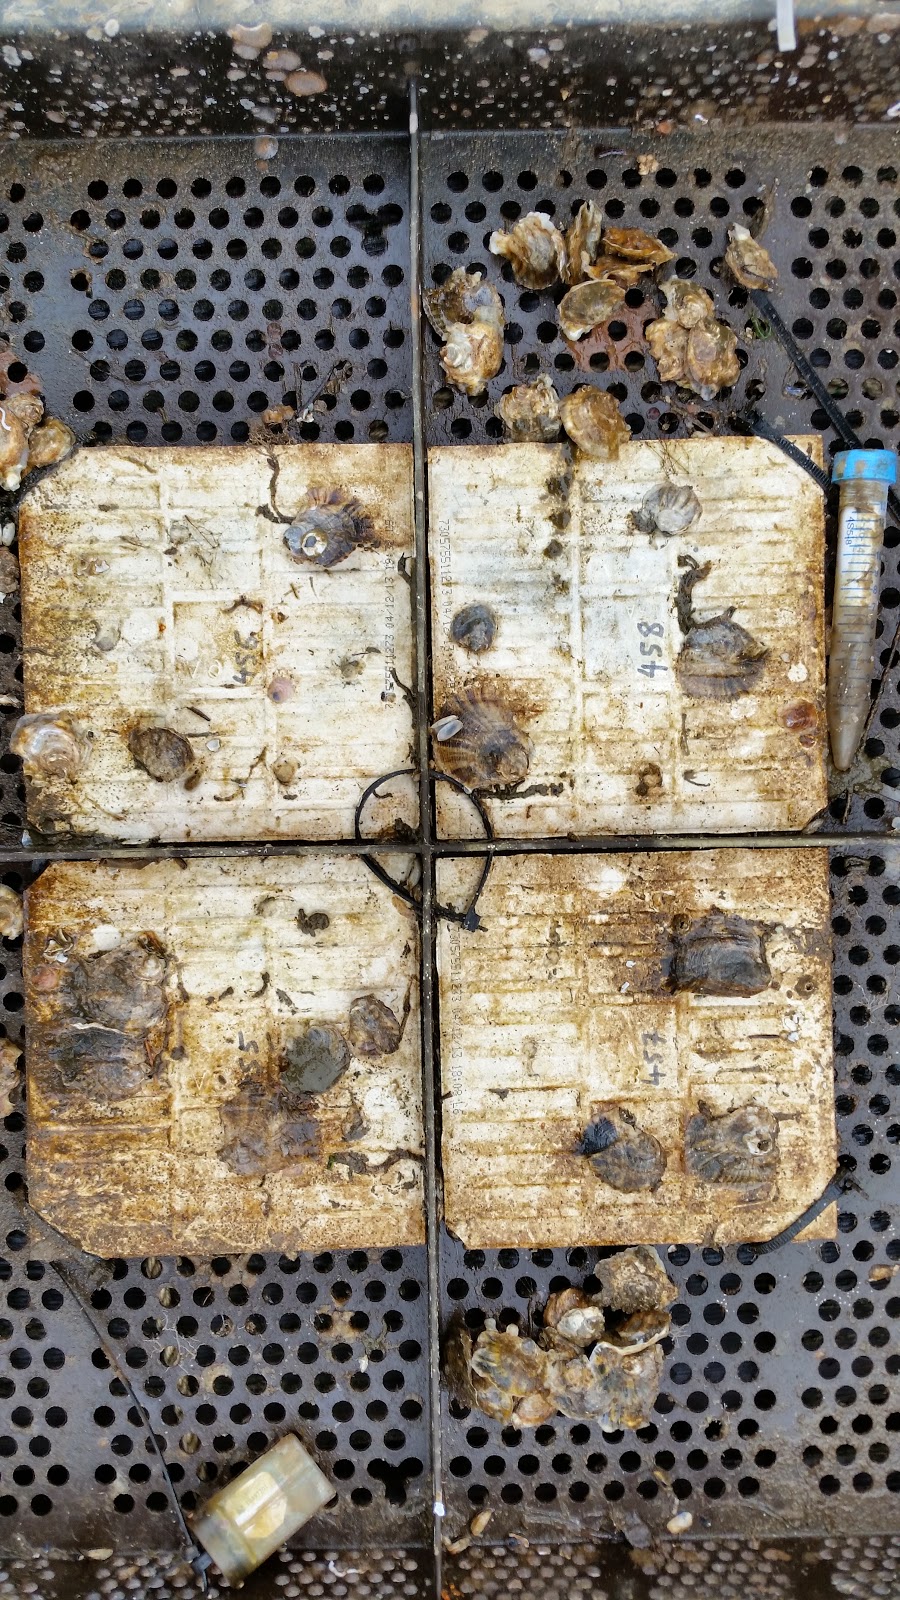
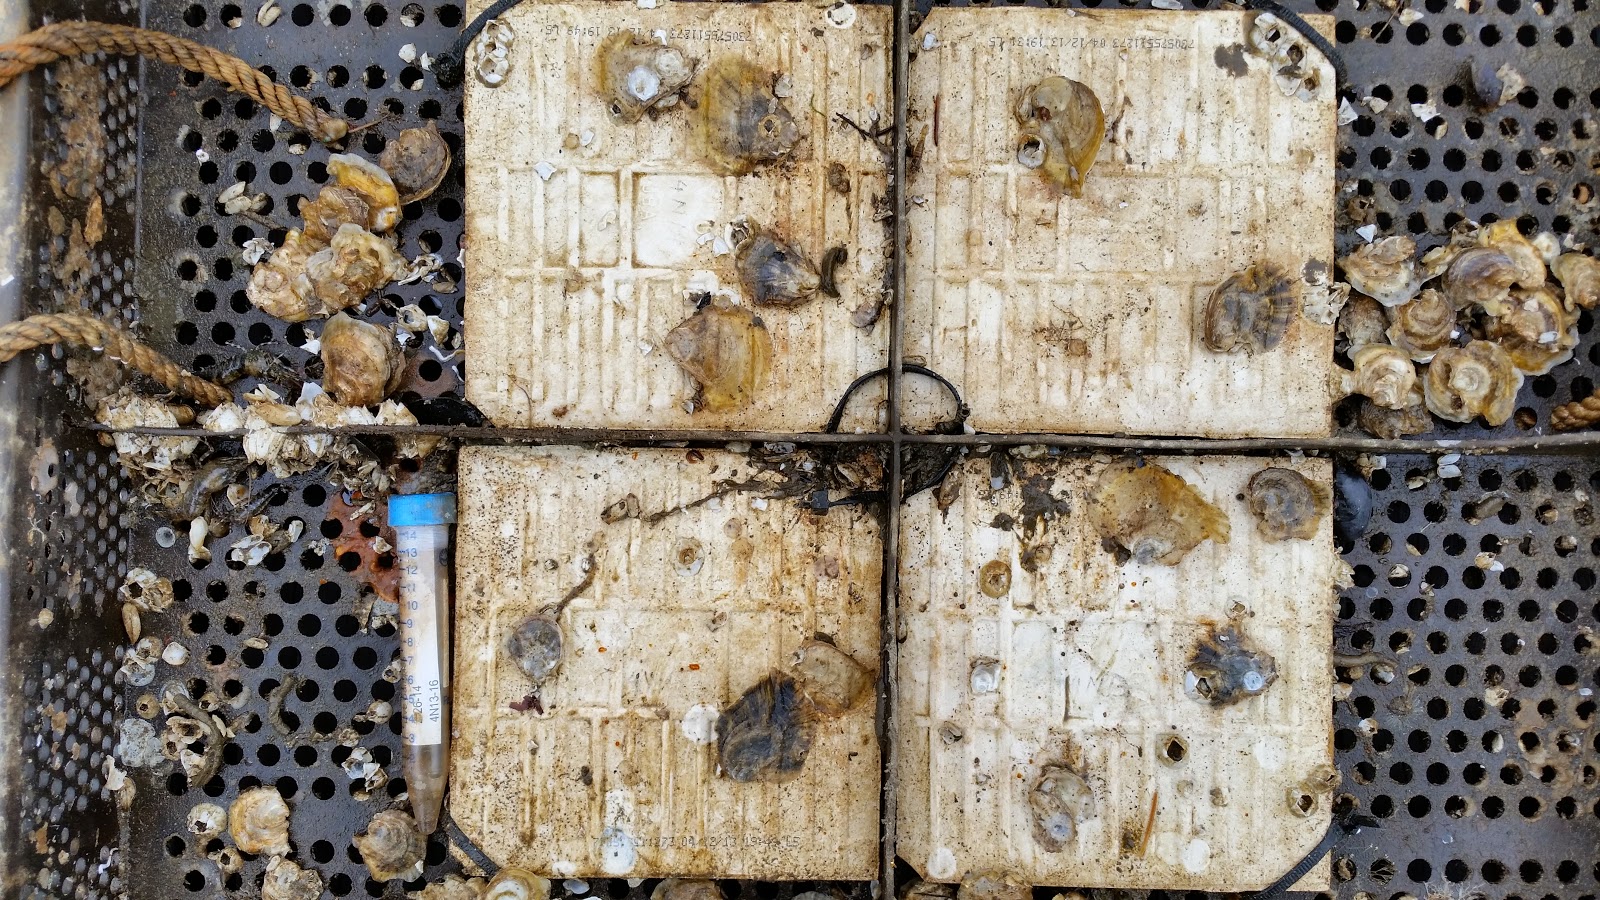
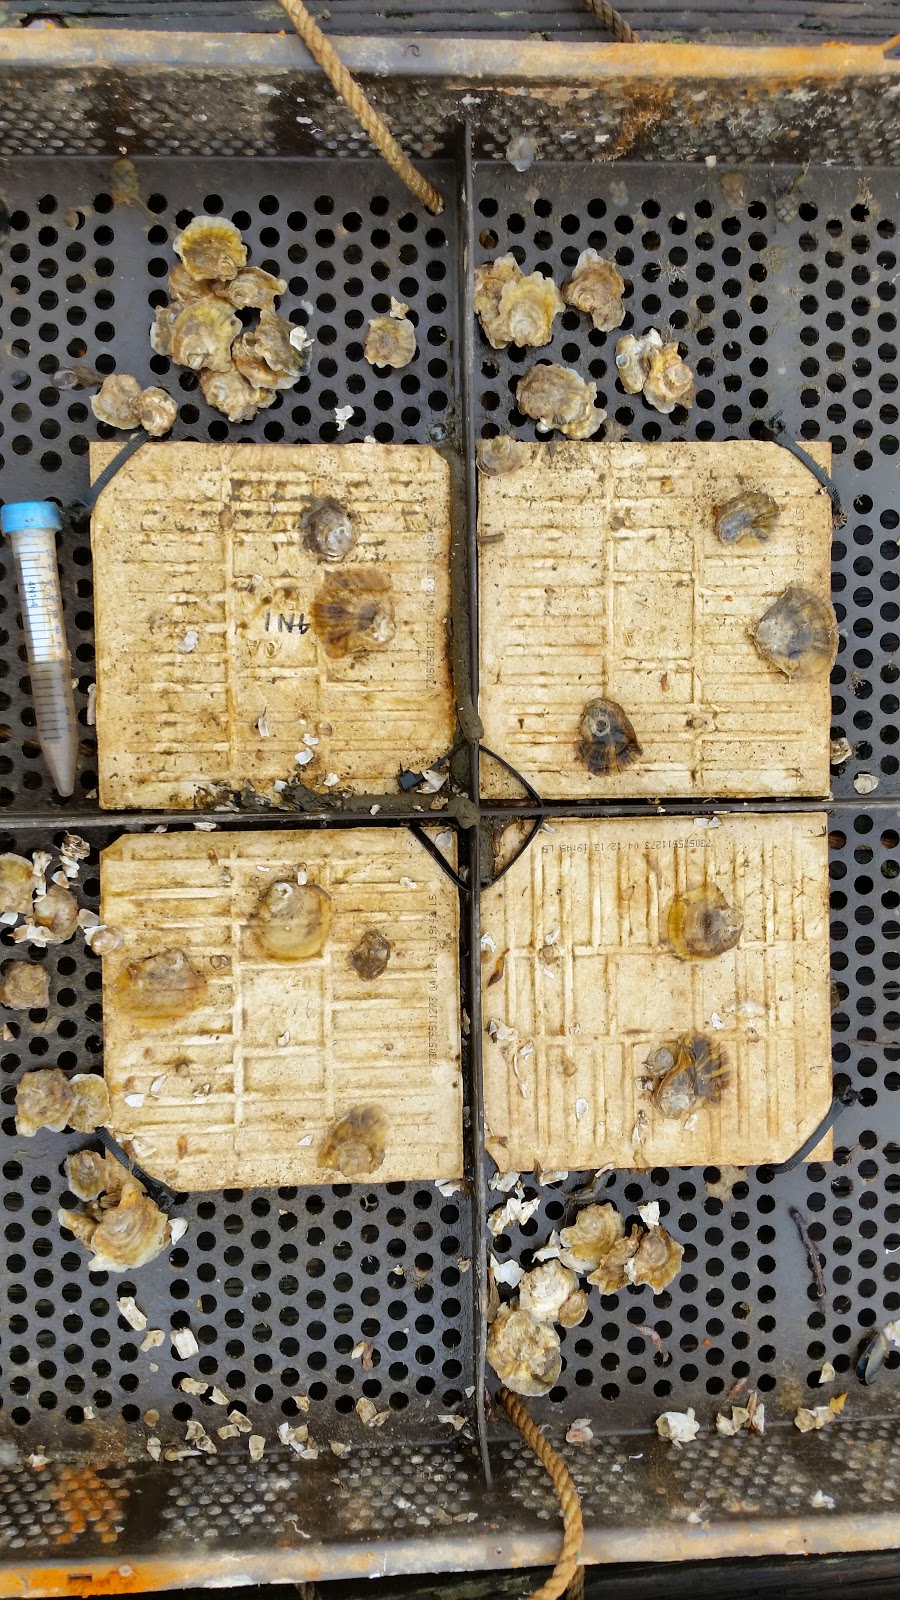
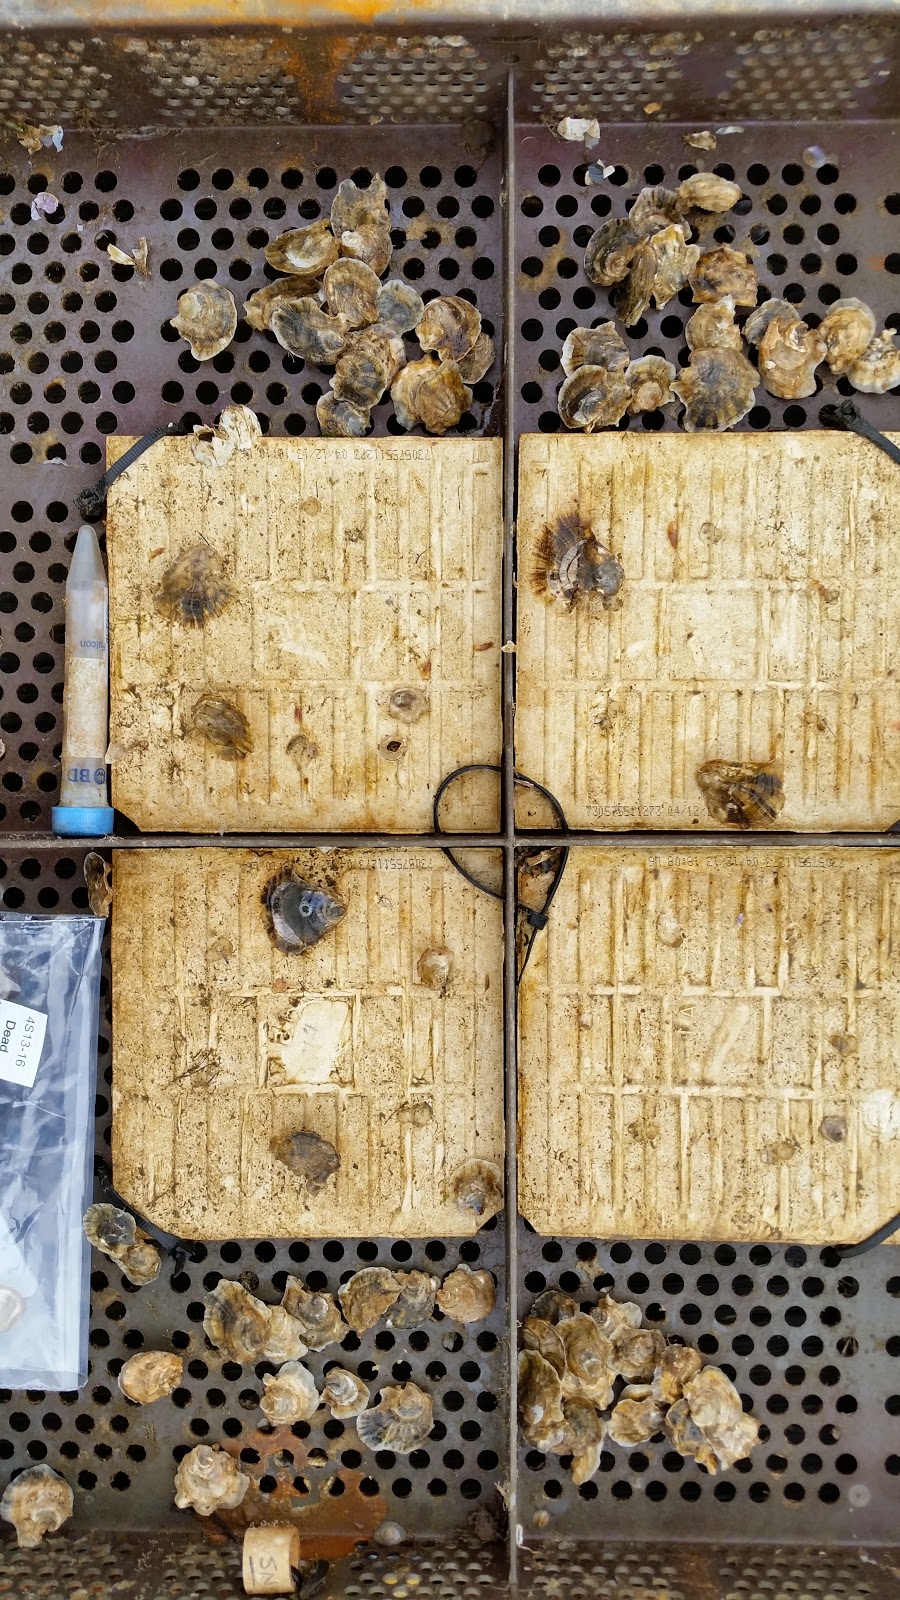
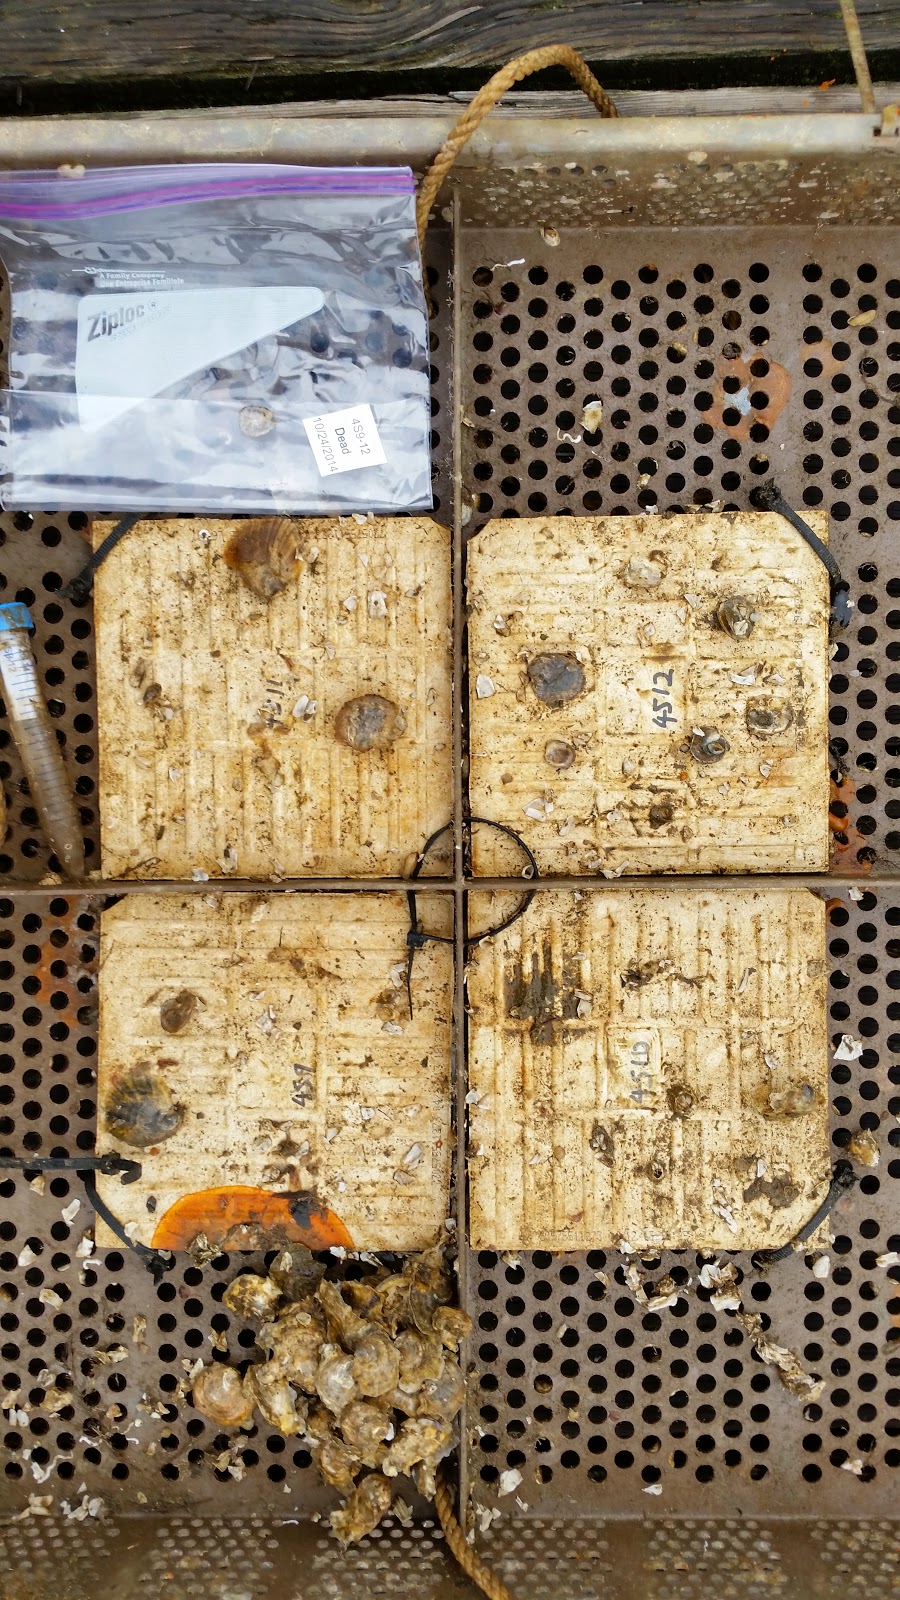
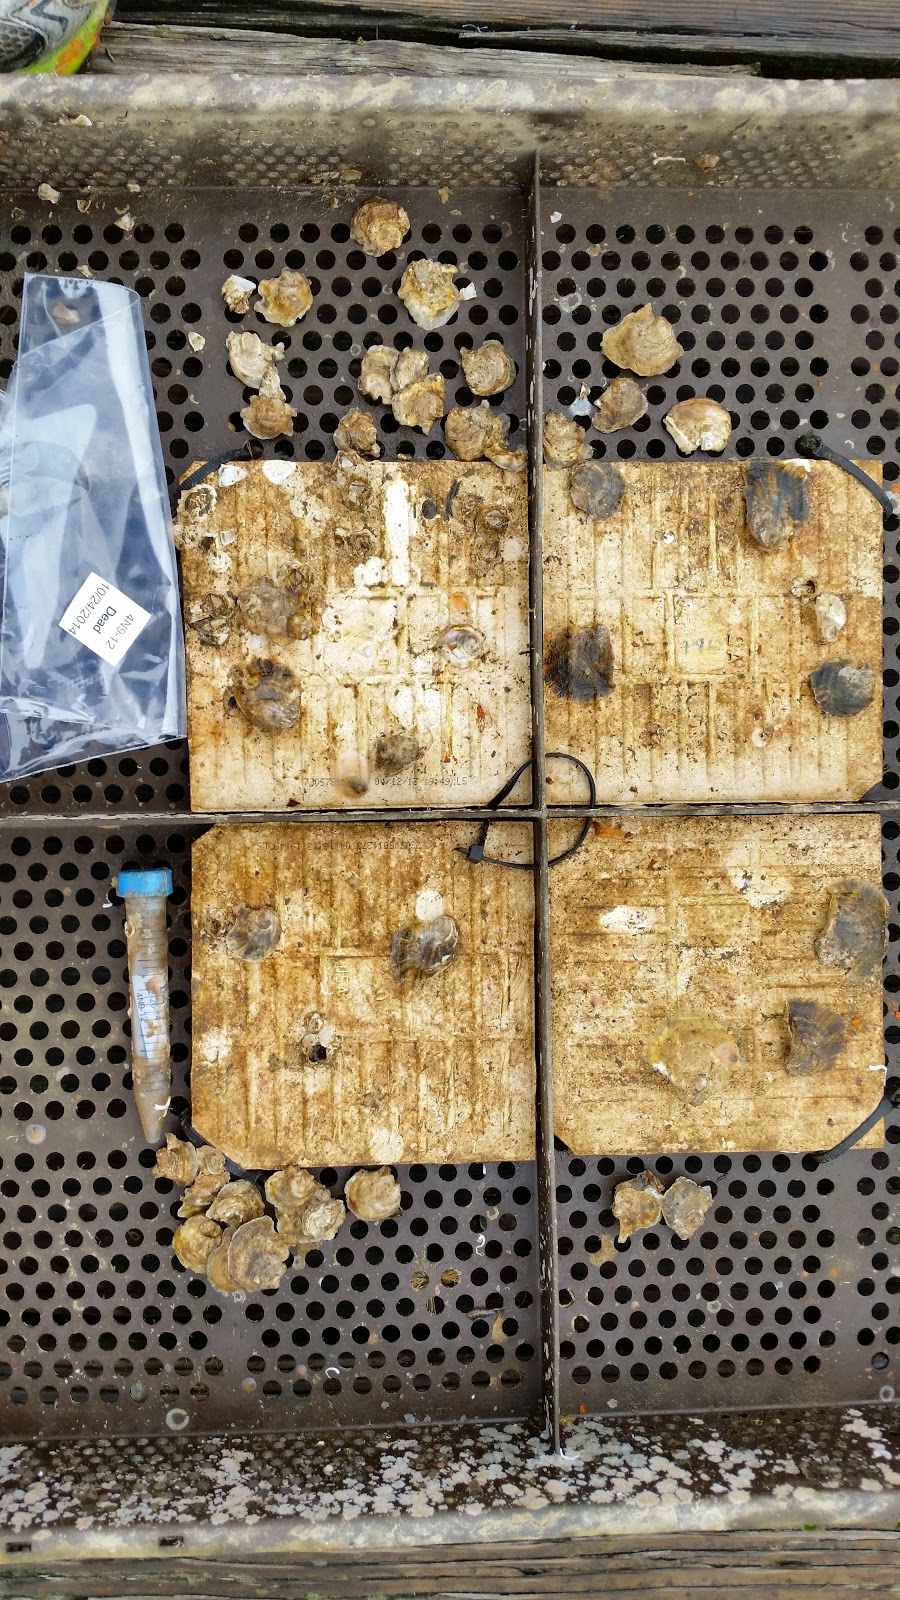
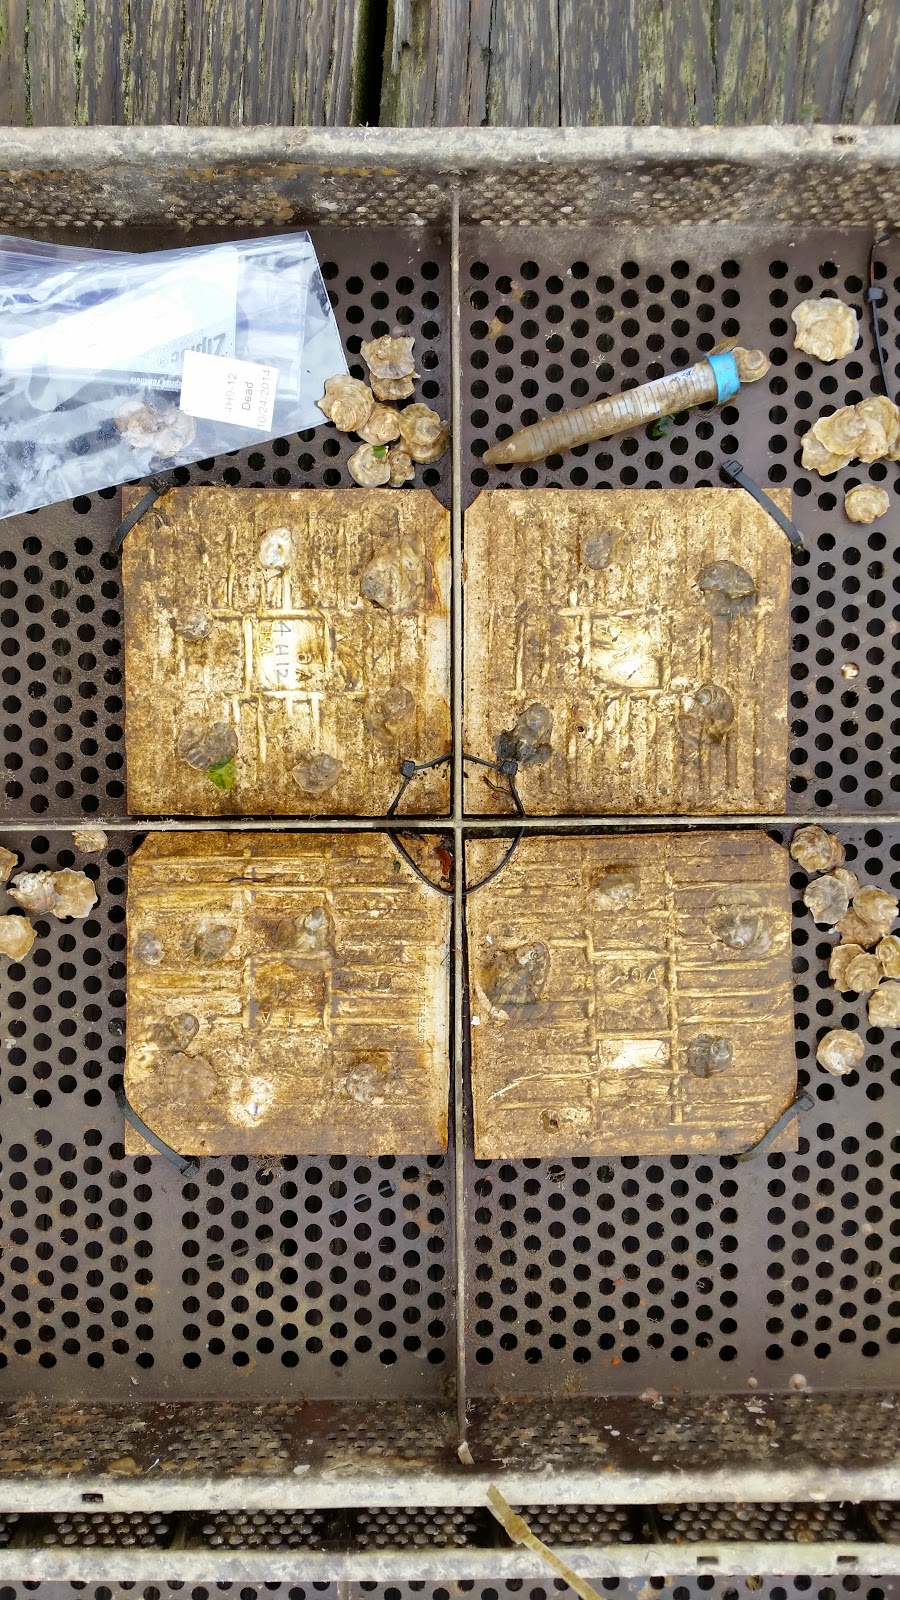
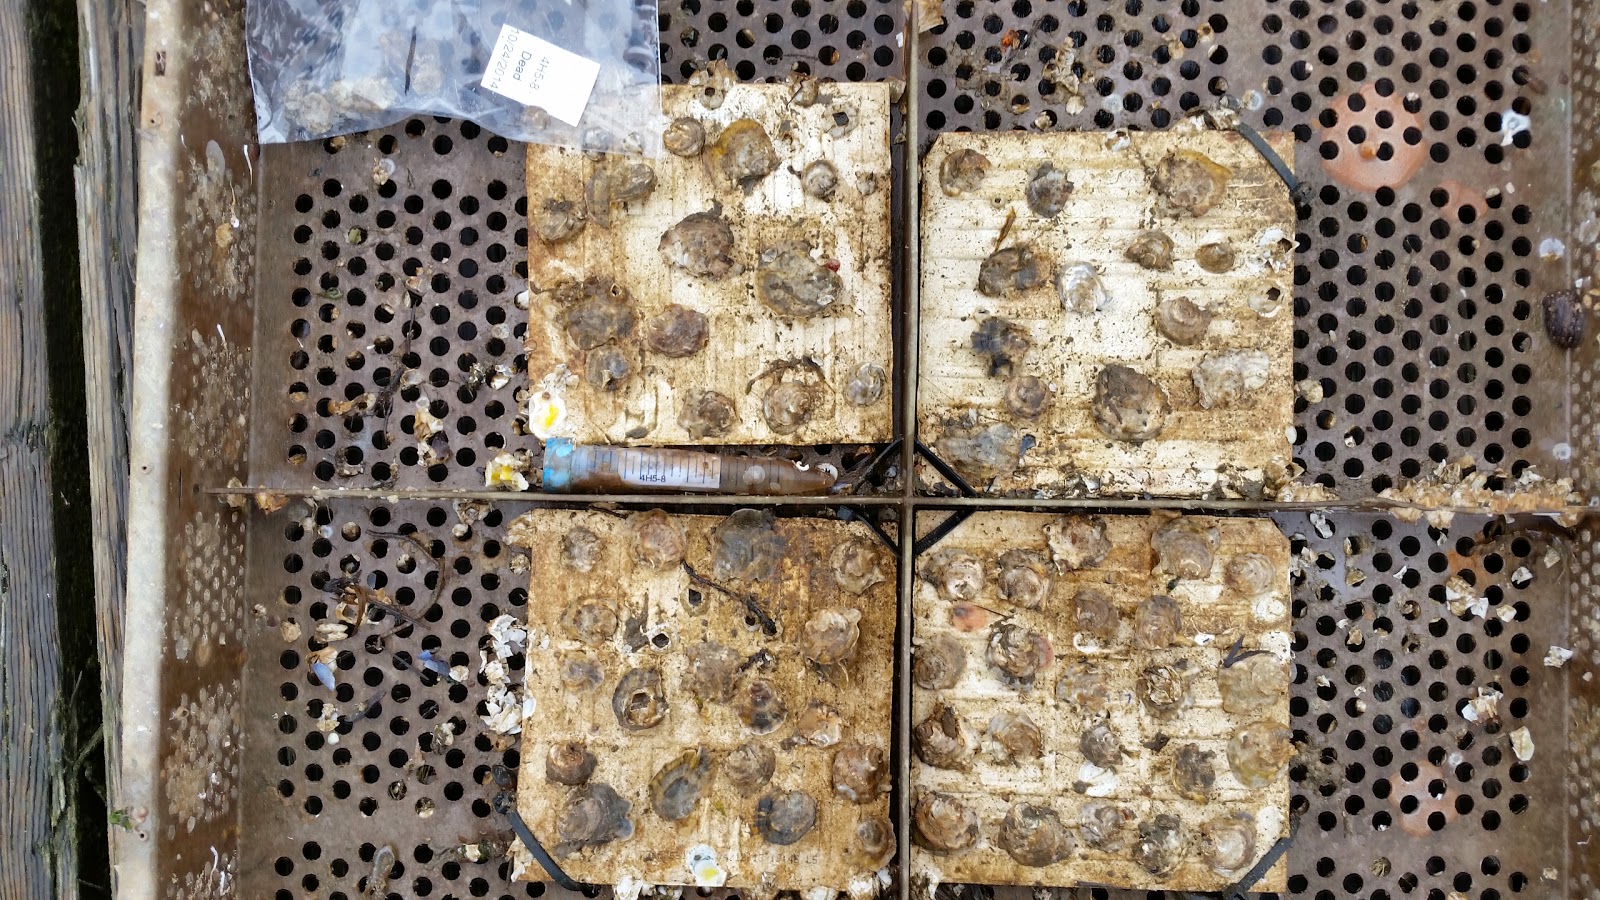
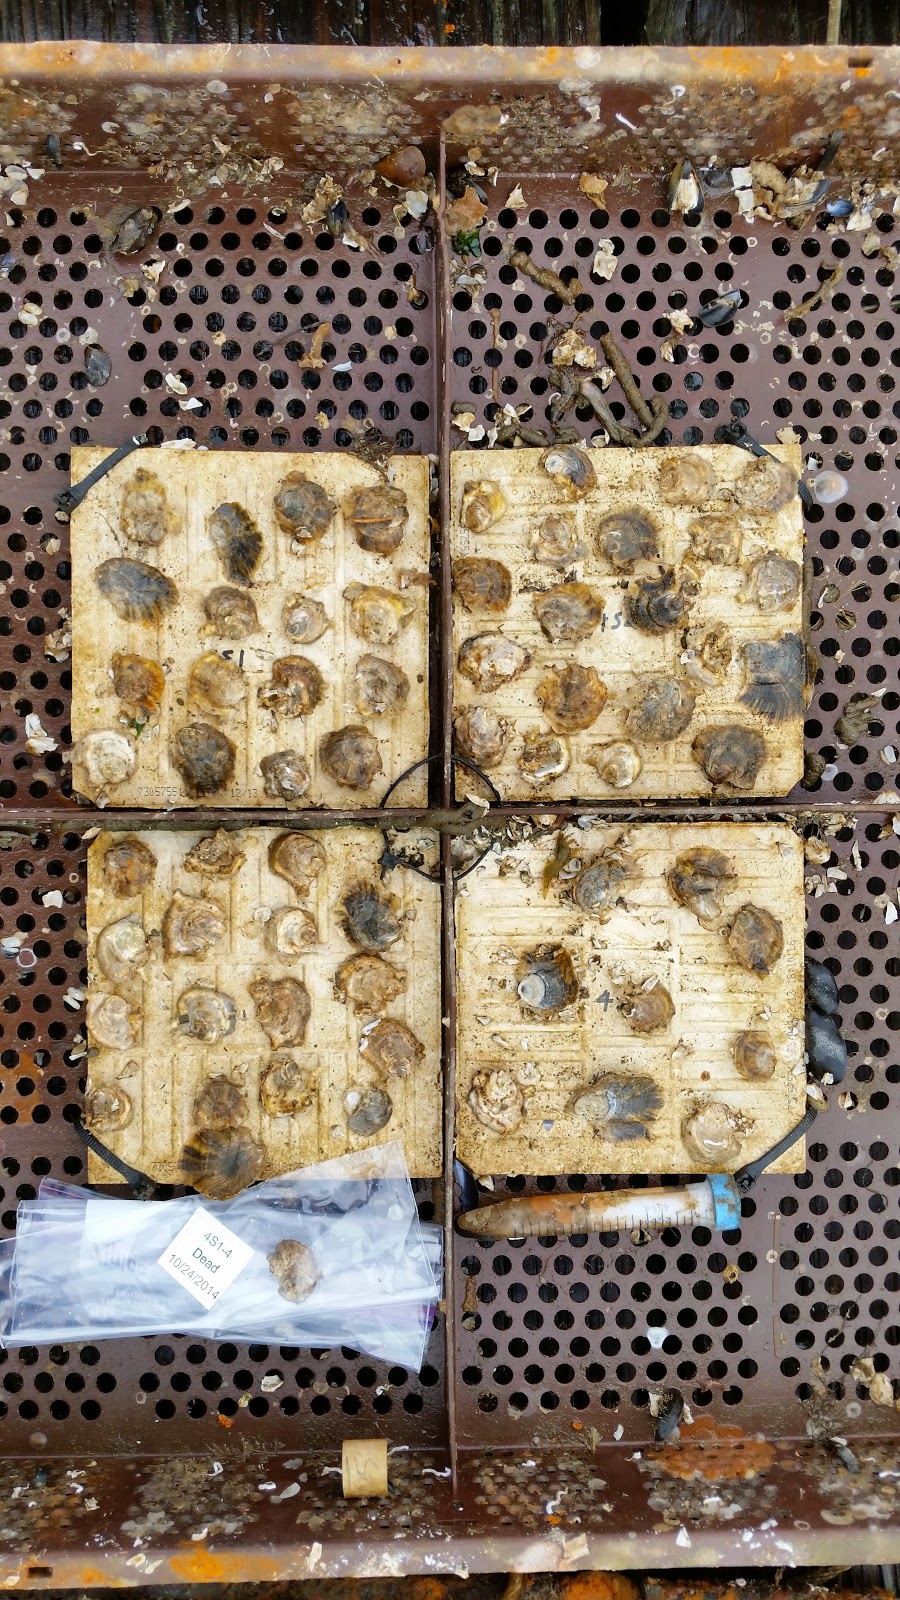
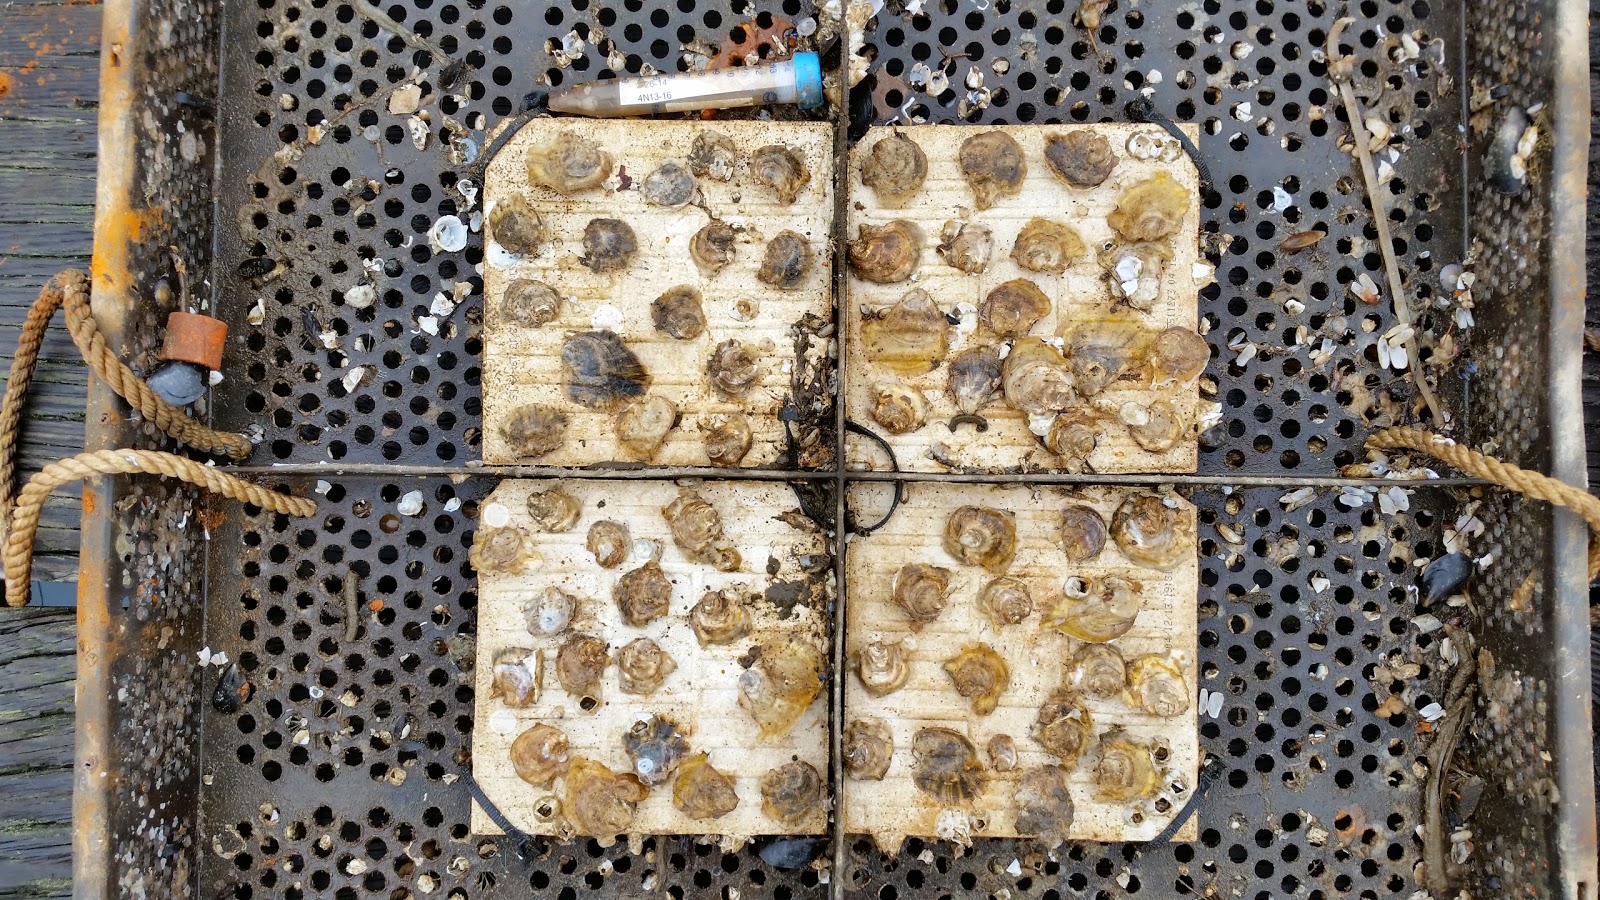
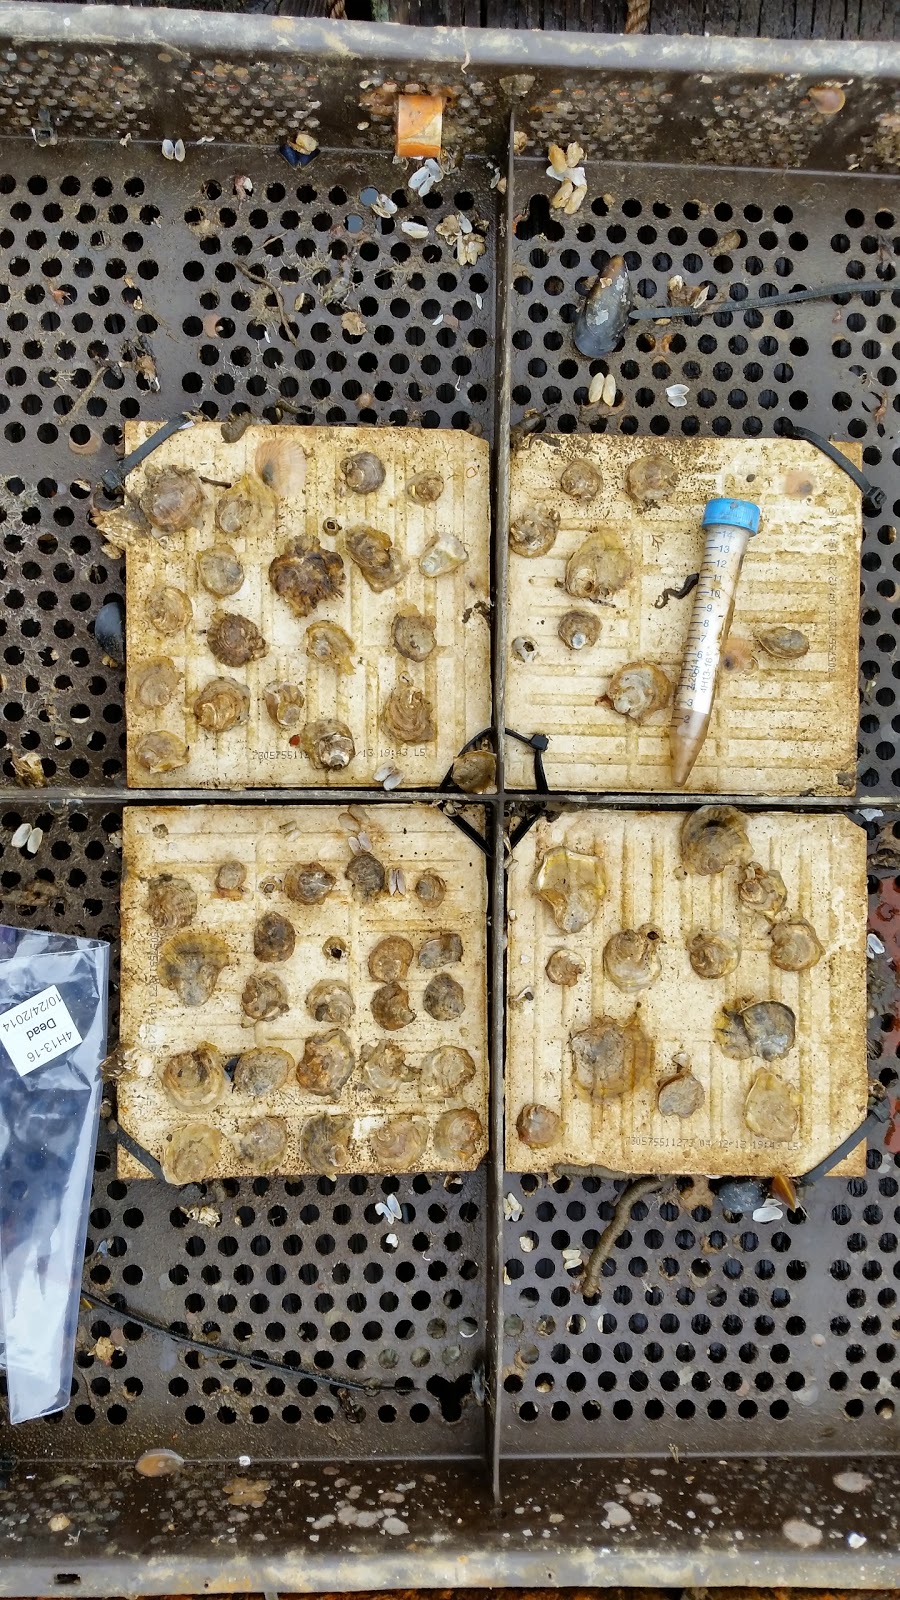
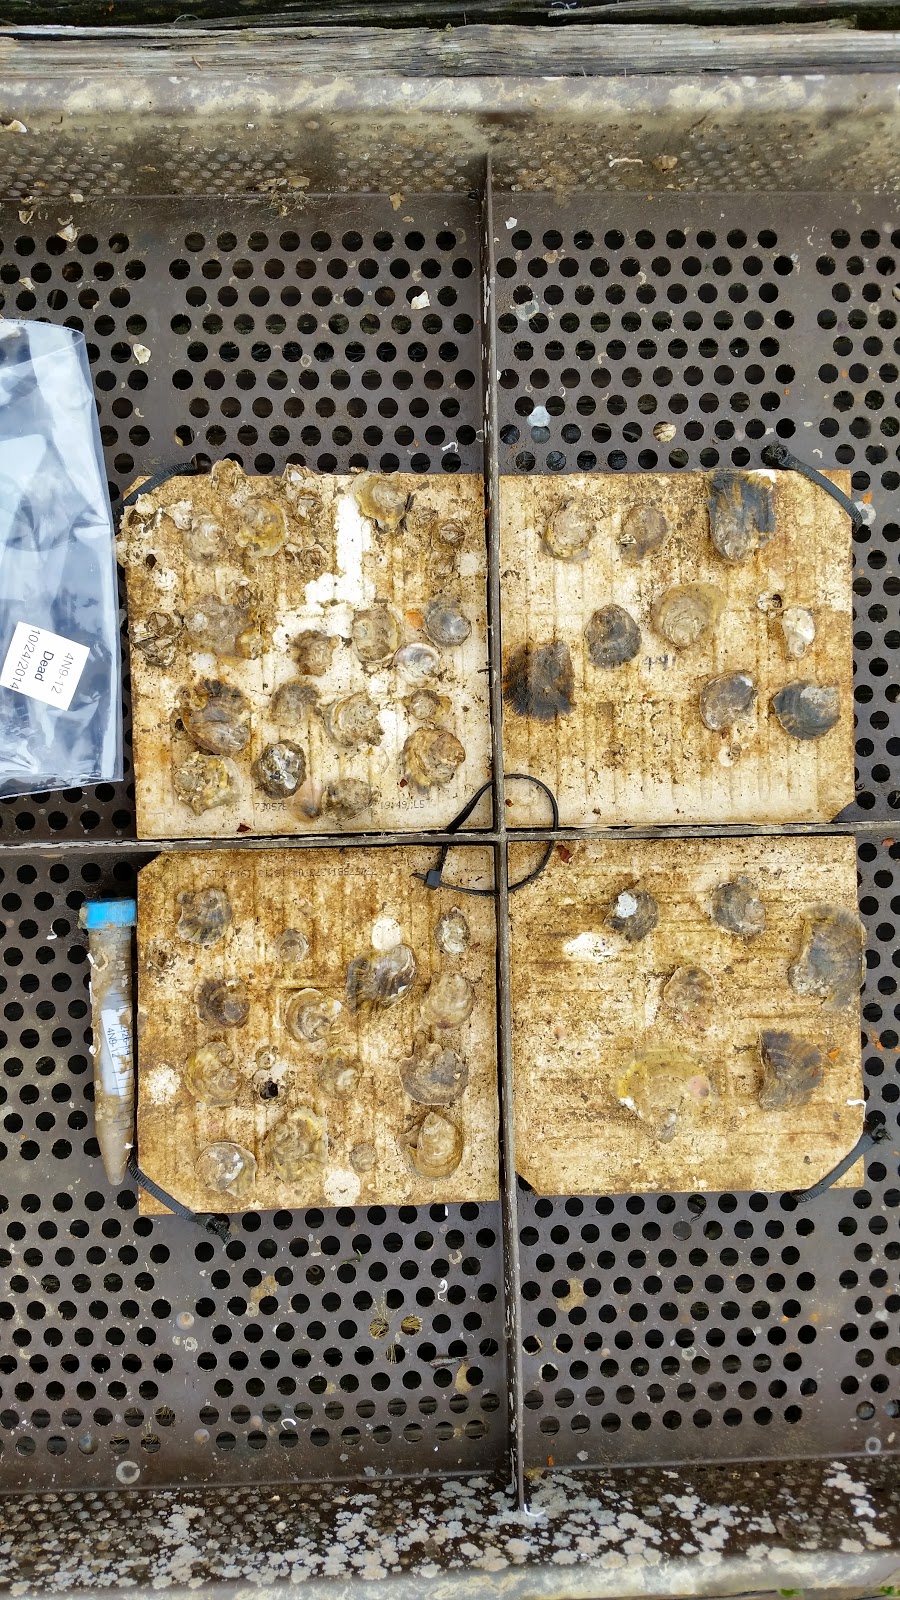
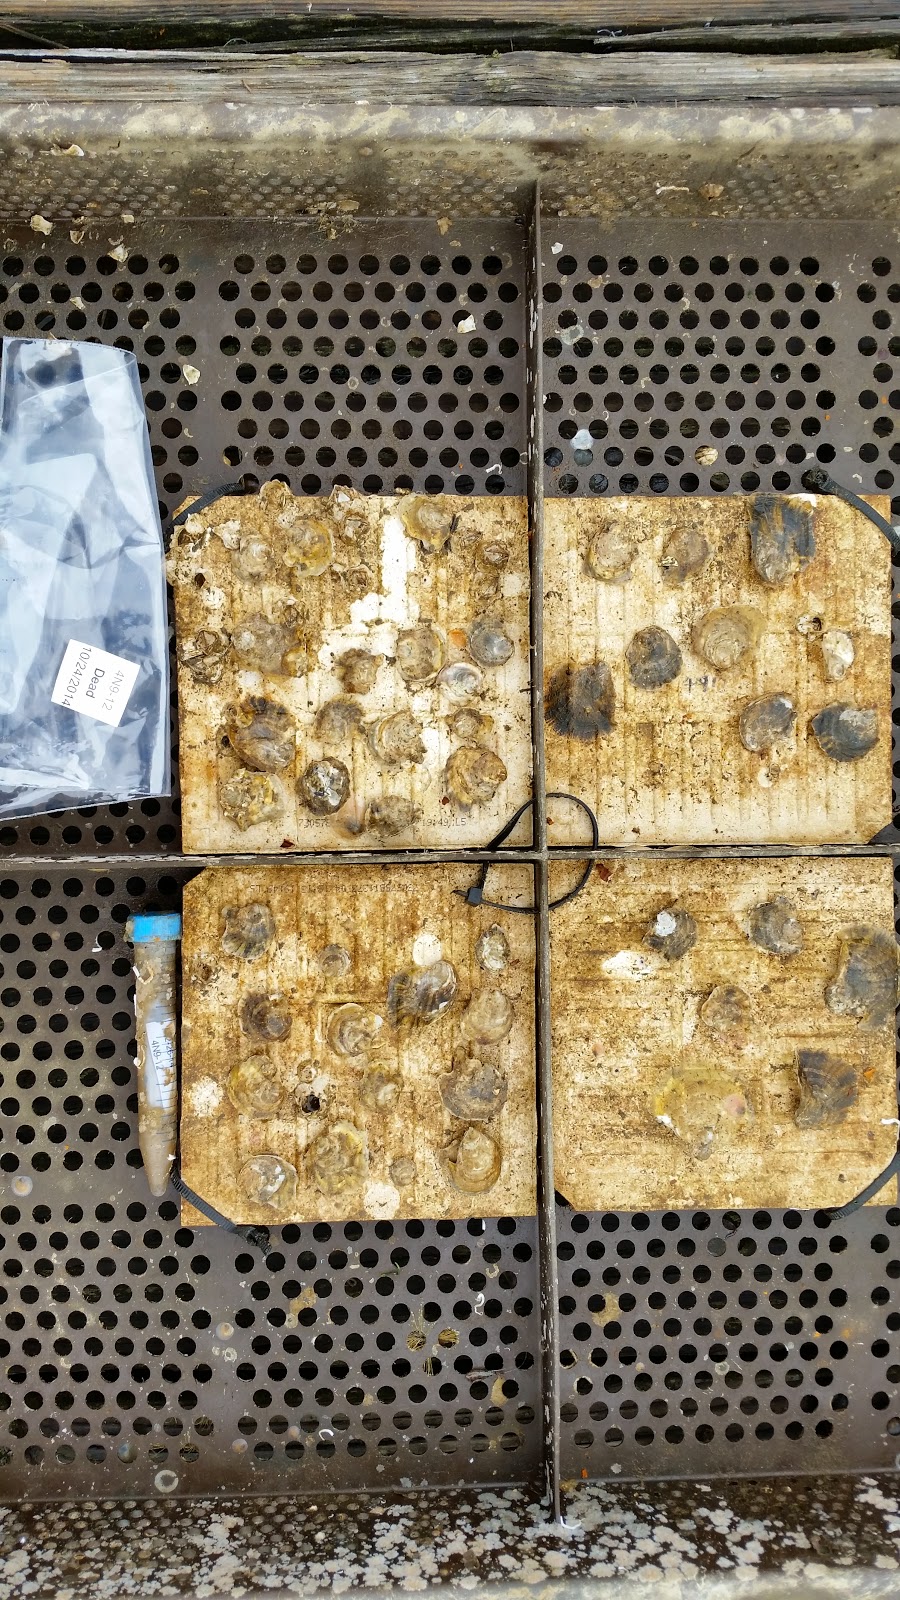
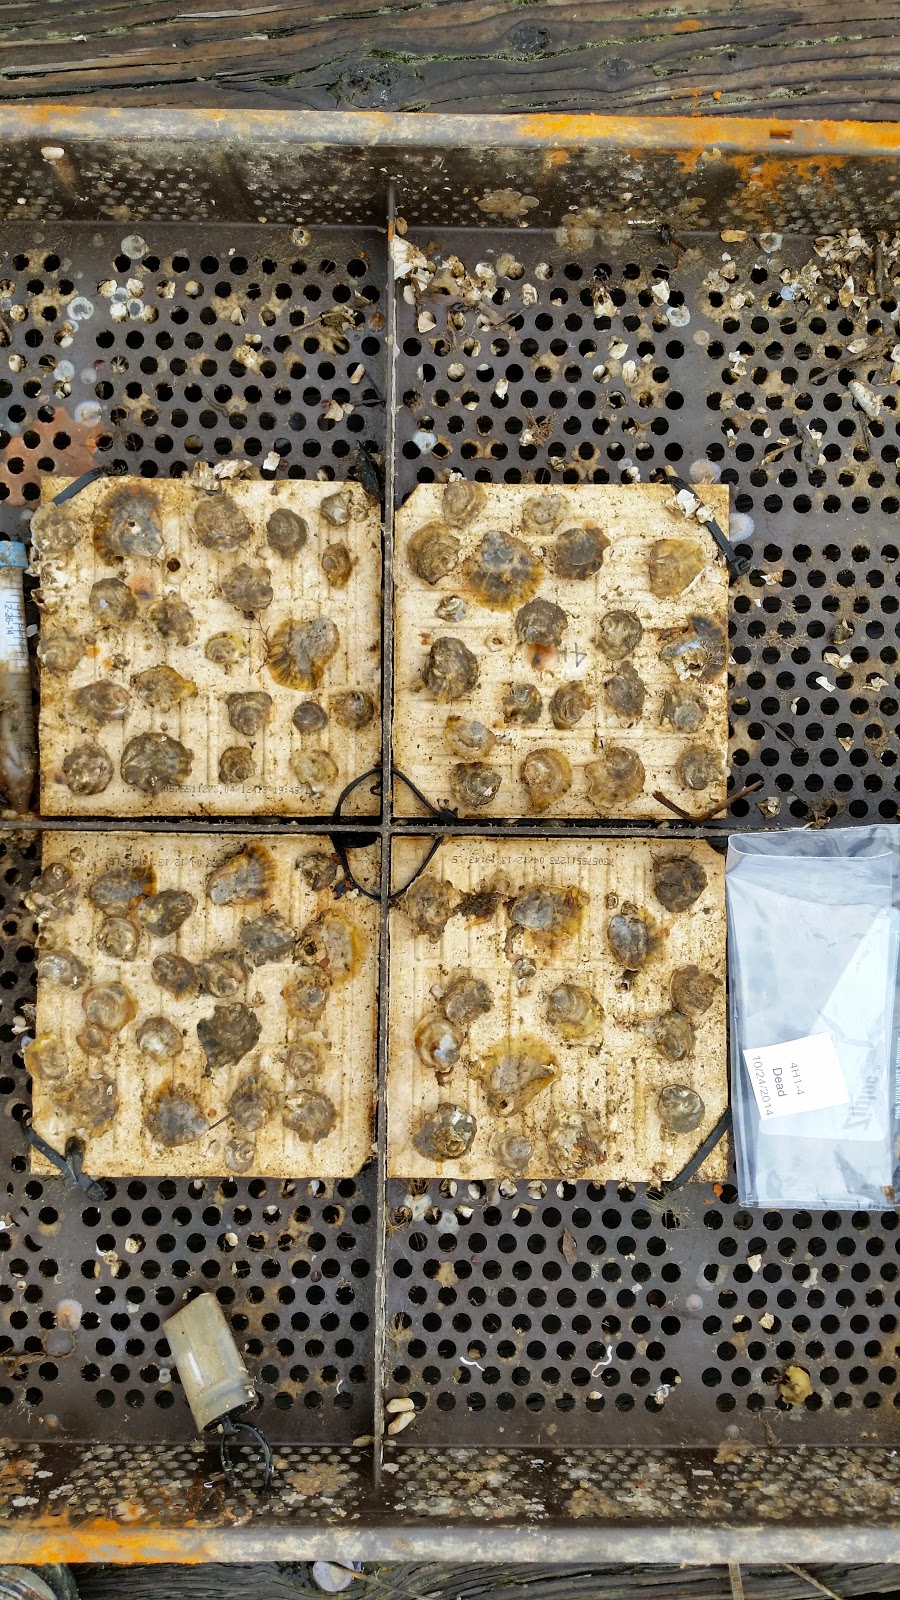
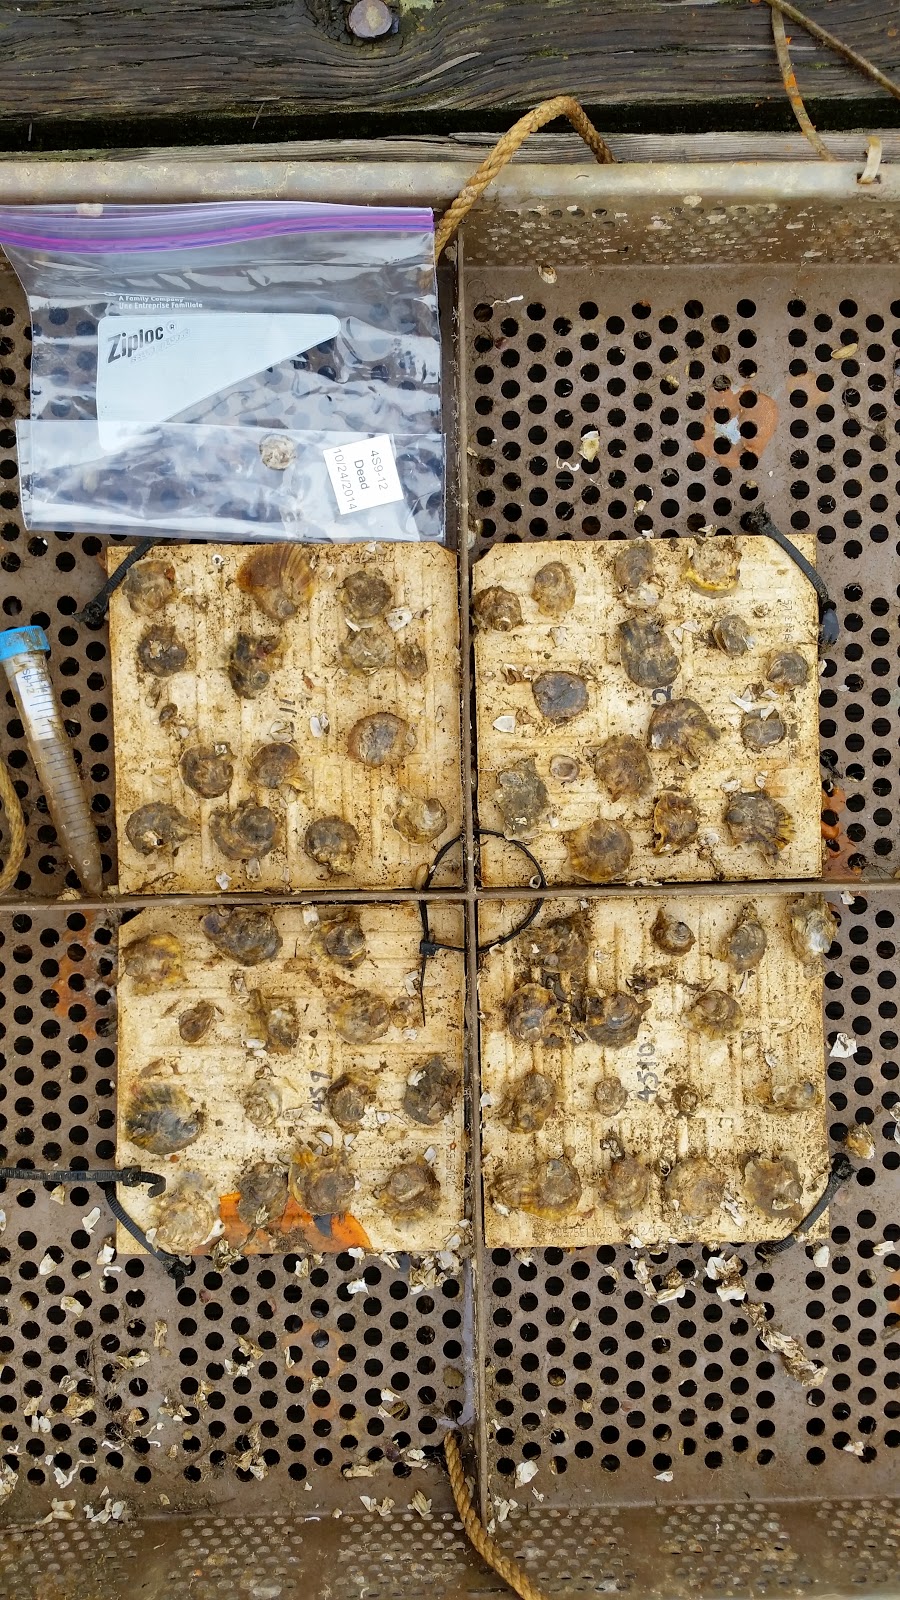
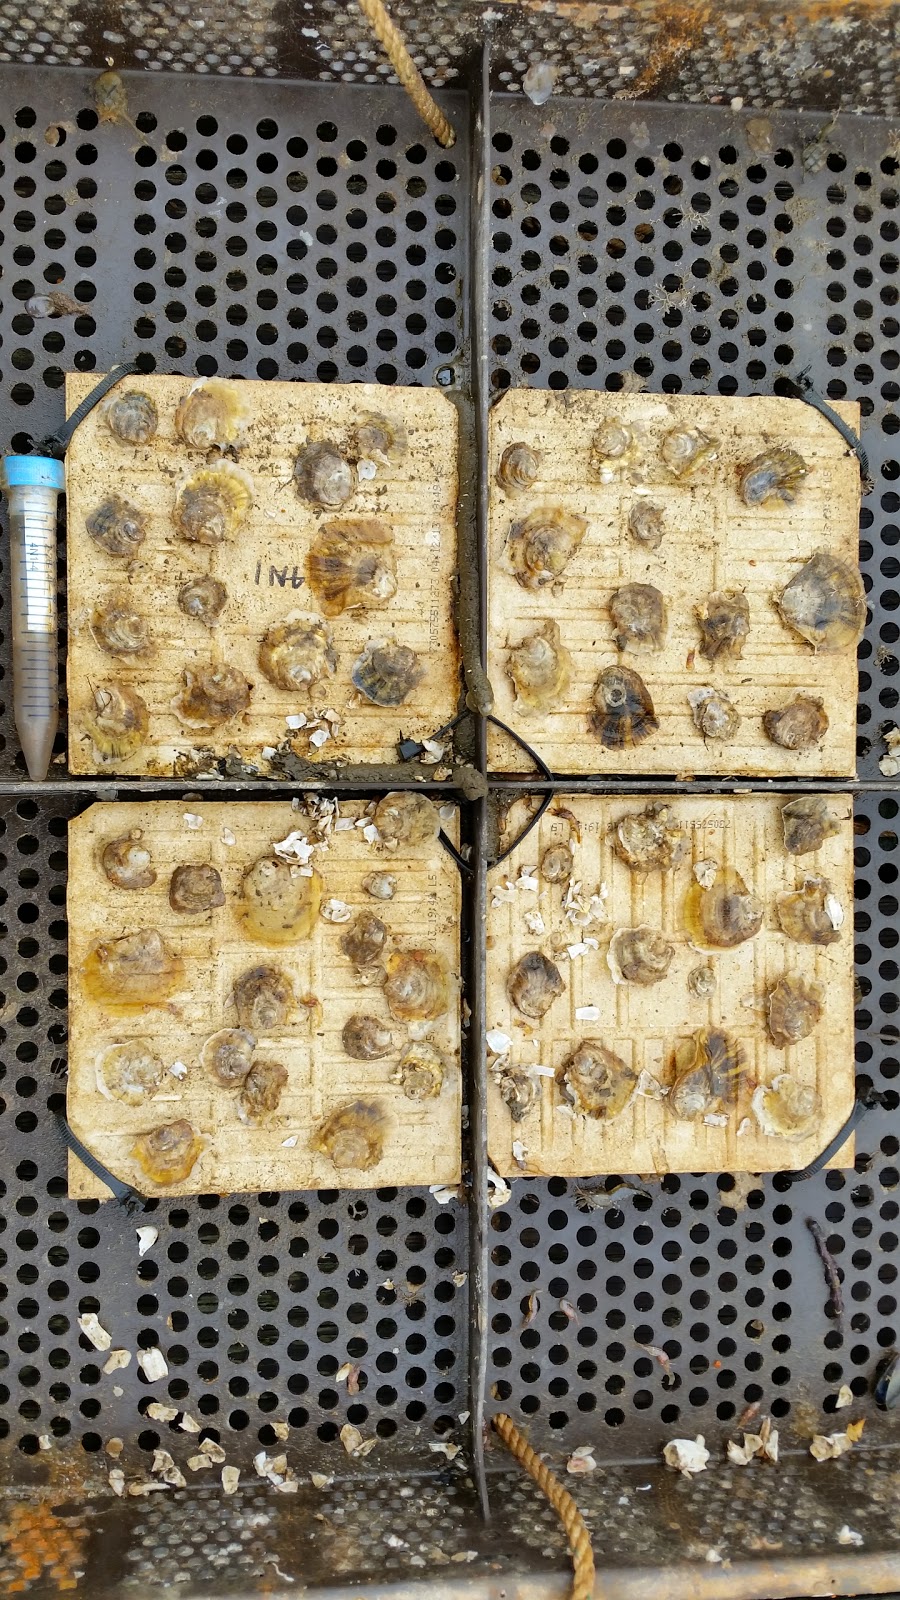
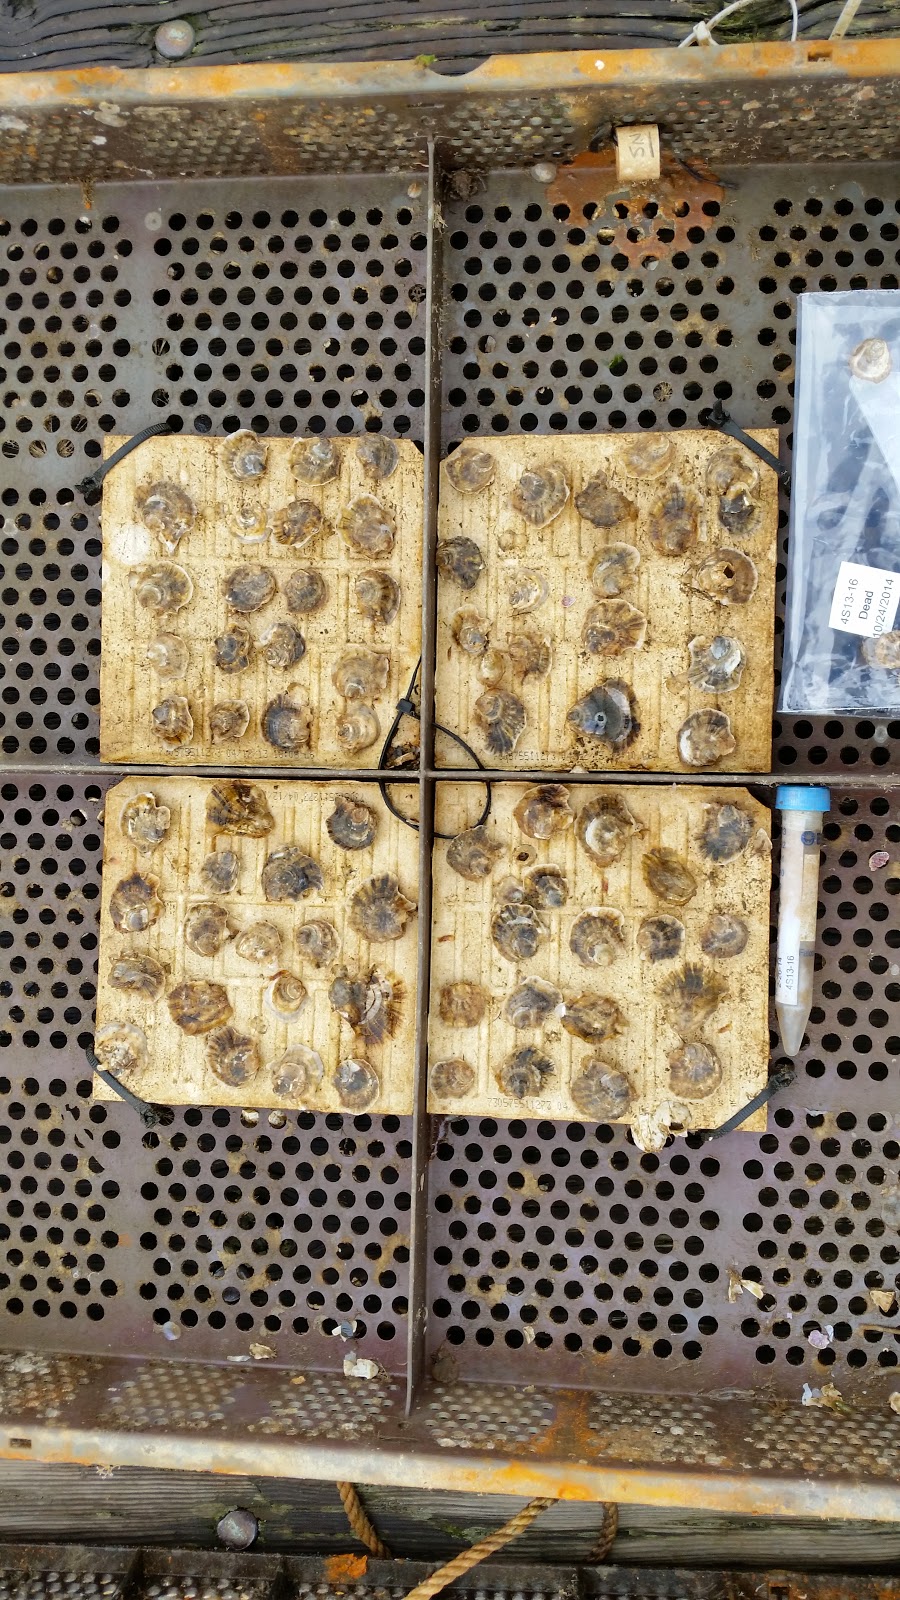
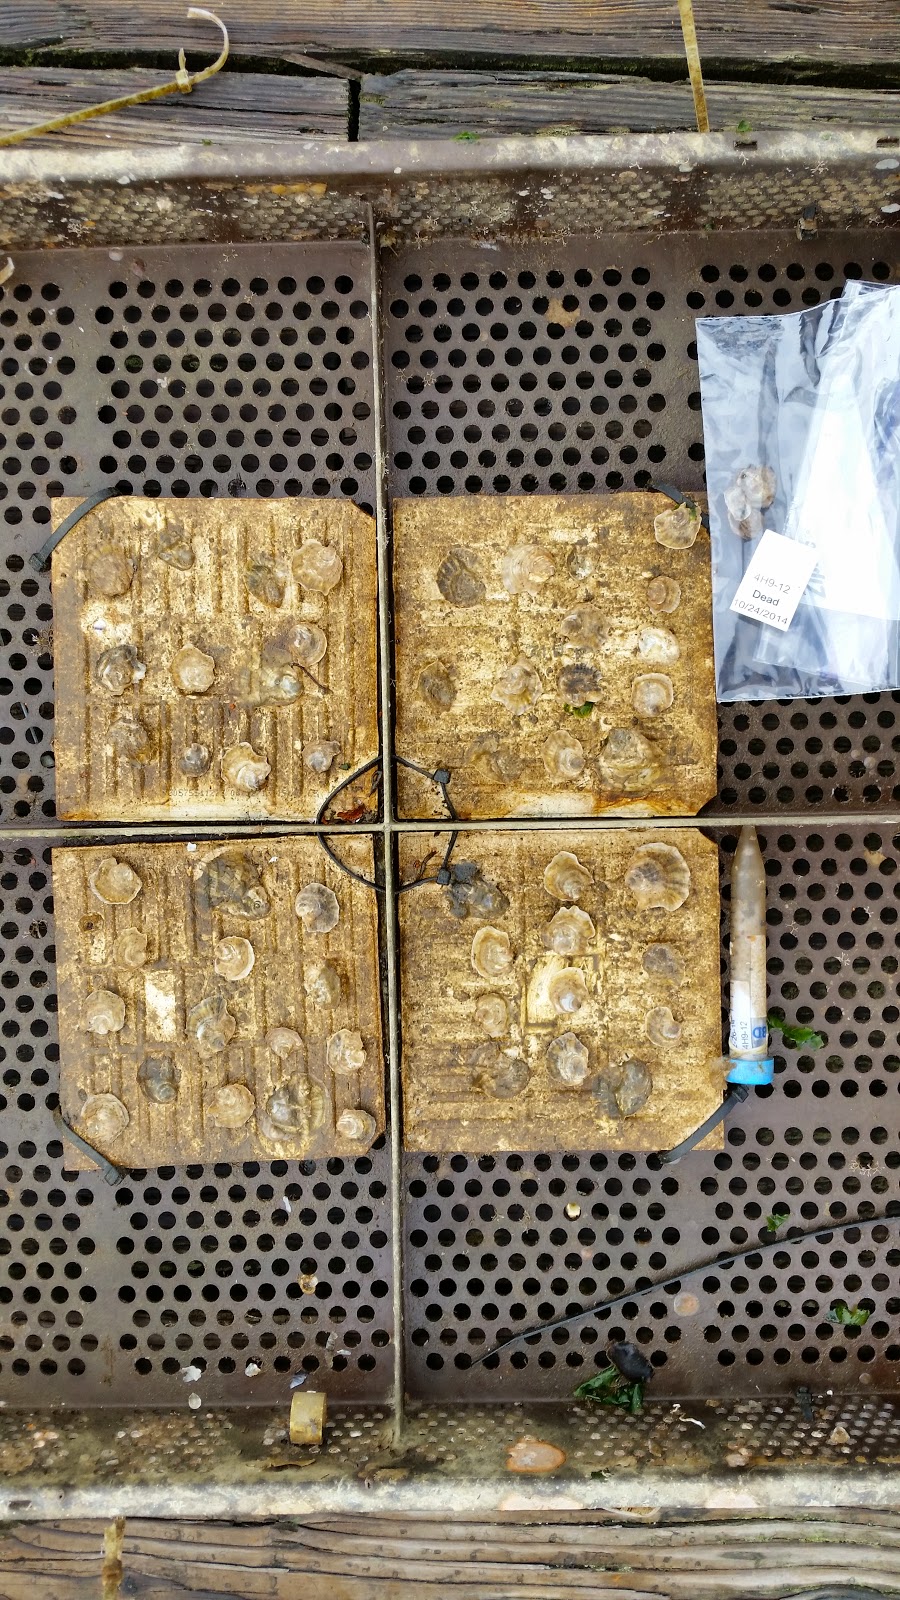
Performed a full workup on the trays at Manchester: counted live/dead, imaged for size, collected samples and morts. We then transferred the oysters from the trays to cages. Mortality was slight but still somewhat low. Less than 10 animals per tray on average.
Numbers as follow
4H9-12
Live 52
Dead 6
4S13-16
Live 73
Dead 6
4N1-4
Live 55
Dead 0
4S9-12
Live 57
Dead 1
4H1-4
Live 77
Dead 2
4N9-12
Live 46
Dead 3
4S5-8
Live 66
Dead 0
4H13-16
Live 60
Dead 1
4N13-16
Live 64
Dead 0
4H5-8
Live 60
Dead 6
4S1-4
Live 62
Dead 1
4N5-8
Live 62
Dead 5
Showing posts with label ImageJ. Show all posts
Monday, October 27, 2014
Tuesday, August 19, 2014
8 19 2014 ImageJ Analysis
FTR 230
Hi 60s to low 70s sunny
Participants: Sam Adams and Jake Heare
Sam showed me how to do the ImageJ measurements on the trays today as well as complete several of the trays. The procedure is quite simple.
Hi 60s to low 70s sunny
Participants: Sam Adams and Jake Heare
Sam showed me how to do the ImageJ measurements on the trays today as well as complete several of the trays. The procedure is quite simple.
- Open original image in ImageJ
- Select line tool
- Using on tray size standard (calipers or tile) draw a line
- Click M to save after each measurement
- repeat this 5 times on the size standard
- On each oyster start at the edge of the umbo and draw a line to the furthest point on the bill.
- Click M to save each measure
- Proceed measure all oysters in a logical manner from left to right in each quadrant.
- Once all have been measure click Save As in Results window
- Save file with the tray label followed by date followed by the word Raw.
- Open file in Excell
- To get the size conversion you must average of the first 5 "Area" measurements.
- Then divide the known size of the Size standard. (10 mm on calipers, 6 inches for tile) by the average you get from the firt 5 measurements.
- Using the conversion ratio you can then multiple each ImageJ "Area" measurement by the conversion ratio.
- On the right side of the spreadsheet dedicate 5 columns to the measurements
- Column 1 (C1) = Date, C2 = Tray, C3 = Oyster Number, C4 = Area measure, C5 = converted area measurement
- Fill in columns with appropriate info
- Save file as Excel workbook in eagle/dermochelys/ImageJake with just the tray label and date info
- Copy and paste the 5 right side columns into the google sheets master document on Google docs
- Repeat process for each image. This should create two files for each image, a raw data and a converted data file.
Subscribe to:
Posts (Atom)