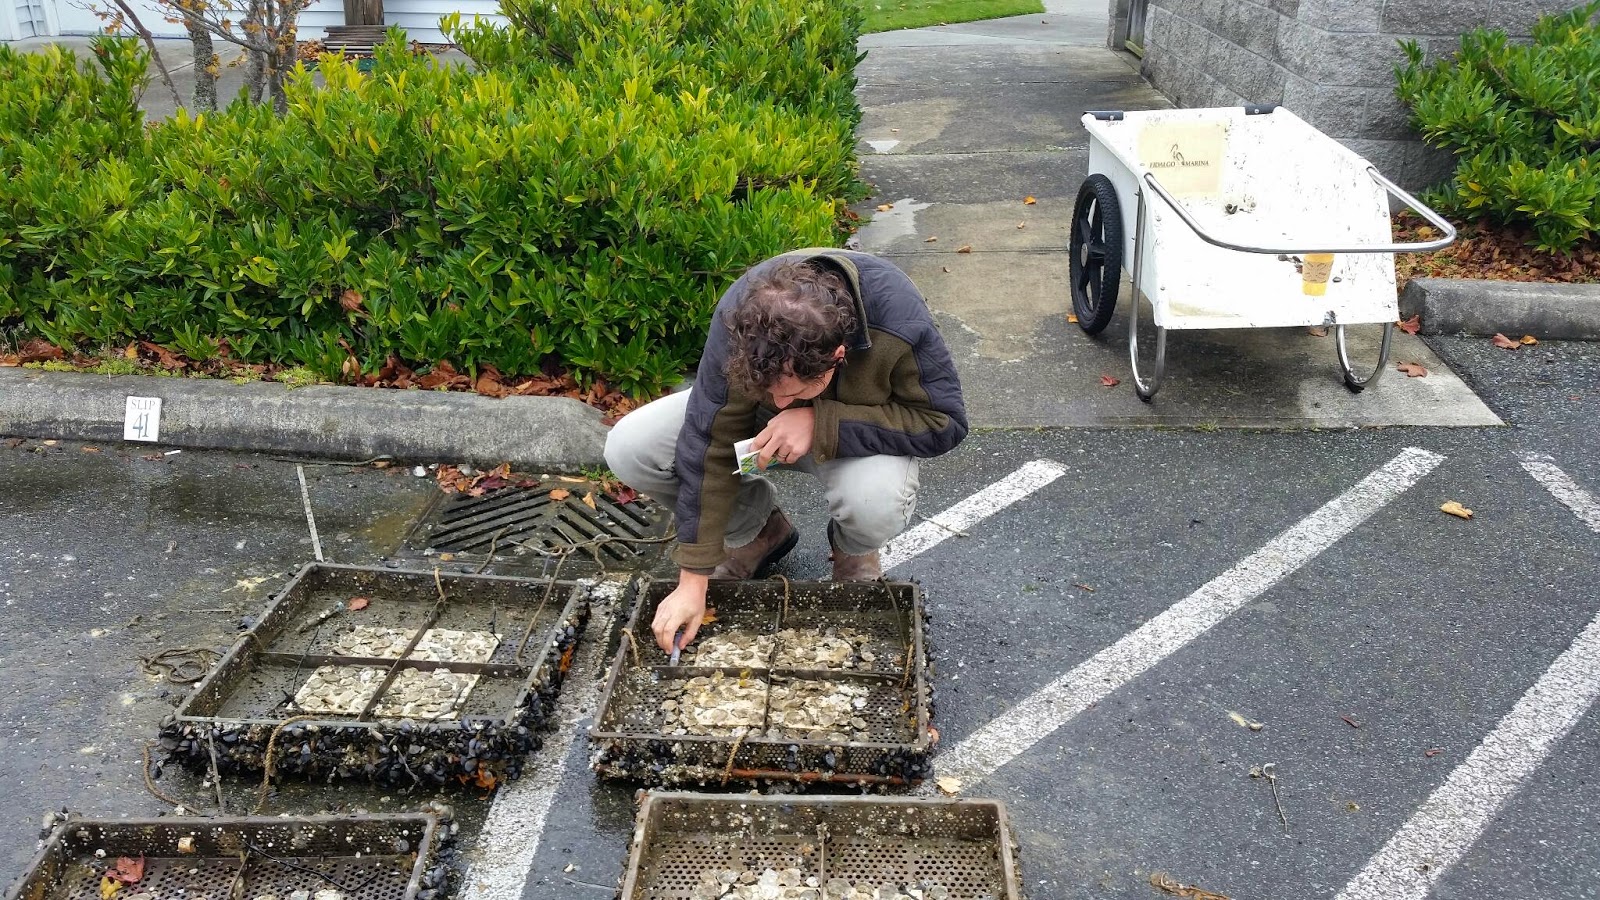
Showing posts with label Size. Show all posts

Friday, October 17, 2014

10 17 2014 fidalgo fall maintenance

Fidalgo bay marina

Windy, low to mid 50s. Cloudy partly rainy.

Participants Jay Dimond, sean Bennett,  jake heare.

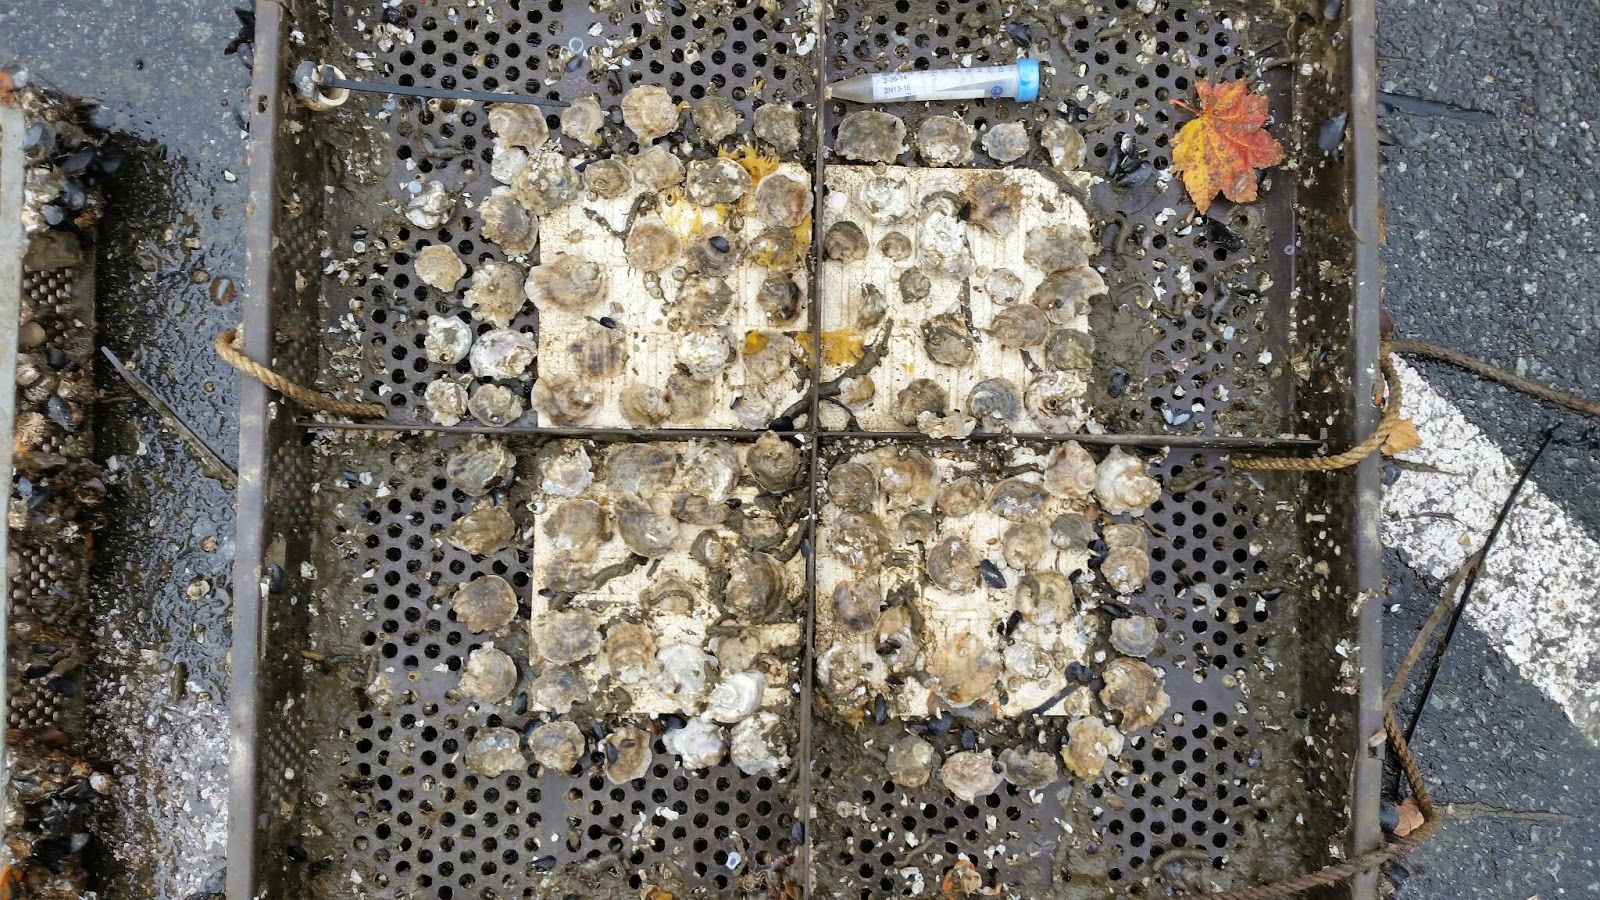
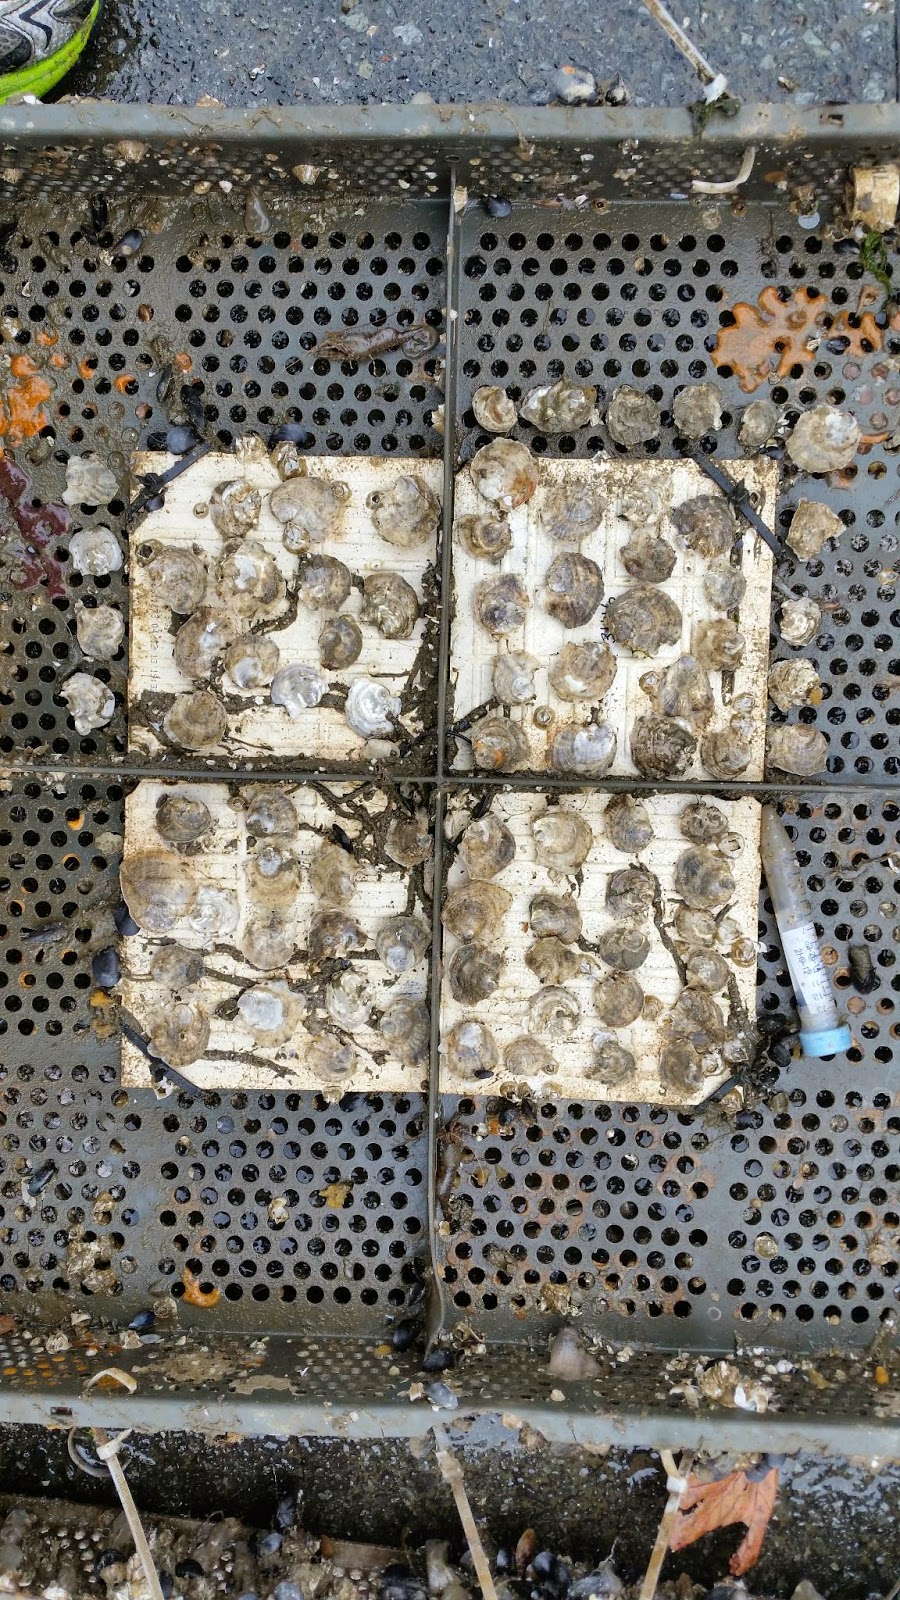
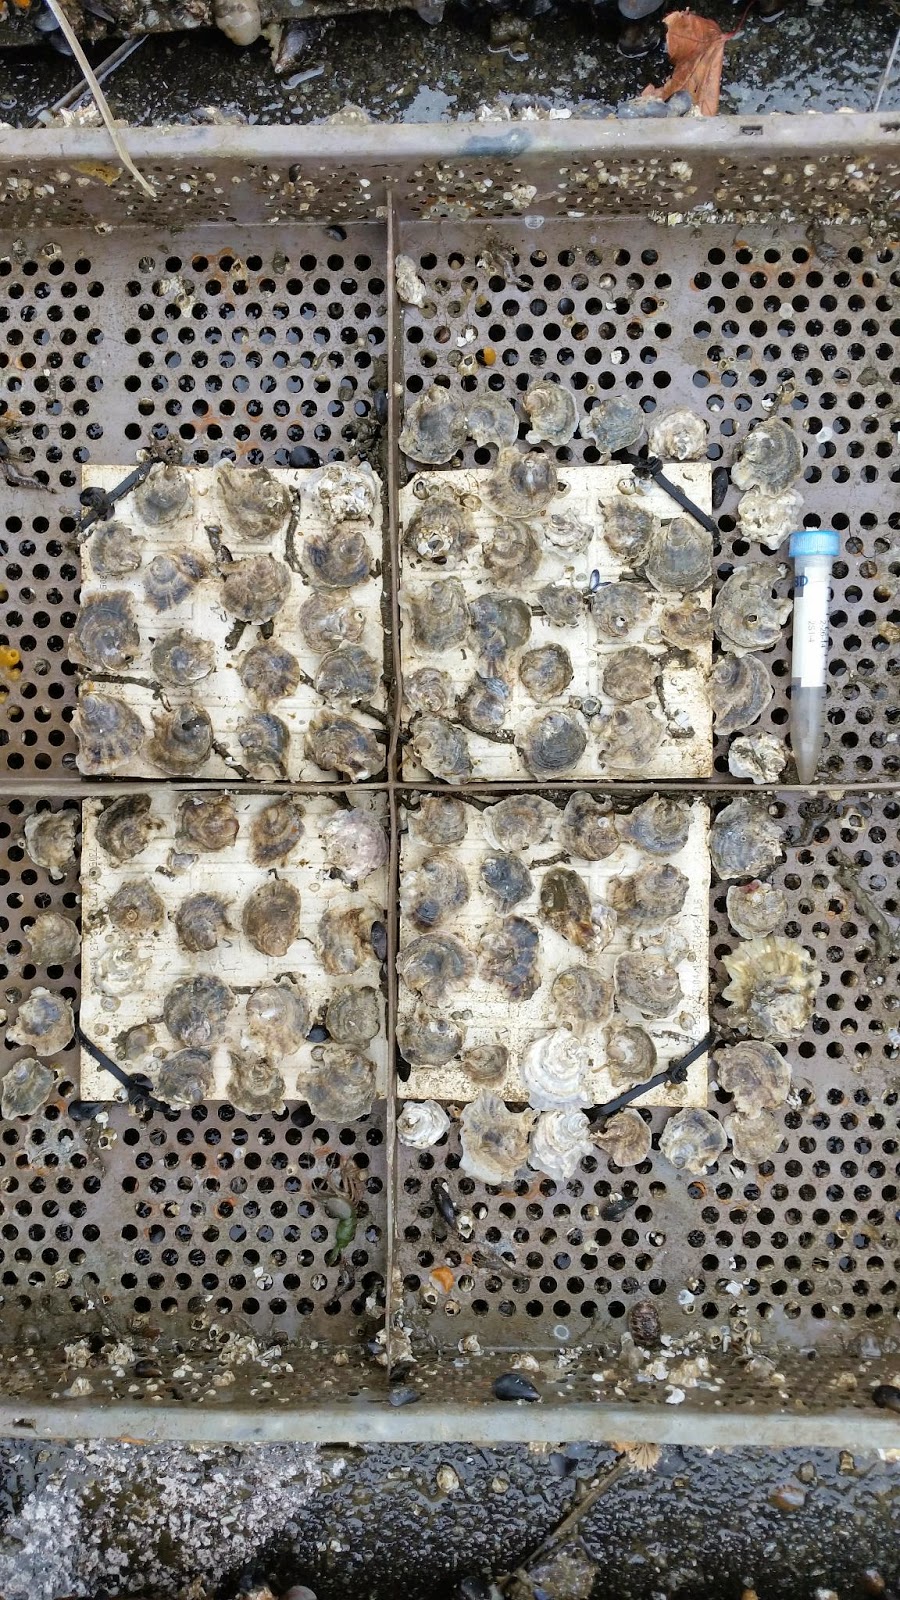
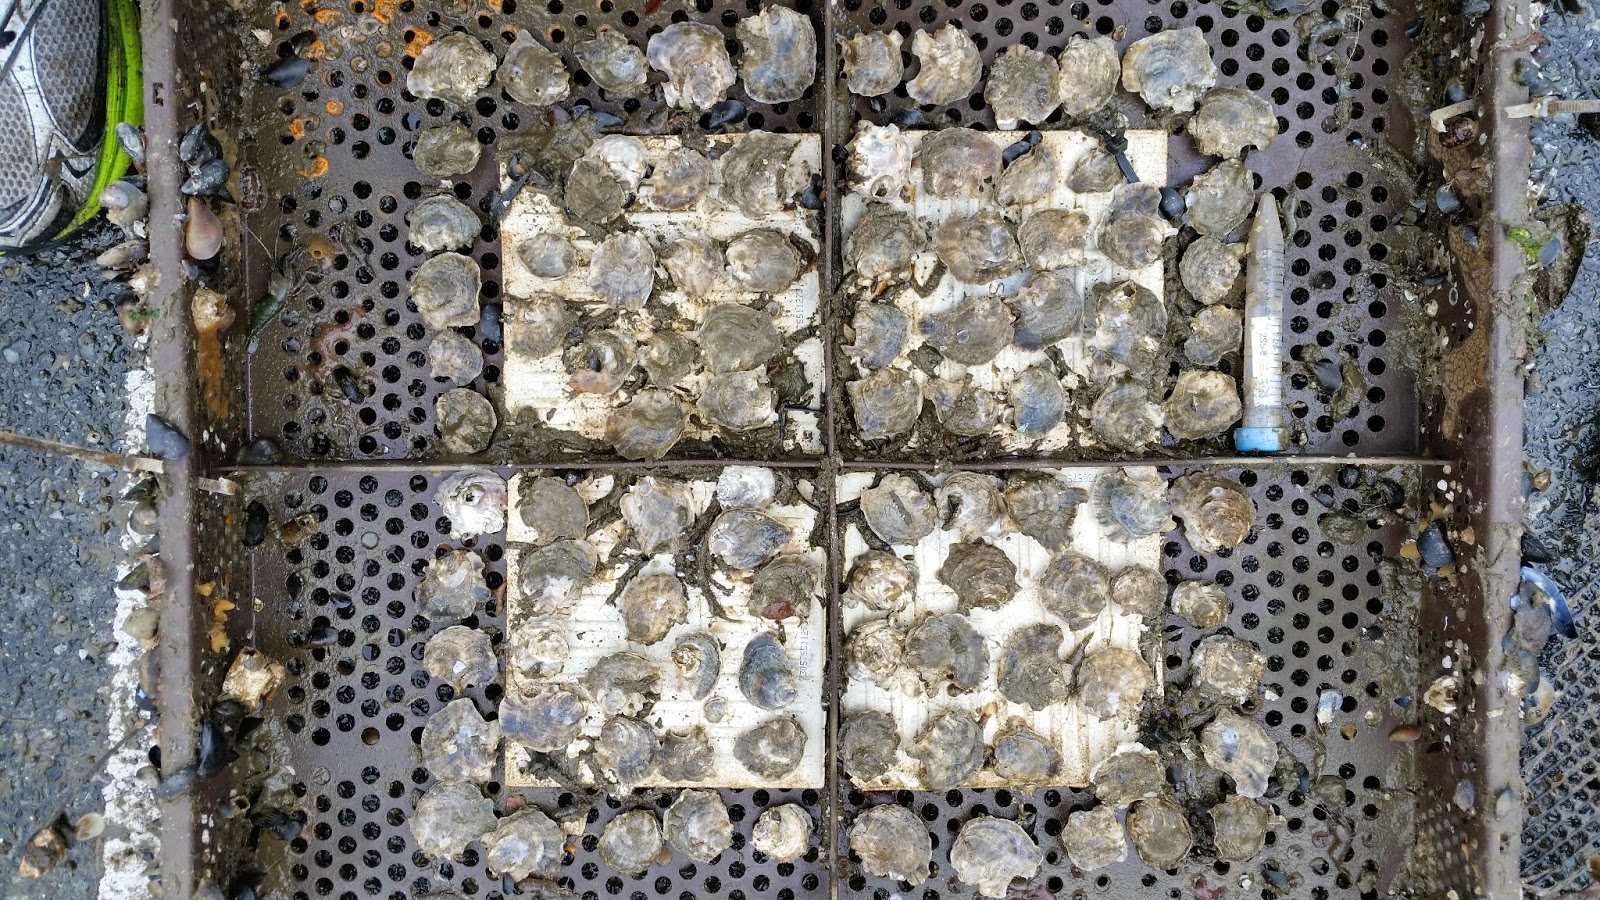
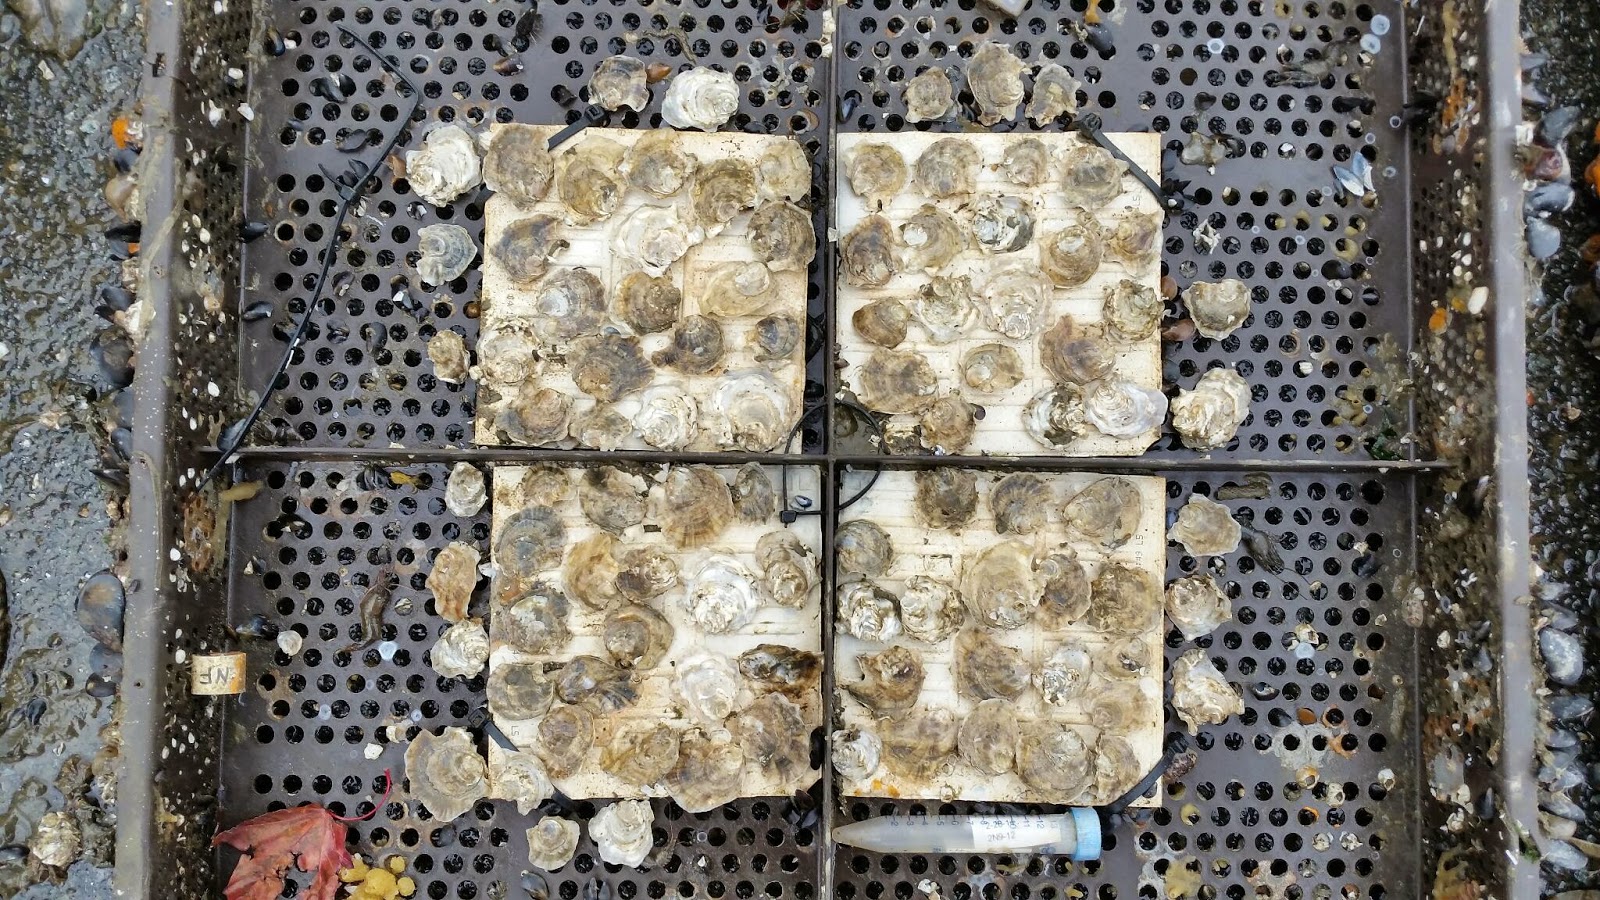
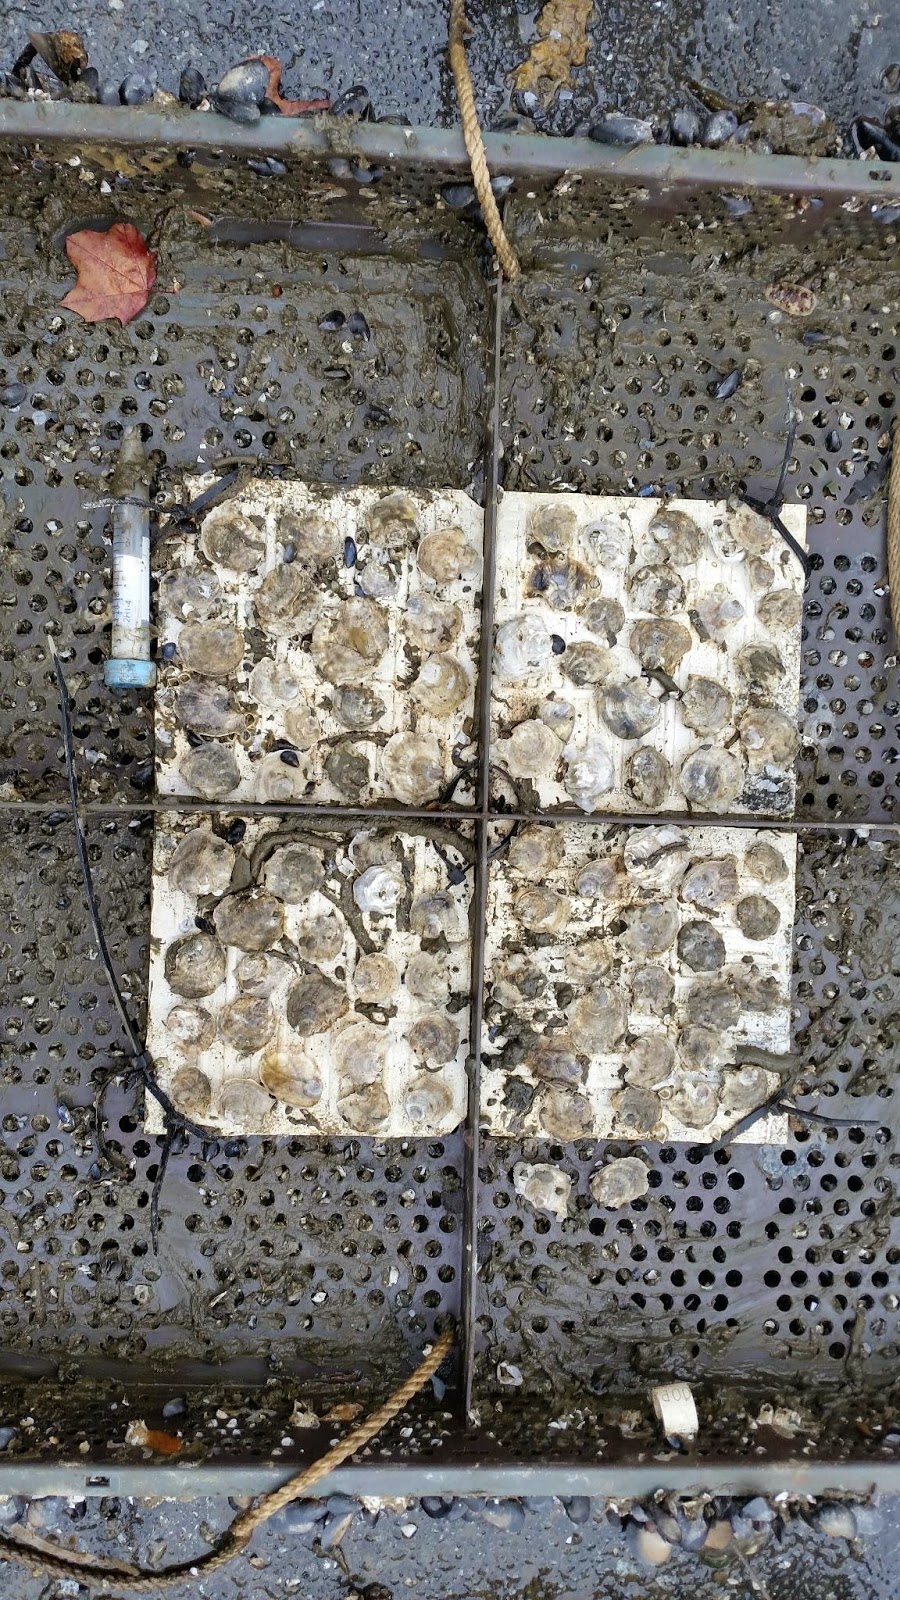
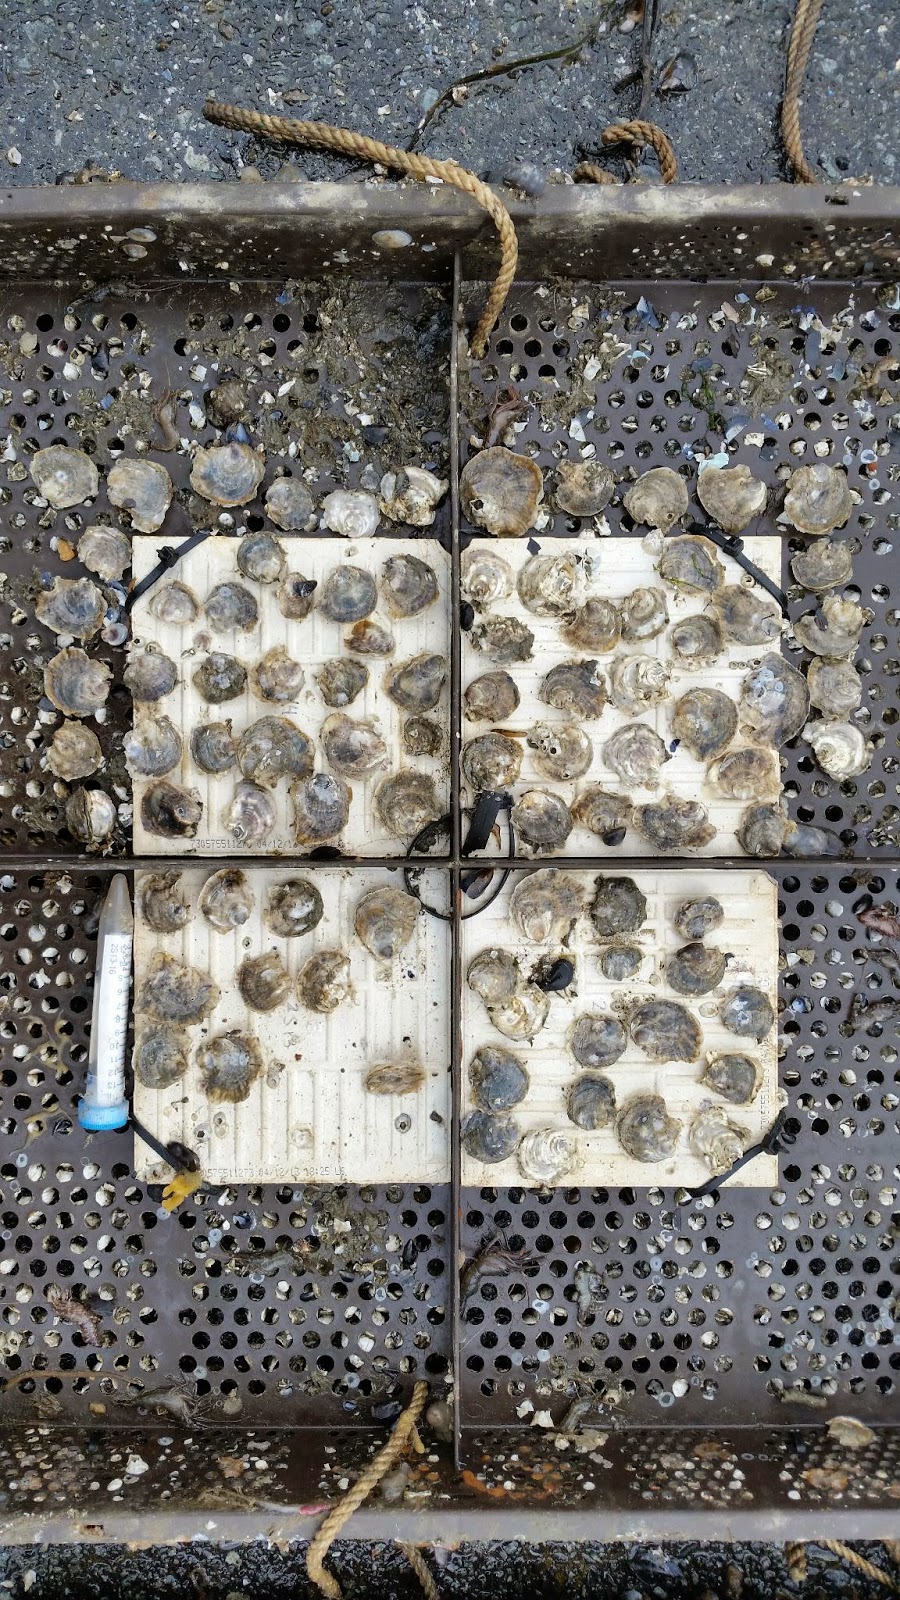
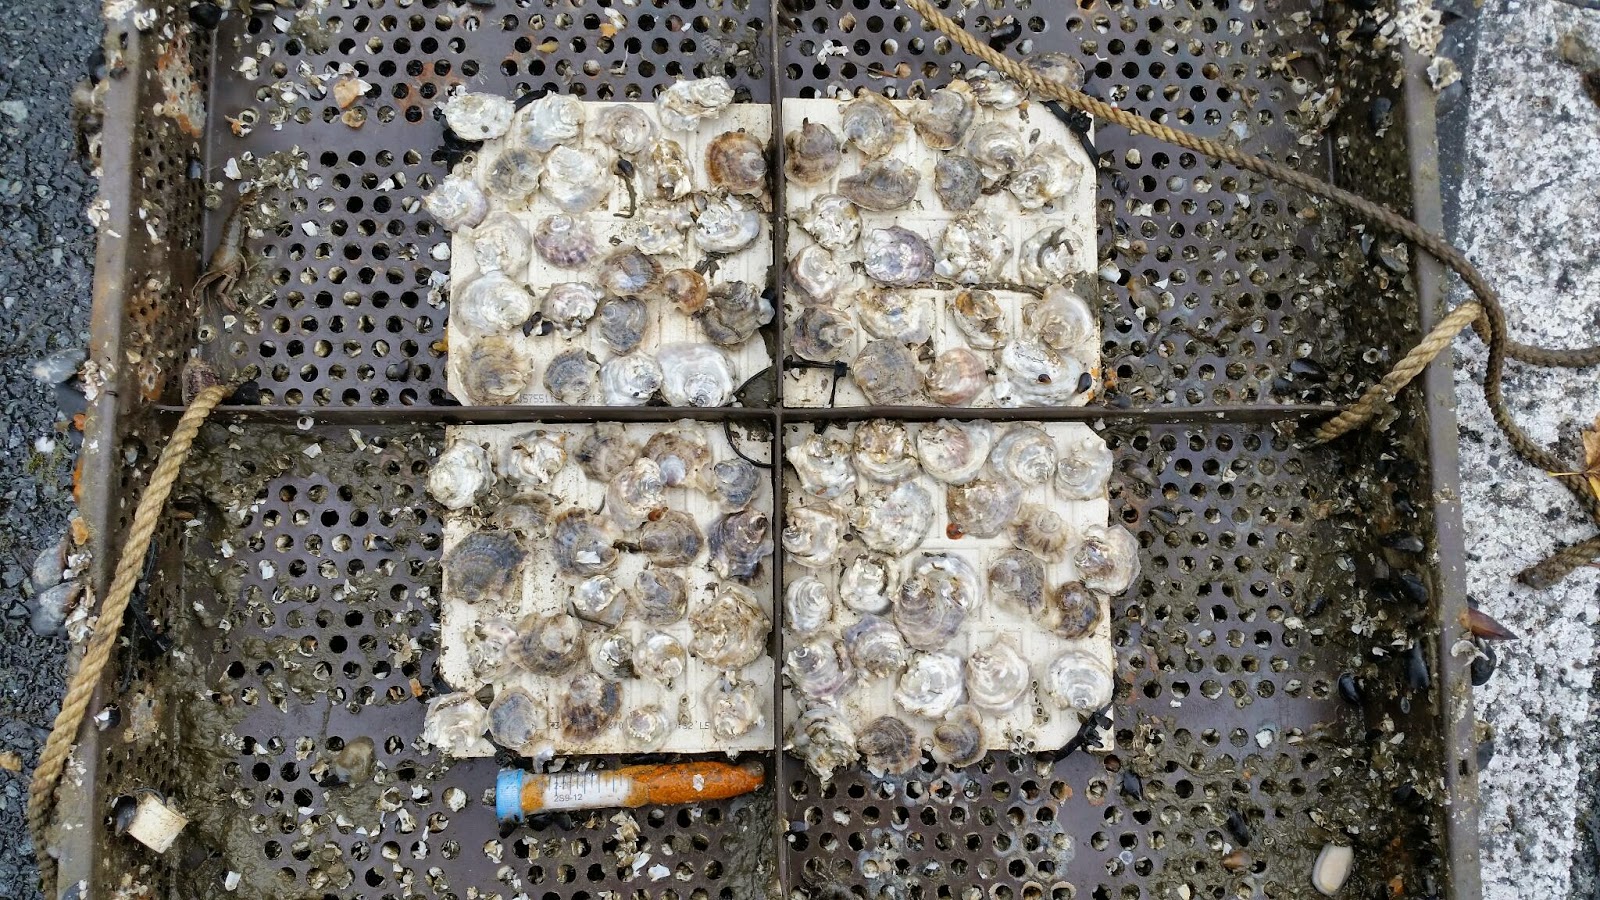
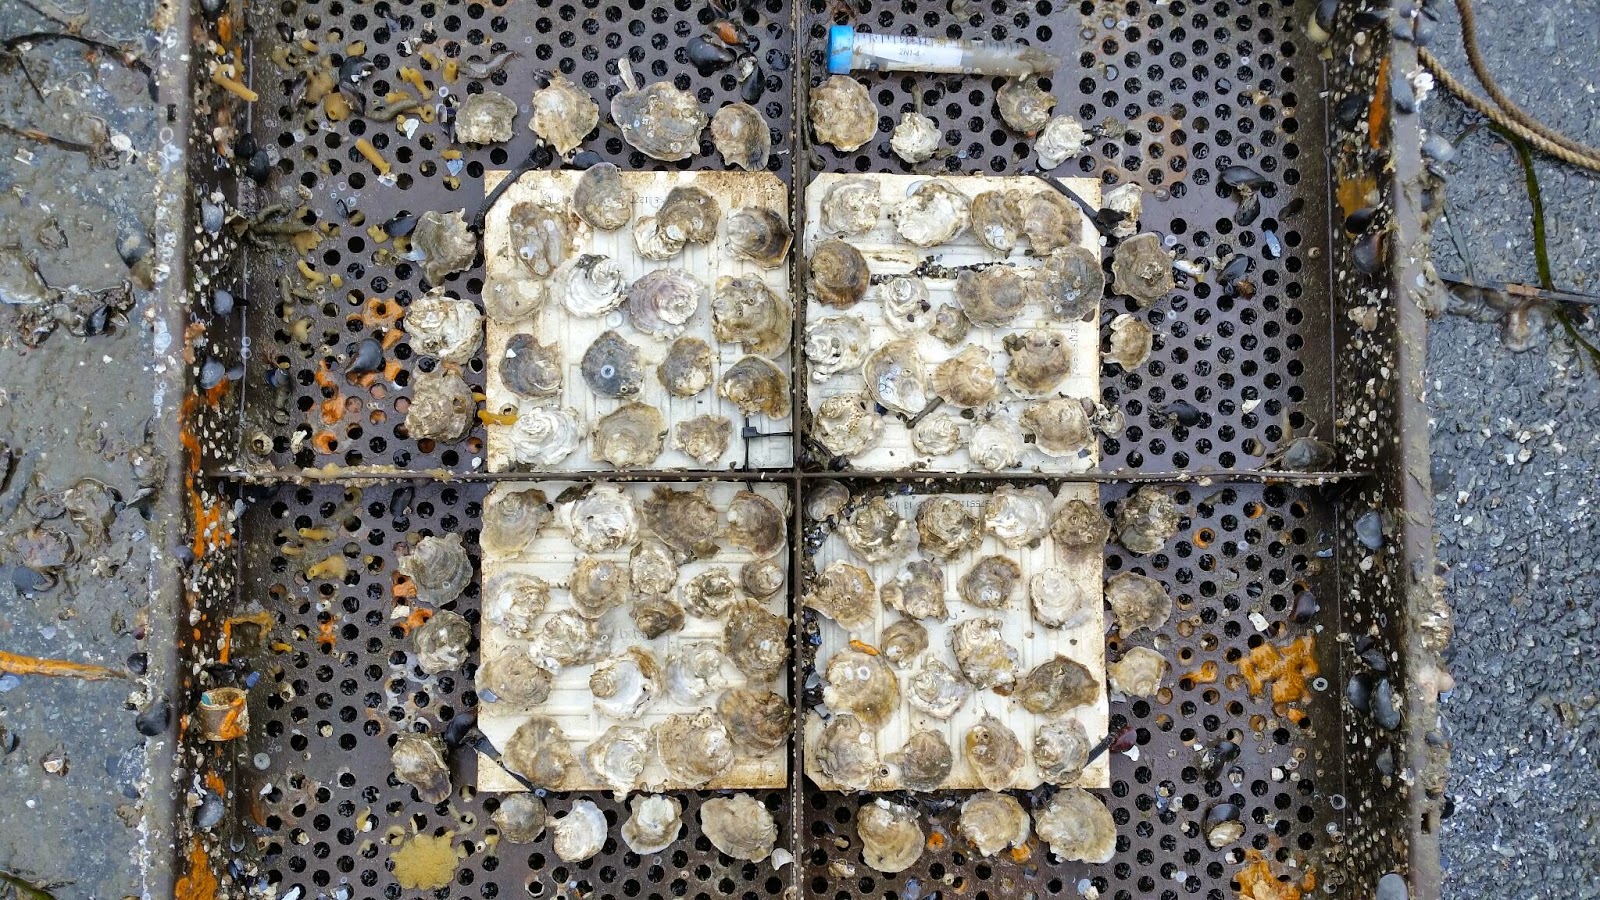
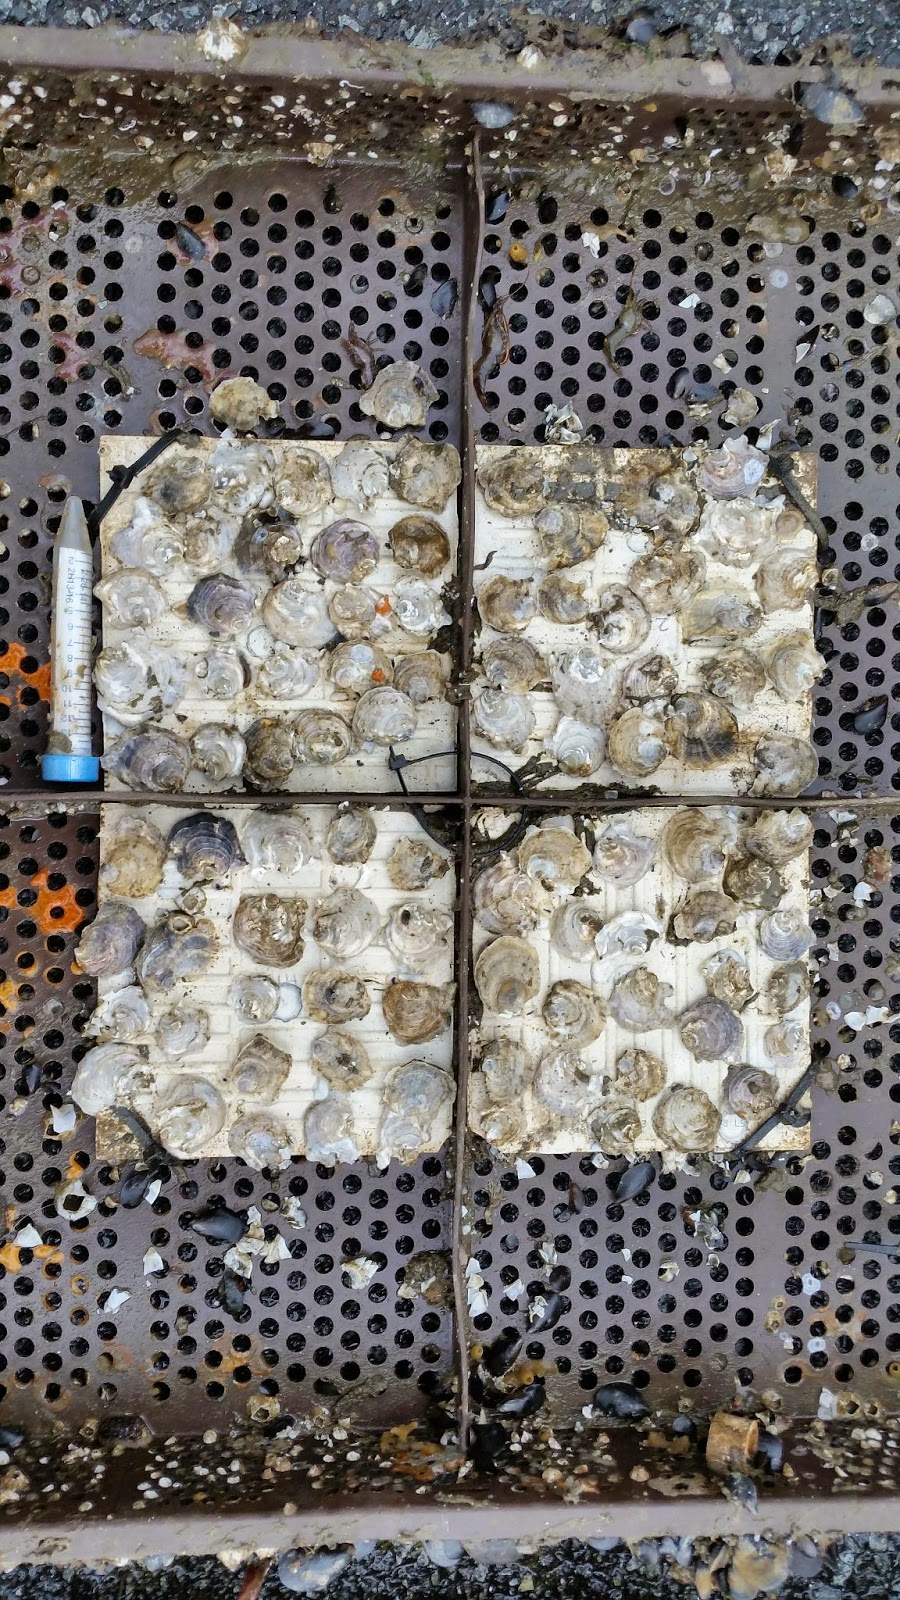
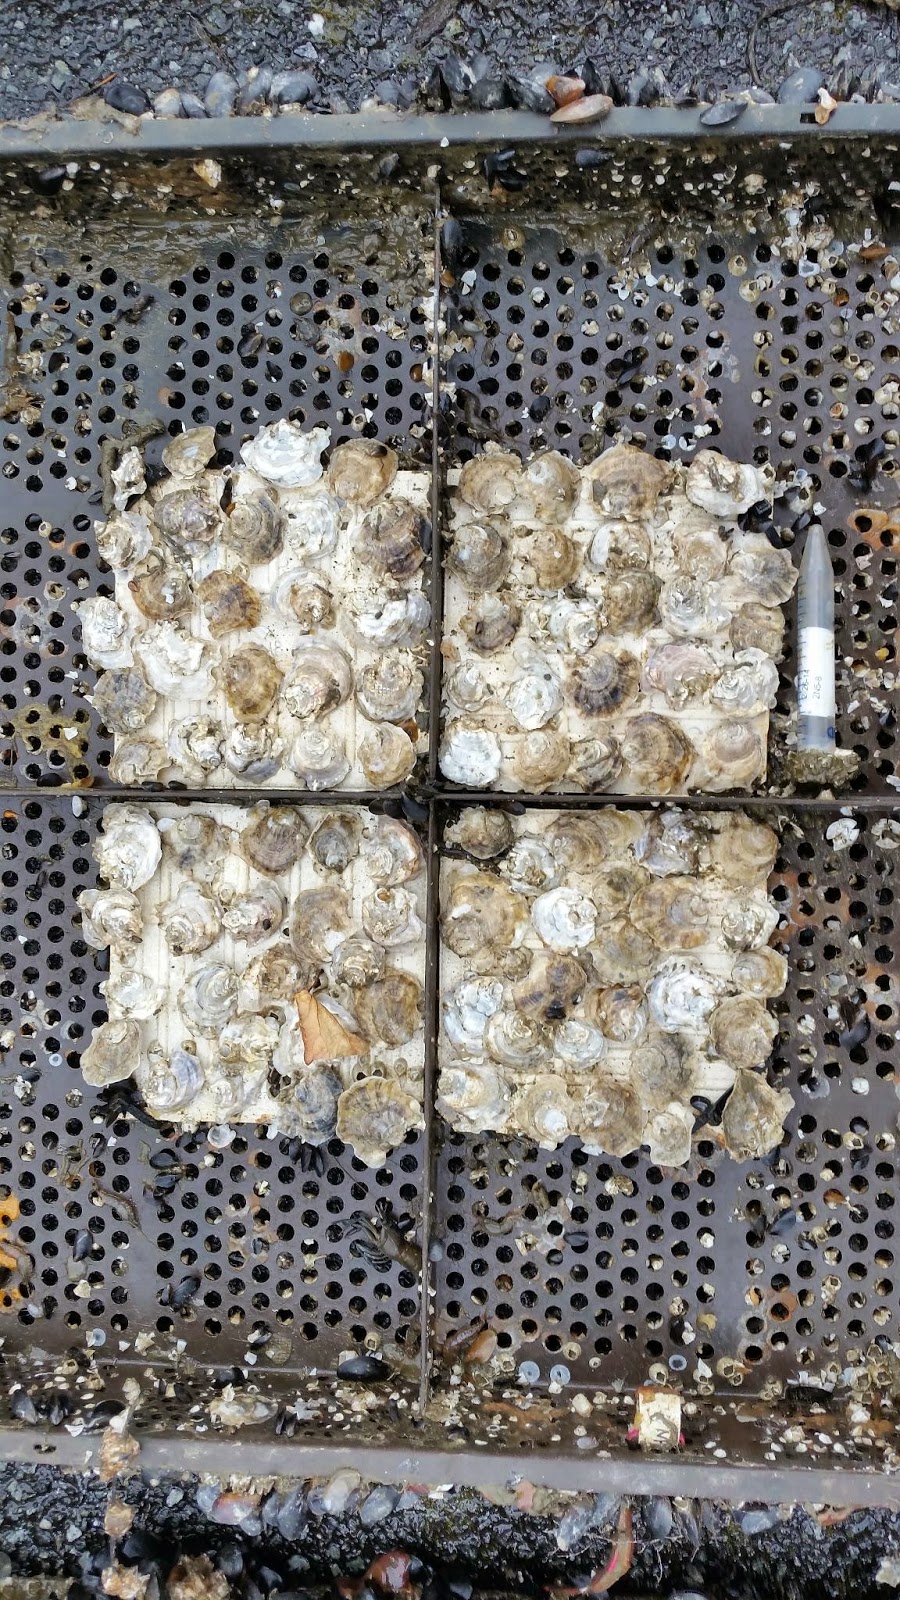
Did a full work up on the trays and switched animals from the trays to cages for the winter. Mortality very low, less than 1% for all trays. Collected 50 oysters from each pop for genetic sampling. Images collected for size analysis.

Numbers as follow

2H9-12
Live.   83
Dead.   0

2S5-8
Live.     99
Dead.    0

2N9-12
Live.     96
Dead.     0

2N13-16
Live.     104
Dead     0

2S1-4
Live.     93
Dead.    0

2H1-4
Live.     88
Dead.    0

2N1-4
Live.      99
Dead.     0

2H5-8
Live.      99
Dead.     2

2S9-12
Live.      91
Dead.     0

2N5-8
Live.      100
Dead.      0

2H13-16
Live.      94
Dead.     0

2S13-16
Live.      94
Dead.     0

Wednesday, October 15, 2014

10 15 2014 Number of Brooders vs Number of Size Class Code

sizeclassvbrood.R
require(TeachingDemos)
## Loading required package: TeachingDemos
require(ggplot2)
## Loading required package: ggplot2
require(scales)
## Loading required package: scales
require(plyr)
## Loading required package: plyr
BRvP<-read.csv('BRvP.csv')
View(BRvP)
numbrood<-BRvP[,c("SizeClass","Pop","NoBrood")]

ggplot()+
  geom_bar(data=BRvP, aes(x=SizeClass, y=NoIndSize, group=Pop,colour=Pop,fill=Pop),
           binwidth=10, stat="identity",position=position_dodge(),alpha=0.3)+
  geom_bar(data=numbrood, aes(x=SizeClass, y=NoBrood, group=Pop,fill=Pop),
           binwidth=10, stat="identity",position=position_dodge())+
  scale_colour_manual(values=c("blue","purple","orange"))+
  scale_fill_manual(values=c("blue","purple","orange"))

plot of chunk unnamed-chunk-1