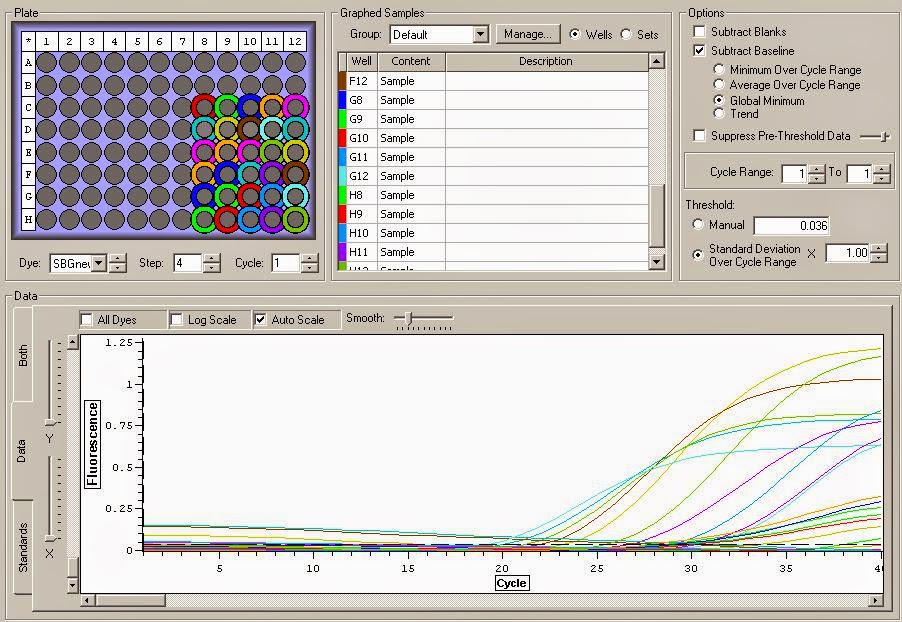
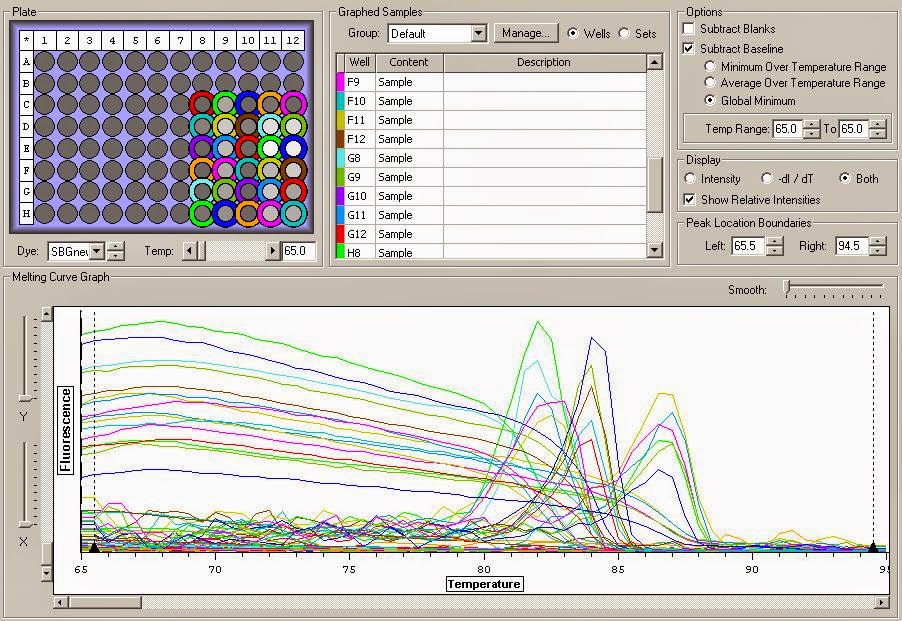
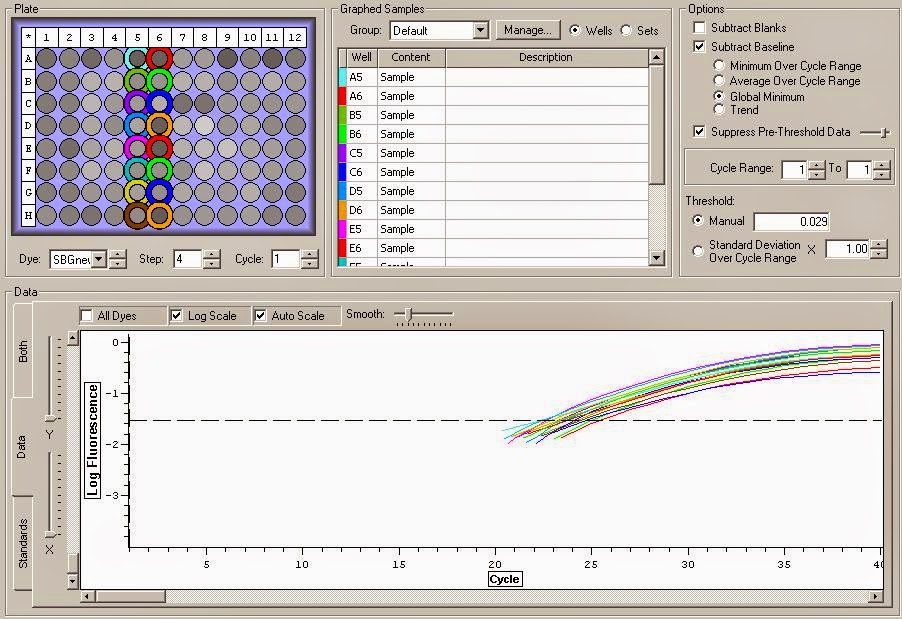
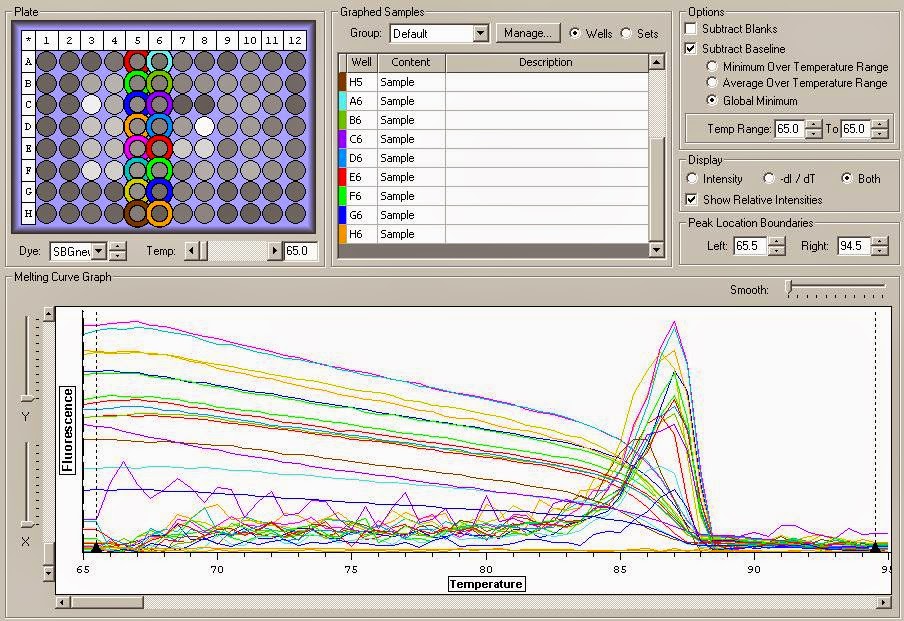
Group 3-4
Amplification:
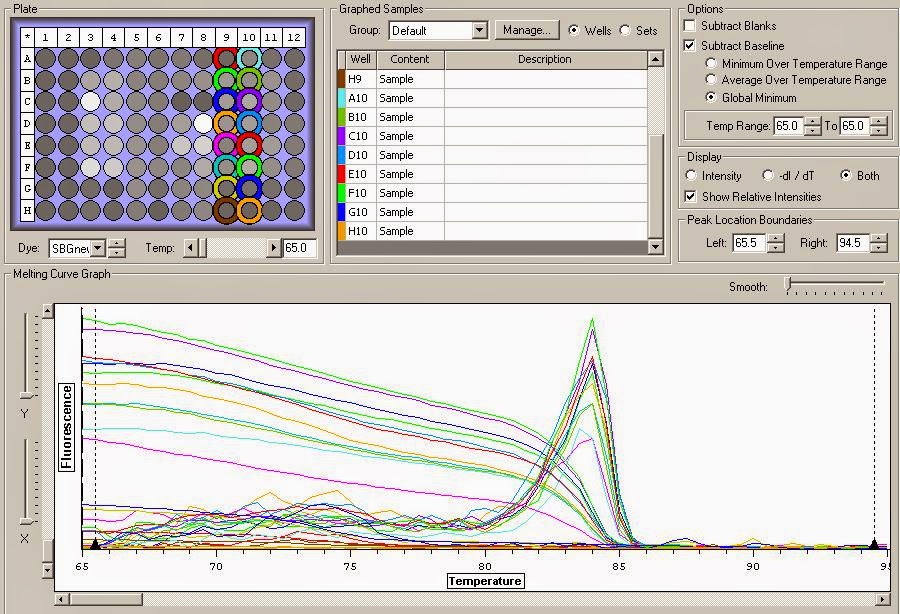
Melt Curve:
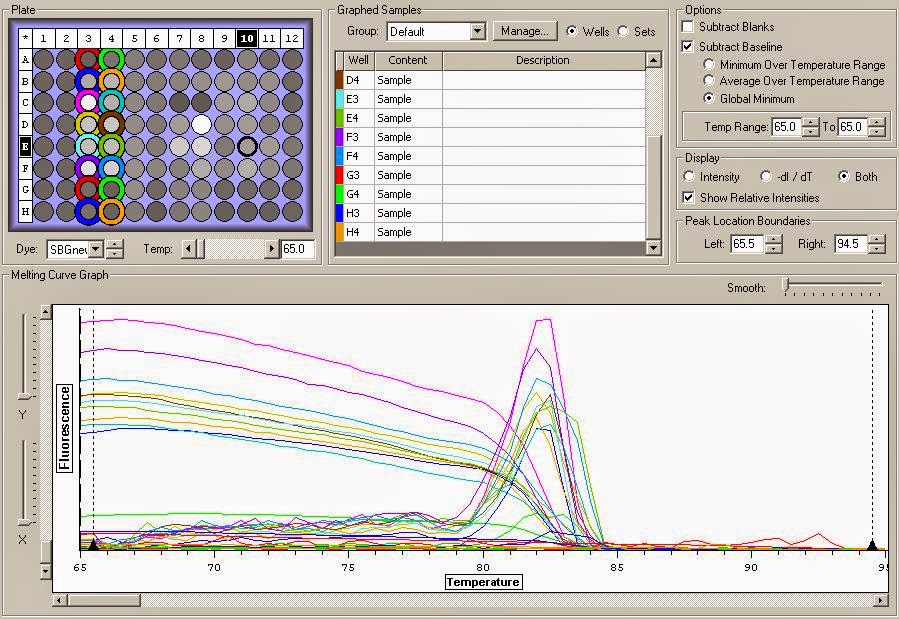
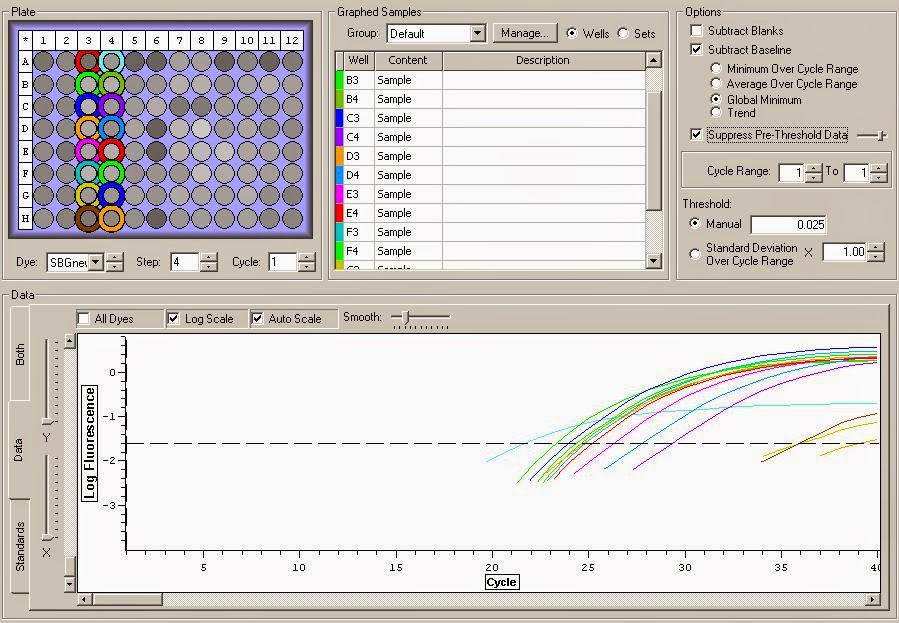
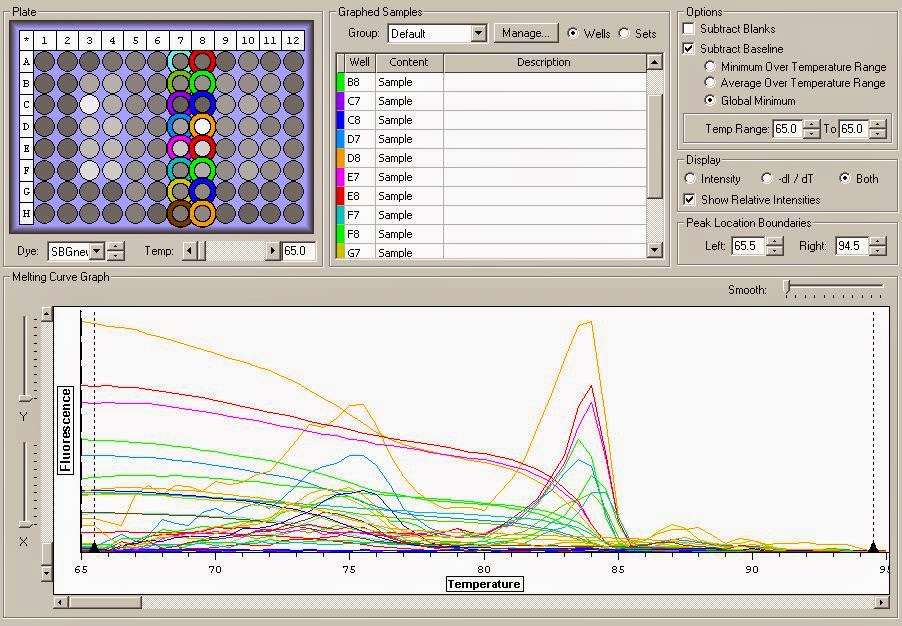
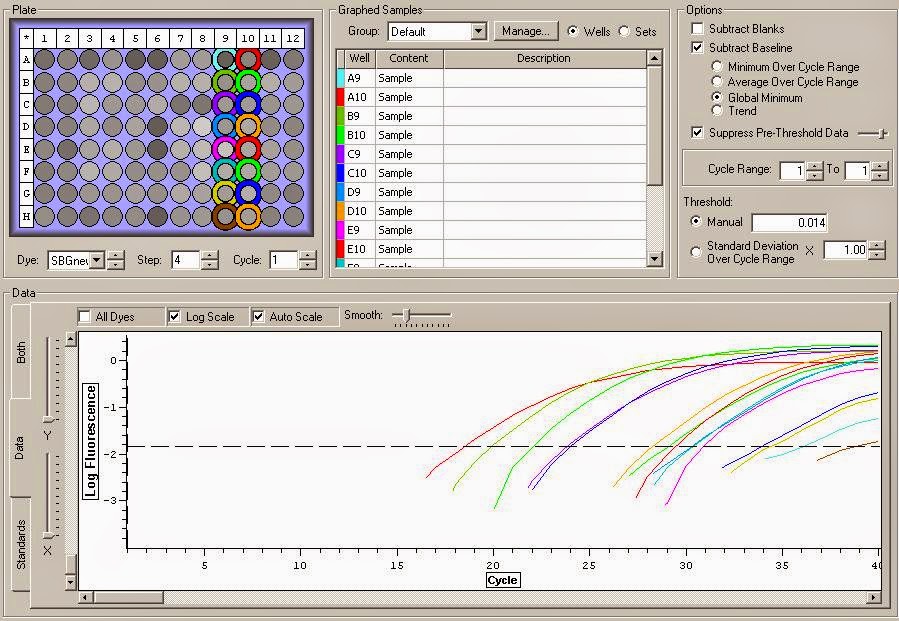
Group 5-6
Amplification:
Amplification:
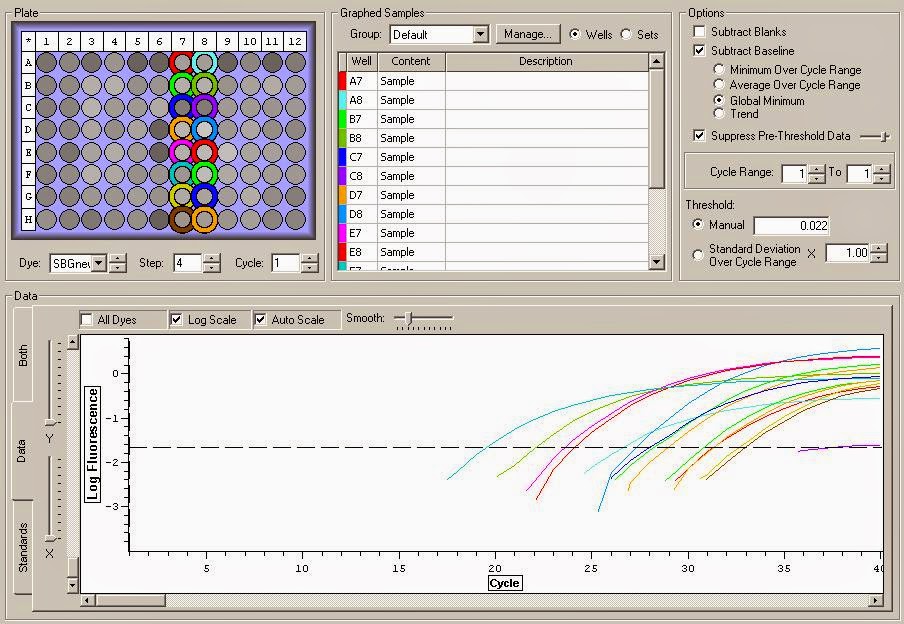
Amplification:
Amplification:

You can also see the data files for the groups here: 3-4, 5-6, 7-8, 9-10, 11-12. The raw data file can be found here.
| Sample ID | Date | ng/ul | A260 | A280 | 260/280 | 260/230 |
| 42715ST1 | 5/8/2015 | 385.82 | 9.646 | 5.076 | 1.9 | 0.94 |
| 42715ST2 | 5/8/2015 | 287.1 | 7.178 | 3.929 | 1.83 | 0.71 |
| 42715ST3 | 5/8/2015 | 267.75 | 6.694 | 3.623 | 1.85 | 0.89 |
| 42715ST4 | 5/8/2015 | 322.48 | 8.062 | 4.324 | 1.86 | 0.77 |
| 42715ST5 | 5/8/2015 | 244.87 | 6.122 | 3.424 | 1.79 | 0.66 |
| 42715HT1 | 5/8/2015 | 172.11 | 4.303 | 2.502 | 1.72 | 0.57 |
| 42715HT2 | 5/8/2015 | 323.01 | 8.075 | 4.359 | 1.85 | 0.75 |
| 42715HT3 | 5/8/2015 | 141.12 | 3.528 | 1.808 | 1.95 | 1.5 |
| 42715HT4 | 5/8/2015 | 177.02 | 4.425 | 2.597 | 1.7 | 0.59 |
| 42715HT5 | 5/8/2015 | 294.26 | 7.357 | 4.019 | 1.83 | 0.72 |
| 42815SM1 | 5/8/2015 | 110.13 | 2.753 | 1.482 | 1.86 | 0.96 |
| 42815SM2 | 5/8/2015 | 43.08 | 1.077 | 0.624 | 1.73 | 0.57 |
| 42815SM3 | 5/8/2015 | 38.87 | 0.972 | 0.638 | 1.52 | 0.42 |
| 42815SM4 | 5/8/2015 | 112.83 | 2.821 | 1.738 | 1.62 | 0.42 |
| 42815SM5 | 5/8/2015 | 67.16 | 1.679 | 1.047 | 1.6 | 0.36 |
| 42815HM1 | 5/8/2015 | 52.7 | 1.318 | 0.758 | 1.74 | 0.75 |
| 42815HM2 | 5/8/2015 | 72.28 | 1.807 | 1.202 | 1.5 | 0.35 |
| 42815HM3 | 5/8/2015 | 59.05 | 1.476 | 1.043 | 1.42 | 0.26 |
| 42815HM4 | 5/8/2015 | 82.5 | 2.062 | 1.27 | 1.62 | 0.34 |
| 42815HM5 | 5/8/2015 | 128.42 | 3.21 | 1.911 | 1.68 | 0.4 |
| Sample ID | ng/ul | ul RNA for 690 ng | ul h20 for 17.90 | 1:10 primer ul | total volume |
| 42715ST1 | 385.82 | 1.79 | 13.01 | 3.45 | 18.25 |
| 42715ST2 | 287.1 | 2.40 | 12.39 | 3.45 | 18.25 |
| 42715ST3 | 267.75 | 2.58 | 12.22 | 3.45 | 18.25 |
| 42715ST4 | 322.48 | 2.14 | 12.66 | 3.45 | 18.25 |
| 42715ST5 | 244.87 | 2.82 | 11.98 | 3.45 | 18.25 |
| 42715HT1 | 172.11 | 4.01 | 10.79 | 3.45 | 18.25 |
| 42715HT2 | 323.01 | 2.14 | 12.66 | 3.45 | 18.25 |
| 42715HT3 | 141.12 | 4.89 | 9.91 | 3.45 | 18.25 |
| 42715HT4 | 177.02 | 3.90 | 10.90 | 3.45 | 18.25 |
| 42715HT5 | 294.26 | 2.34 | 12.45 | 3.45 | 18.25 |
| 42815SM1 | 110.13 | 6.27 | 8.53 | 3.45 | 18.25 |
| 42815SM2 | 43.08 | 16.02 | 0.00 | 3.45 | 19.47 |
| 42815SM3 | 38.87 | 17.75 | 0.00 | 3.45 | 21.20 |
| 42815SM4 | 112.83 | 6.12 | 8.68 | 3.45 | 18.25 |
| 42815SM5 | 67.16 | 10.27 | 4.52 | 3.45 | 18.25 |
| 42815HM1 | 52.7 | 13.09 | 1.70 | 3.45 | 18.25 |
| 42815HM2 | 72.28 | 9.55 | 5.25 | 3.45 | 18.25 |
| 42815HM3 | 59.05 | 11.69 | 3.11 | 3.45 | 18.25 |
| 42815HM4 | 82.5 | 8.36 | 6.43 | 3.45 | 18.25 |
| 42815HM5 | 128.42 | 5.37 | 9.42 | 3.45 | 18.25 |
| Reagents | Volume ul | Reactions X22 |
| M-MLV RT Buffer | 5 | 110 |
| 10 mM dNTPs | 1.25 | 27.5 |
| M-MLV RT | 0.345 | 7.59 |
| H20 | 0.155 | 3.41 |
| Total Volume | 6.75 | 148.5 |
| Amplify | 42 C | 1 hr |
| Inactivate | 95 C | 3 min |
| Volume | Reactions X6 | |
| Ssofast Evagreen MM | 10 | 60 |
| FWD Primer | 0.5 | 3 |
| REV Primer | 0.5 | 3 |
| Nuclease Free H2O | 8 | 48 |
| 8 | 9 | 10 | 11 | 12 |
| SD | GS | CS | HSP | ACT |
| C- | C- | C- | C- | C- |
| C+ | C+ | C+ | C+ | C+ |
| 42715ST1 | 42715HT1 | 42715SM1 | 42715HM1 | 42715ST5 |
| 42715ST2 | 42715HT2 | 42715SM2 | 42715HM2 | 42715HT5 |
| 42715ST3 | 42715HT3 | 42715SM3 | 42715HM3 | 42715SM5 |
| 42715ST4 | 42715HT4 | 42715SM4 | 42715HM4 | 42715HM5 |
| Sybr New Plate+Sybr cDNA 55 melt 2 | ||
| Step | Temperature | Time |
| Initiation | 95 C | 10 min |
| Elongation | 95 C | 15 sec |
| 55 C | 15 sec | |
| Read | ||
| 72 C | 15 sec | |
| Read | ||
| Repeat Elongation 40 times | ||
| Termination | 95 C | 1 min |
| 55 C | 1 sec | |
| Melt Curve Manual ramp 0.2C per sec Read 0.5 C | 65 - 95 C | 30 sec |
| 21 C | 10 min | |
| End |