Primer:
| 1630 | TLR2.1_FWD | ACAAAGATTCCACCCGGCAA | JH | 5/21/2015 | 20 | 55 | O.lurida | Toll-like receptor 2 type-1 | Q9DD78 | |
| 1629 | TLR2.1_REV | ACACCAACGACAGGAAGTGG | JH | 5/21/2015 | 20 | 55 | O.lurida | Toll-like receptor 2 type-1 | Q9DD78 |
Reagent Table:
| Volume | Reactions X58 | |
| Ssofast Evagreen MM | 10 | 580 |
| FWD Primer | 0.5 | 29 |
| REV Primer | 0.5 | 29 |
| Nuclease Free H2O | 8 | 464 |
| cDNA | 1 |
- Added reagents from greatest to least volume
- Vortexed
- Centrifuged briefly
- Pipetted 19 ul Master Mix to each tube
- Pipetted appropriate cDNA sample to each tube
- Centrifuged plate at 2000 rpm for 1 minute
- Ran Program Below
| Step | Temperature | Time |
| Initiation | 95 C | 10 min |
| Elongation | 95 C | 30 sec |
| 60 C | 1 min | |
| Read | ||
| 72 C | 30 sec | |
| Read | ||
| Repeat Elongation 39 times | ||
| Termination | 95 C | 1 min |
| 55 C | 1 sec | |
| Melt Curve Manual ramp 0.2C per sec Read 0.5 C | 55 - 95 C | 30 sec |
| 21 C | 10 min | |
| End |
Plate Layout:
| 1 | 2 | 3 | 4 | 5 | 6 | 7 |
| DNased 42215 HC1 | DNased 42215 NC1 | DNased 42215 SC1 | DNased 42215 HT1 1 | DNased 42215 NT1 1 | DNased 42215 ST1 1 | NTC |
| DNased 42215 HC2 | DNased 42215 NC2 | DNased 42215 SC2 | DNased 42215 HT1 2 | DNased 42215 NT1 2 | DNased 42215 ST1 2 | NTC |
| DNased 42215 HC3 | DNased 42215 NC3 | DNased 42215 SC3 | DNased 42215 HT1 3 | DNased 42215 NT1 3 | DNased 42215 ST1 3 | NTC |
| DNased 42215 HC4 | DNased 42215 NC4 | DNased 42215 SC4 | DNased 42215 HT1 4 | DNased 42215 NT1 4 | DNased 42215 ST1 4 | NTC |
| DNased 42215 HC5 | DNased 42215 NC5 | DNased 42215 SC5 | DNased 42215 HT1 5 | DNased 42215 NT1 5 | DNased 42215 ST1 5 | |
| DNased 42215 HC6 | DNased 42215 NC6 | DNased 42215 SC6 | DNased 42215 HT1 6 | DNased 42215 NT1 6 | DNased 42215 ST1 6 | |
| DNased 42215 HC7 | DNased 42215 NC7 | DNased 42215 SC7 | DNased 42215 HT1 7 | DNased 42215 NT1 7 | DNased 42215 ST1 7 | |
| DNased 42215 HC8 | DNased 42215 NC8 | DNased 42215 SC8 | DNased 42215 HT1 8 | DNased 42215 NT1 8 | DNased 42215 ST1 8 |
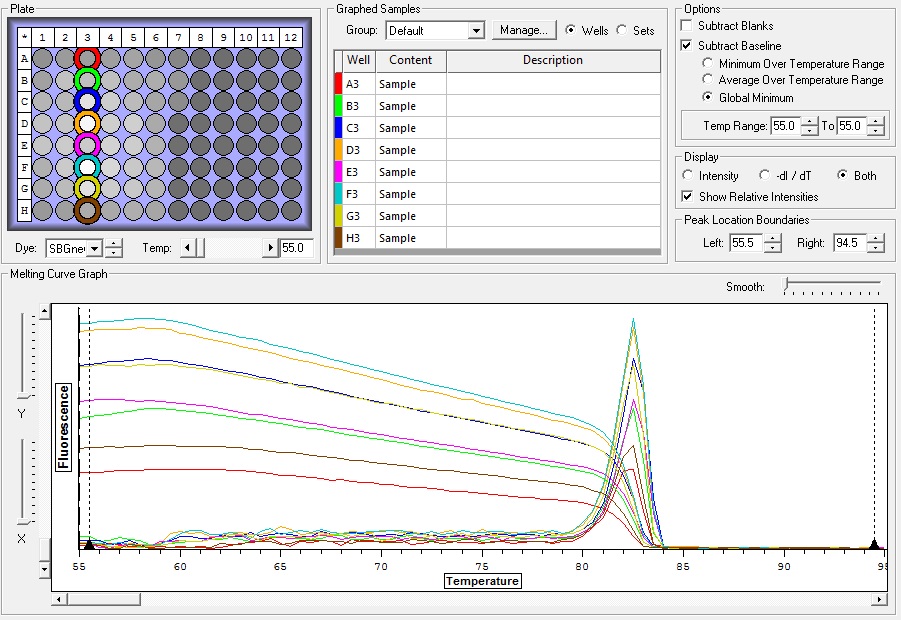
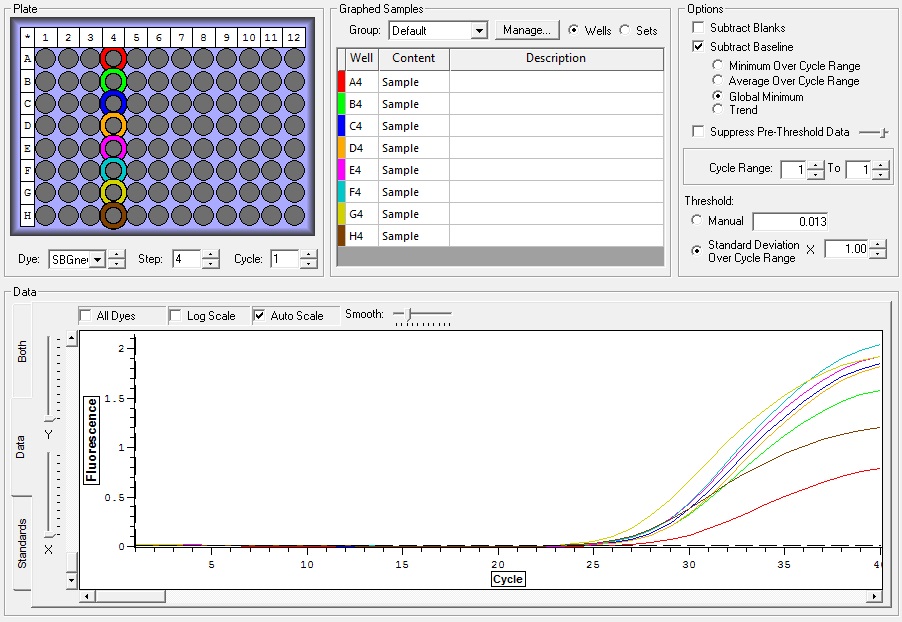
Results:
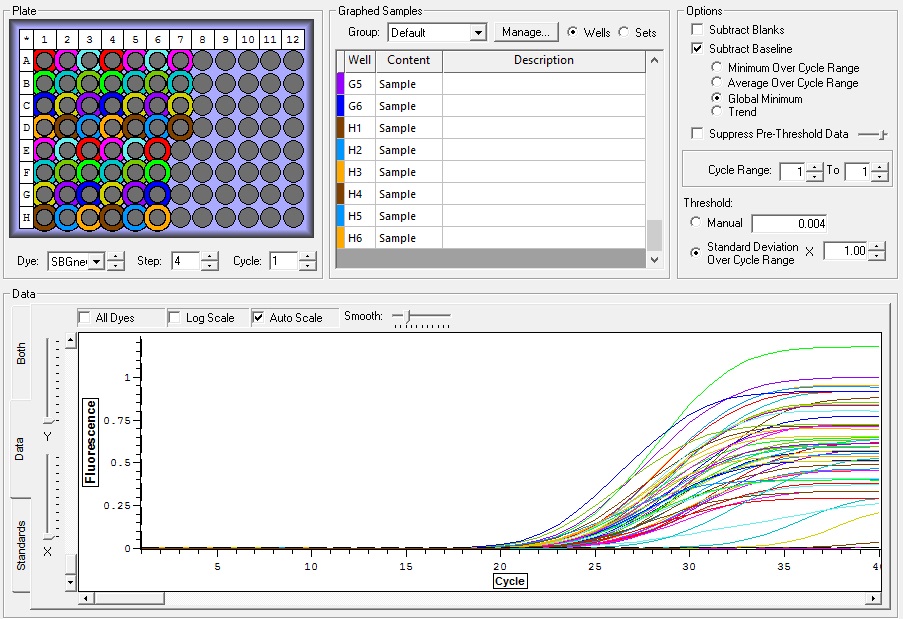
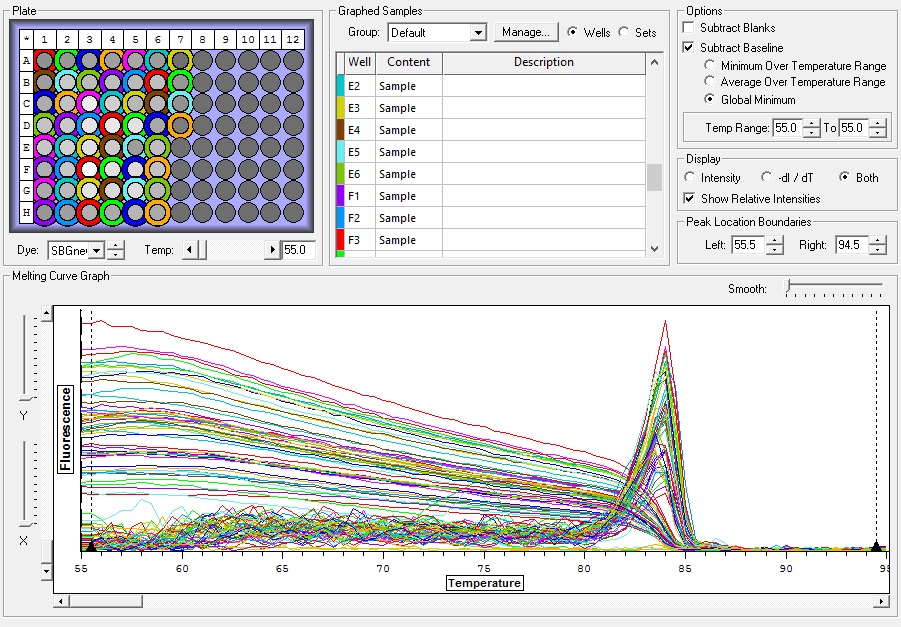
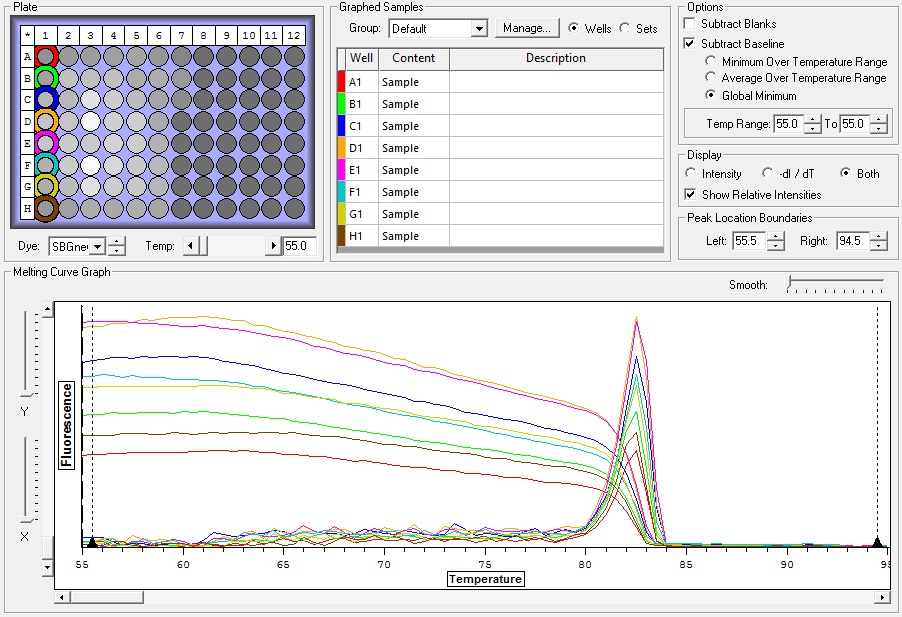
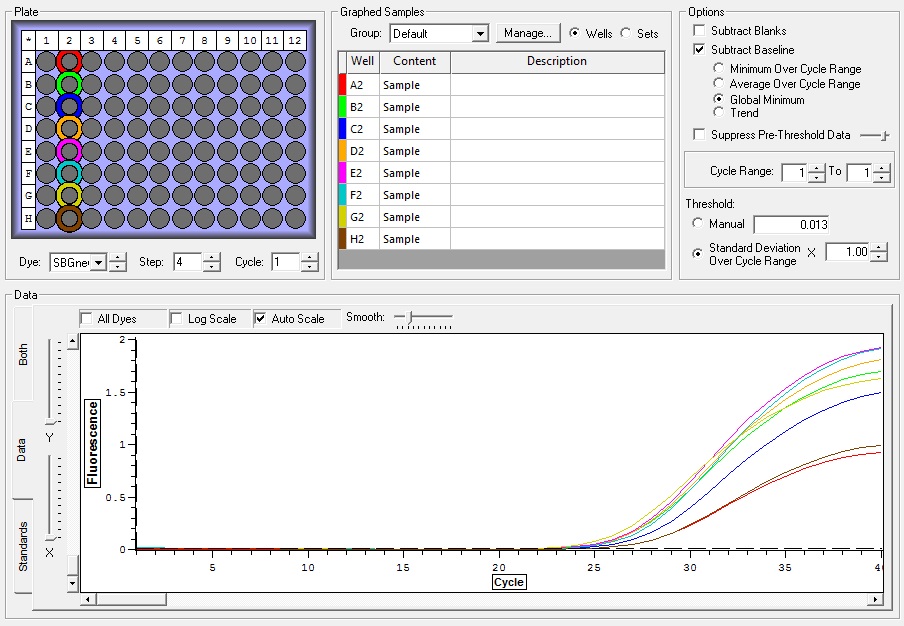
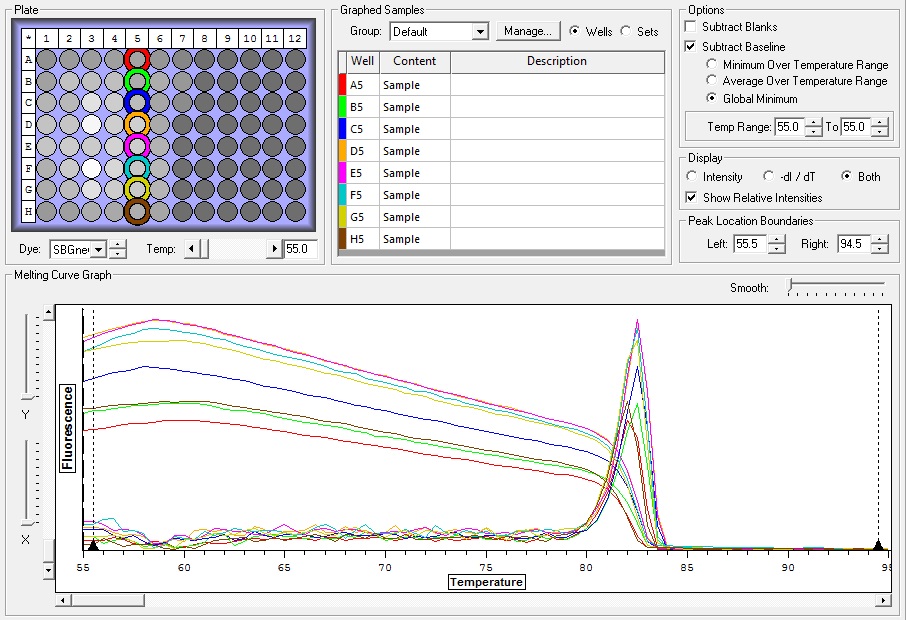
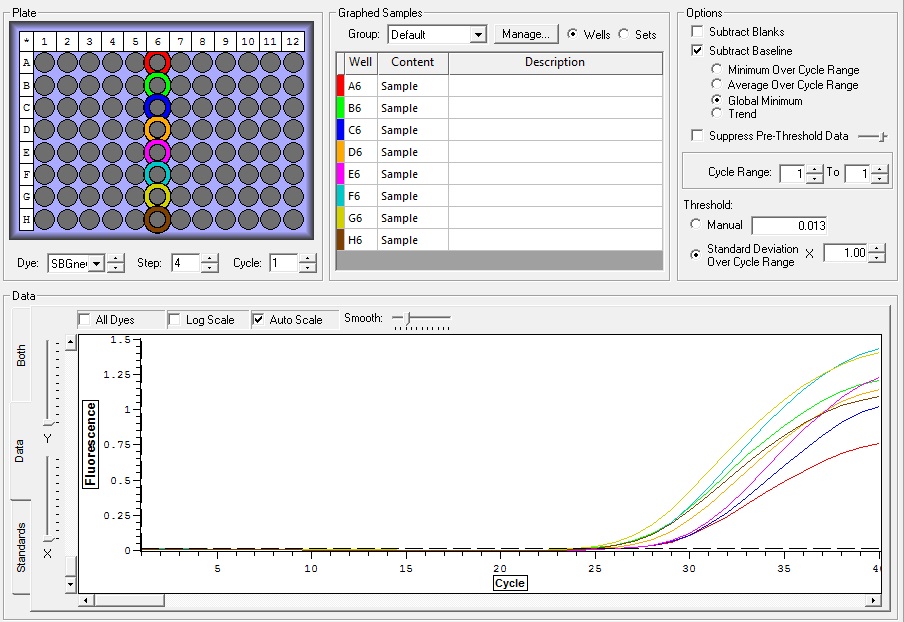
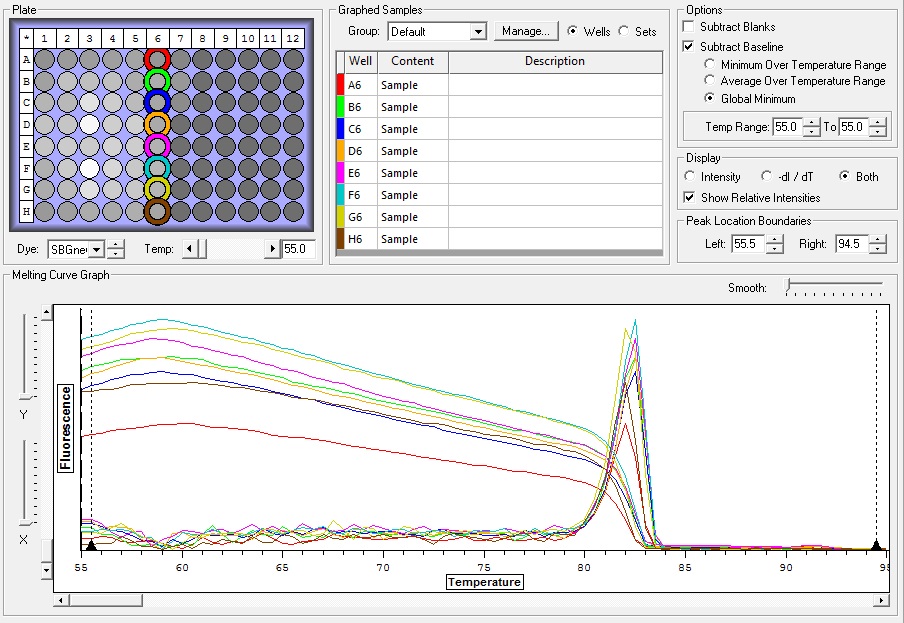
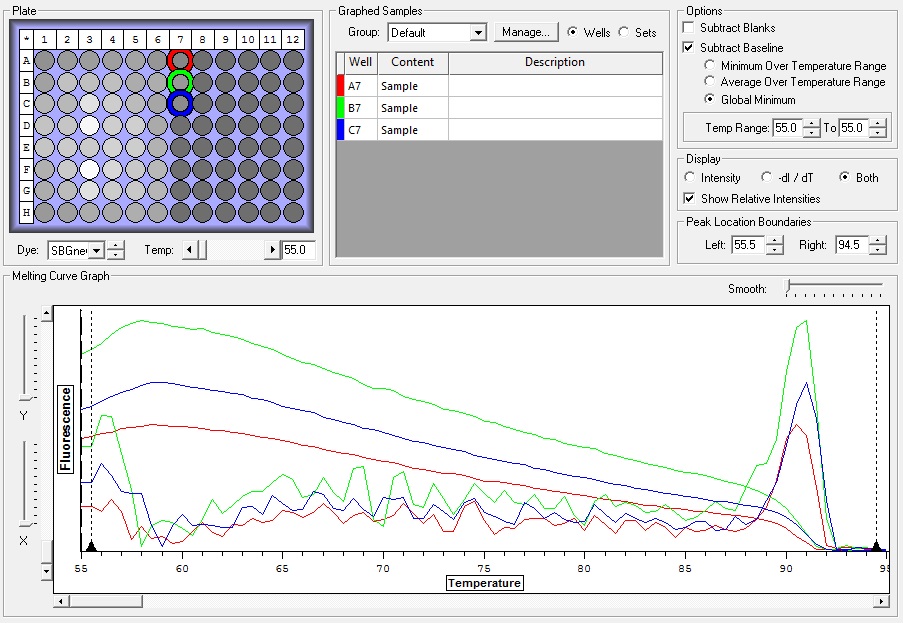
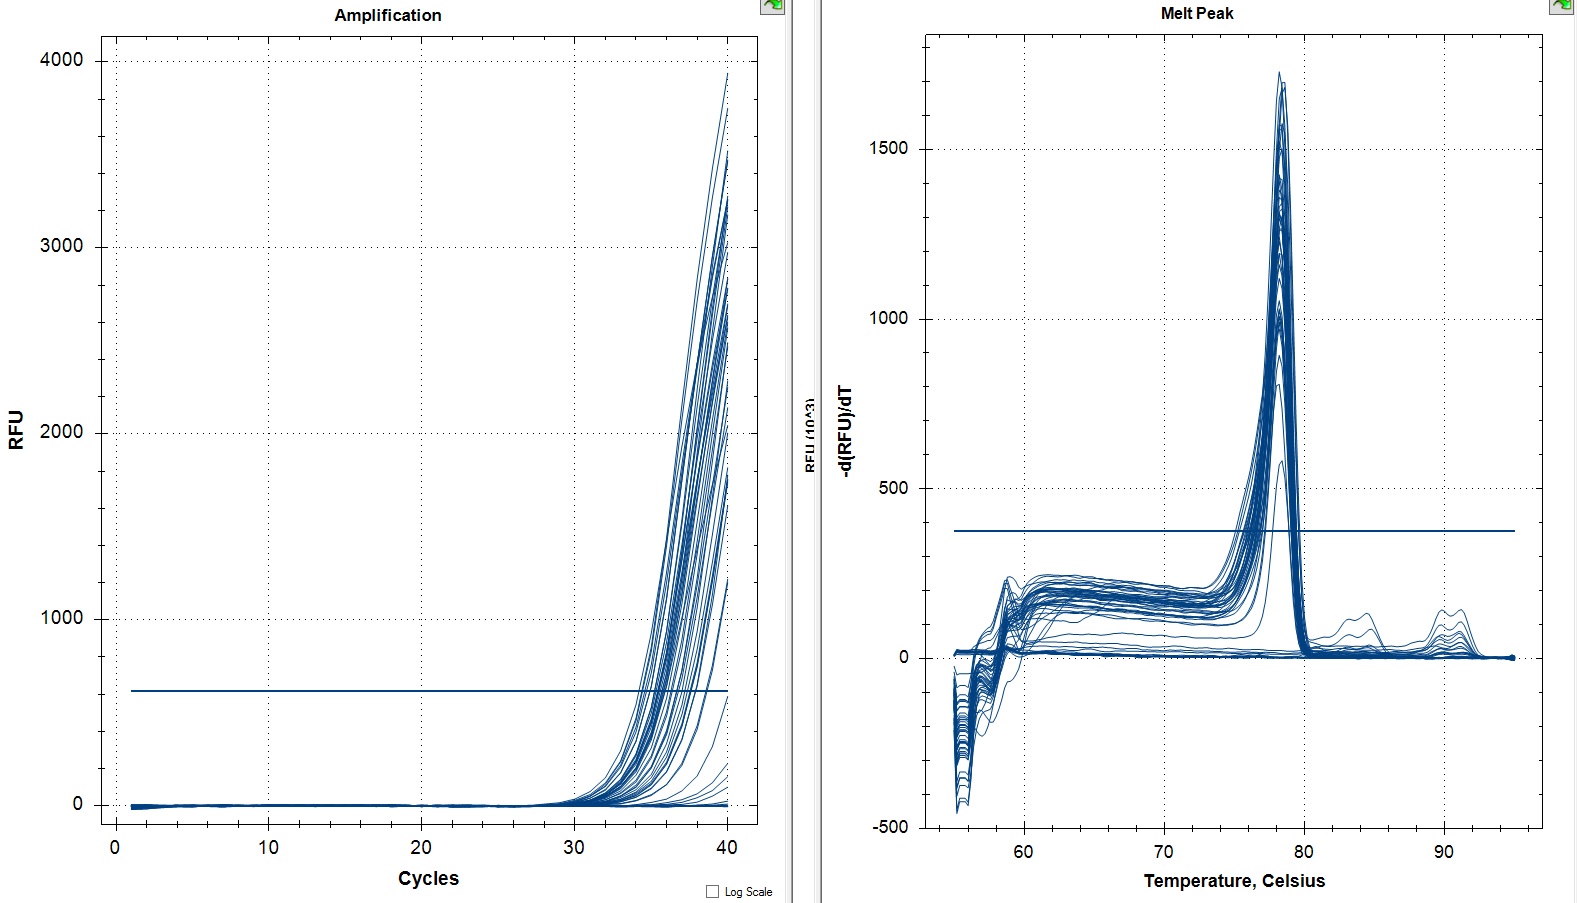
All Samples
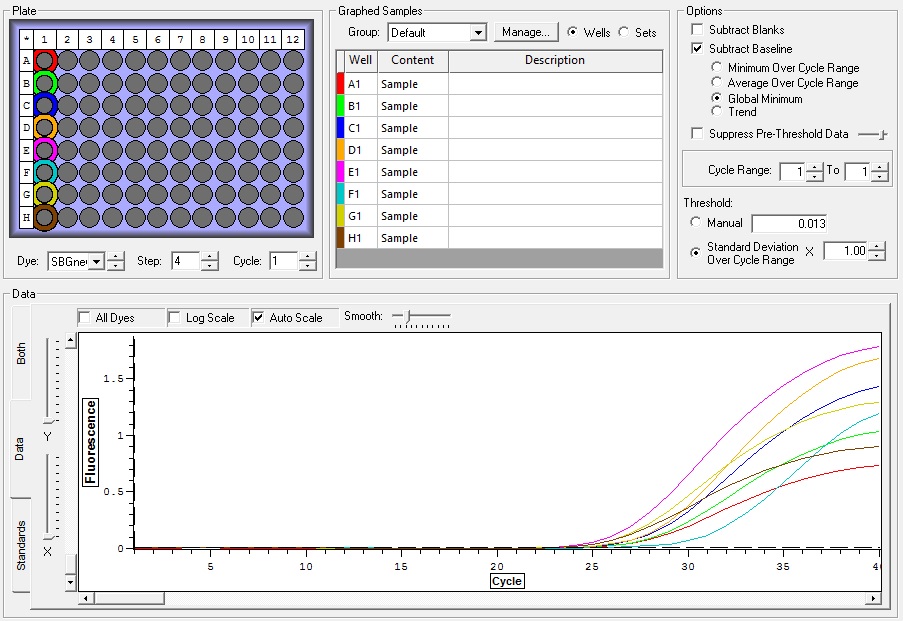
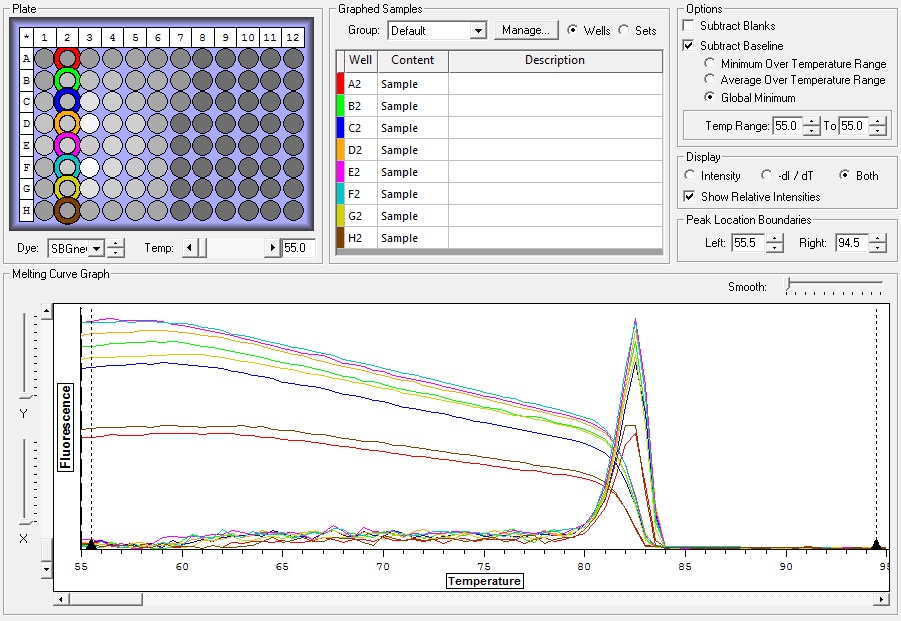
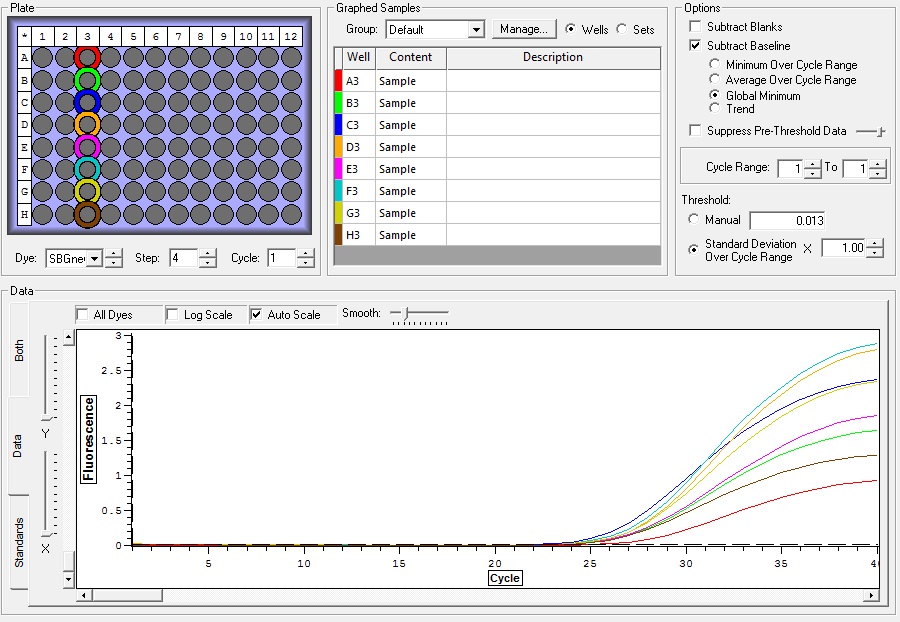
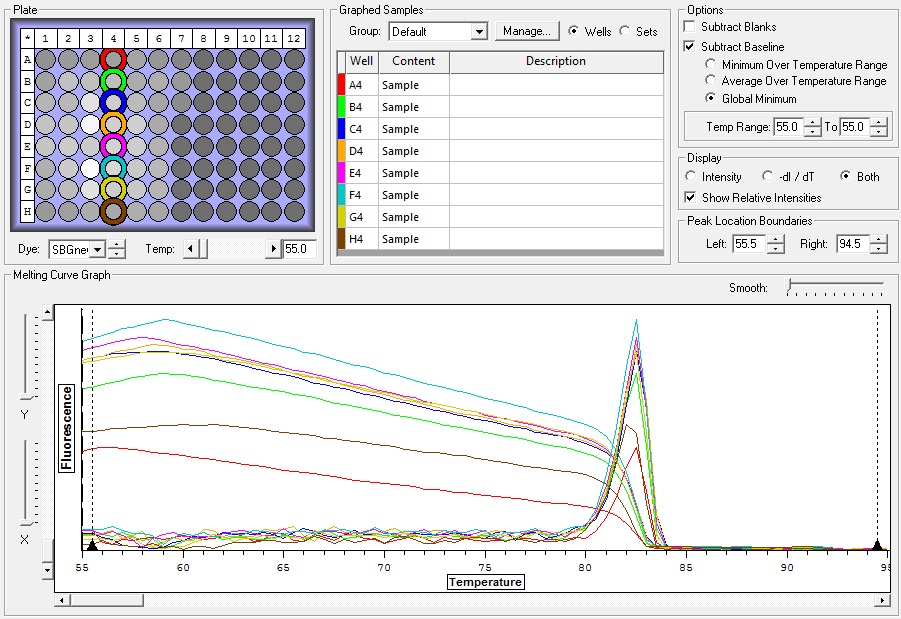
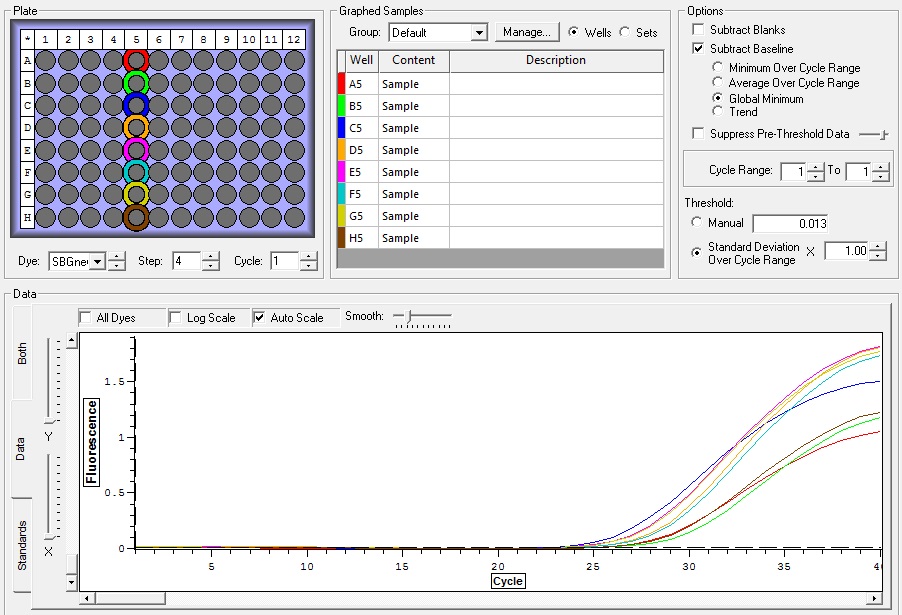
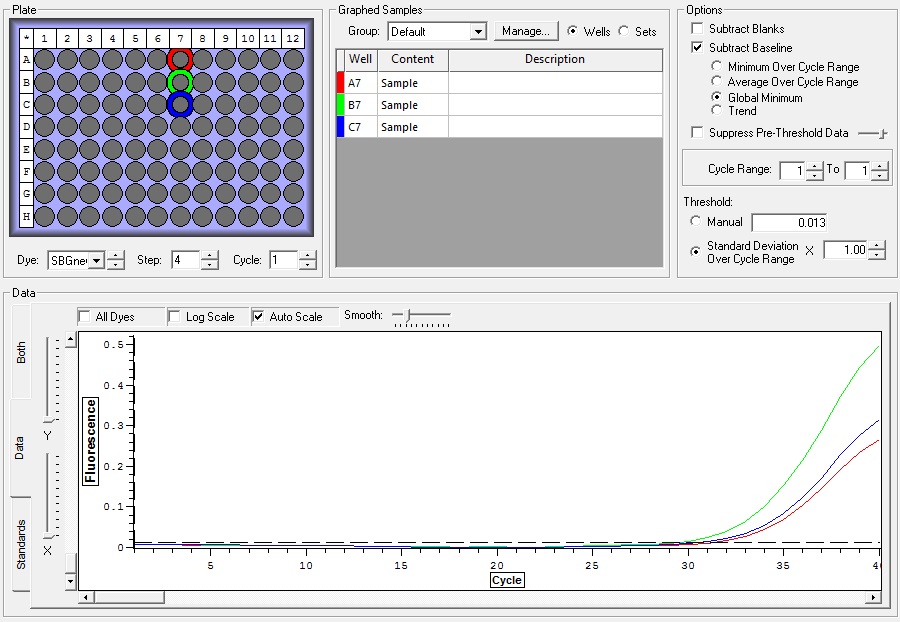
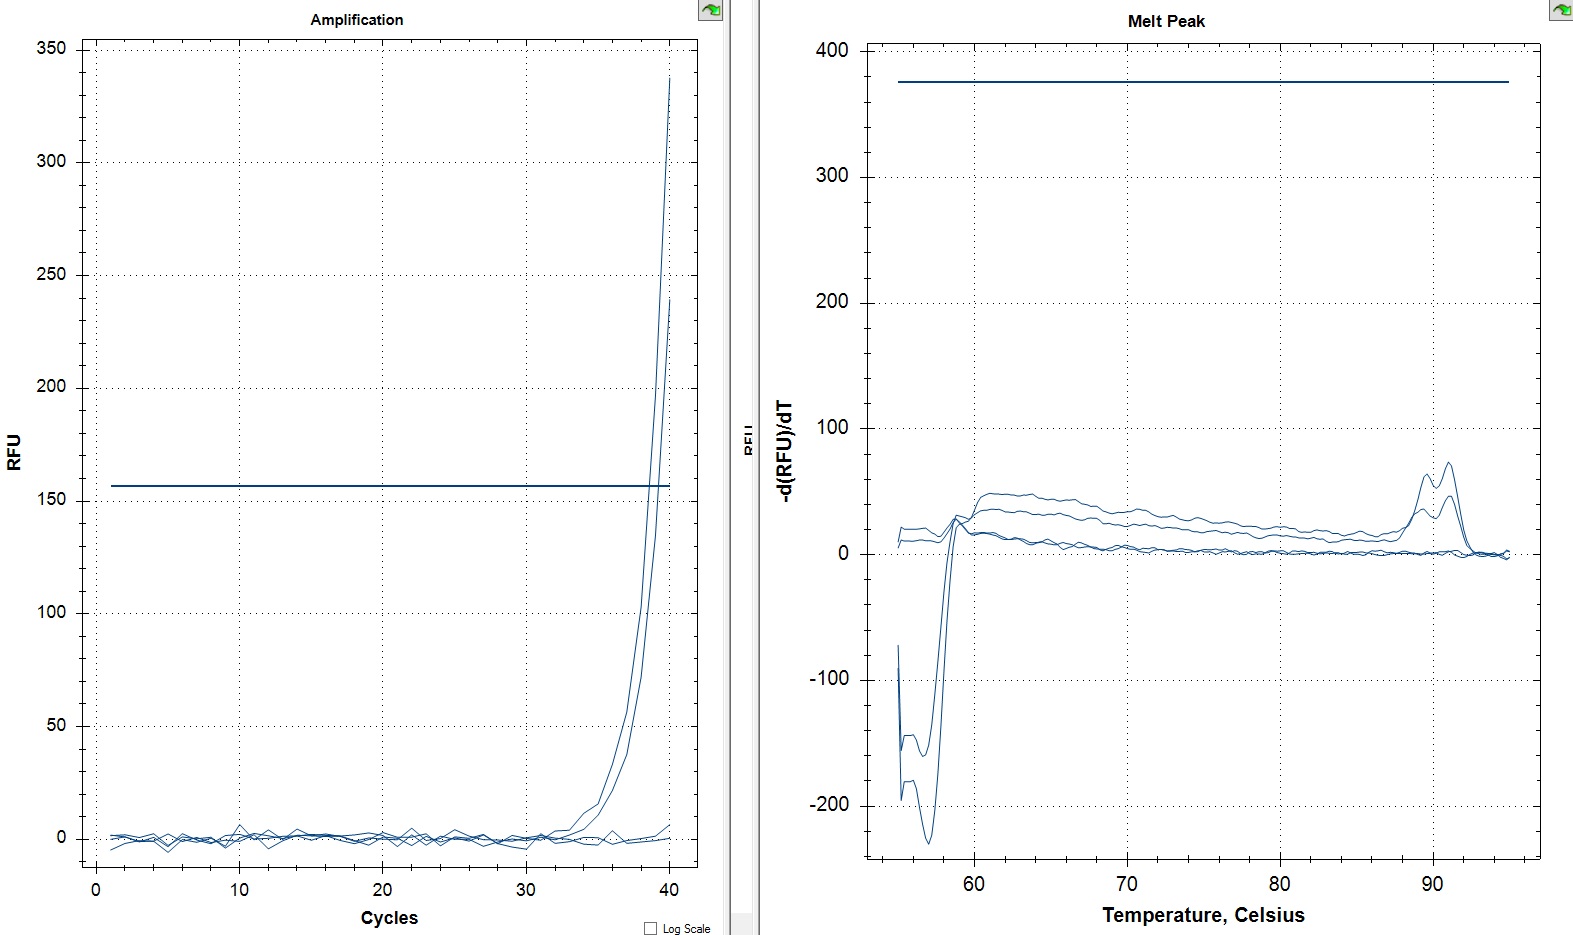
NTCs
So the graph doesn't really do justice for the results. There is amplification in a majority of samples but interestingly only about half of the Dabob population shows expression of this allele. The other half show absolutely no expression. There are a few individuals which show a very low expression of this allele but others show some of the highest expression. Overall this is pretty confusing and may be indicative that the Dabob population is more heterogeneous for this allele than the other populations. After running this qPCR, I ran another Actin qPCR using the friedman machine to create a normalizing standard which I will talk about in my next post.
You can view the raw data here.
You can view the raw data here.