Showing posts with label qPCR. Show all posts

Thursday, May 7, 2015

5 6 2015 qPCR Primer Dimer check

Yesterday I ran another qPCR on both sets of isolated RNA to determine whether the samples were truly contaminated with gDNA or if they were producing primer dimers. This required that we look at the melt curve to determine the size of the products being created.

The qPCR reagent table:
VolumeReactions X12
Ssofast Evagreen MM 10280
FWD Primer0.514
REV Primer0.514
Nuclease Free H2O8.5238
RNA0.5


For the qPCR I used Actin primers and a positive control from Fidalgo seed oysters extracted on 3/23/2015 with a concentration of 167.3 ng/ul. My no template control contained no DNA as to show there was no contamination in the Master Mix.

qPCR protocol:

1. Added each from greatest volume to least to make the master mix. 
2. Pipetted 19.5 ul master mix into each well of a qPCR partial plate
3. Added 0.5 ul sample to each tube

Table Layout.

9101112
C-C+C-C+
42715HM142715SM142715HT142715ST1
42715HM242715SM242715HT242715ST2
42715HM342715SM342715HT342715ST3
42715HM442715SM442715HT442715ST4
42715HM542715SM542715HT542715ST5

I ran the following program:

Sybr New Plate+Sybr cDNA 55 melt 2
StepTemperatureTime
Initiation95 C10 min
Elongation95 C15 sec
55 C15 sec
Read
72 C15 sec
Read
Repeat Elongation 40 times
Termination95 C1 min
55 C1 sec
Melt Curve Manual ramp 0.2C per sec Read 0.5 C65 - 95 C30 sec
21 C10 min
End
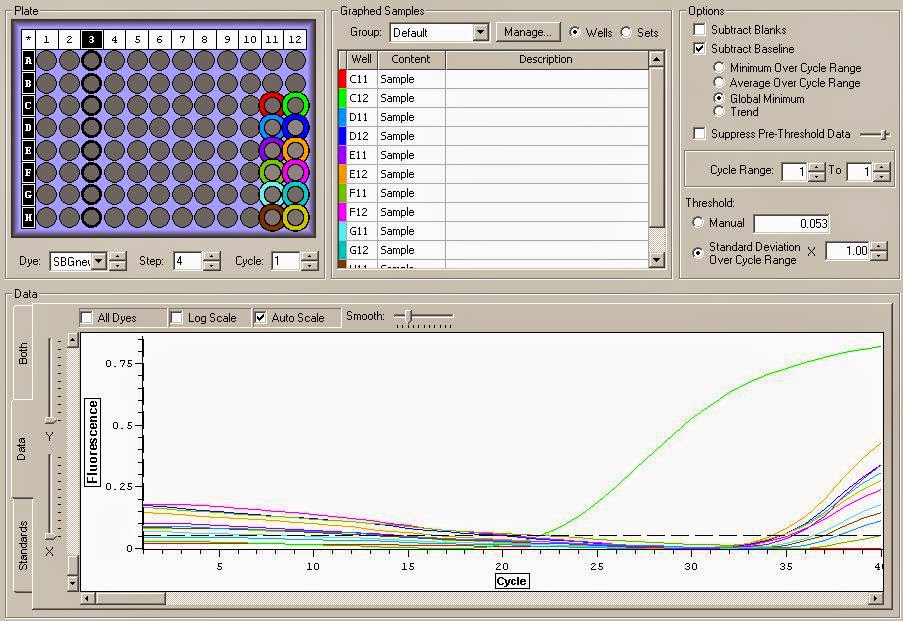
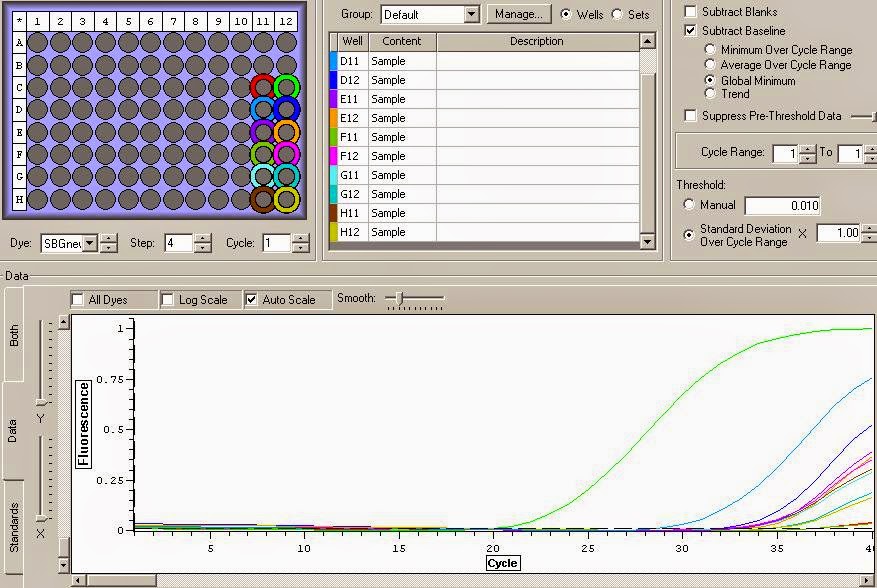
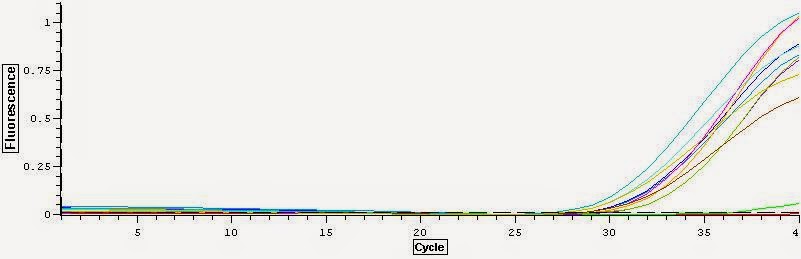
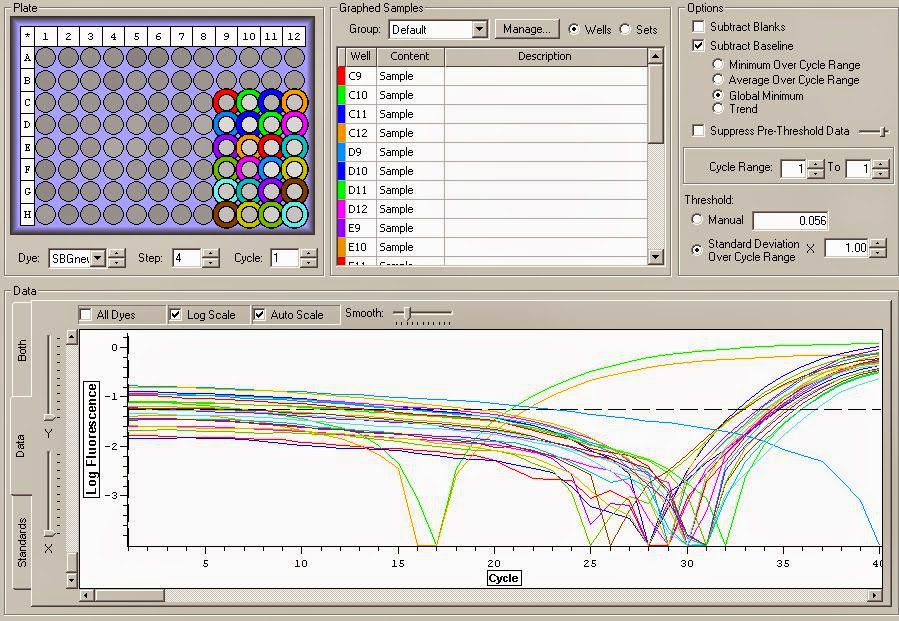
You can see the amplification curves below:

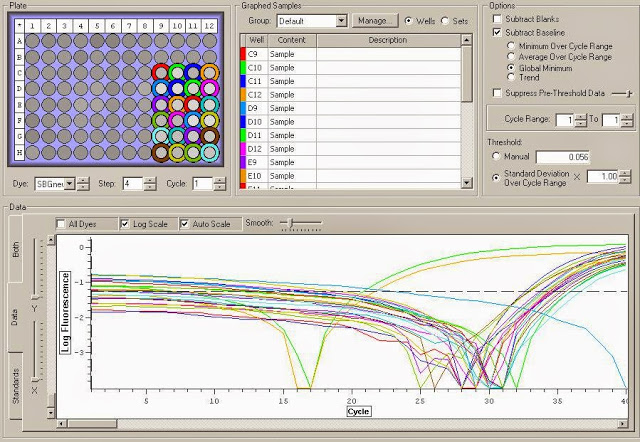
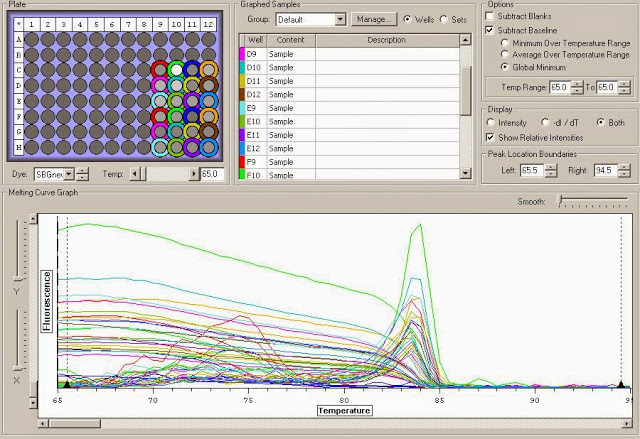
You can see the Melt curve below:

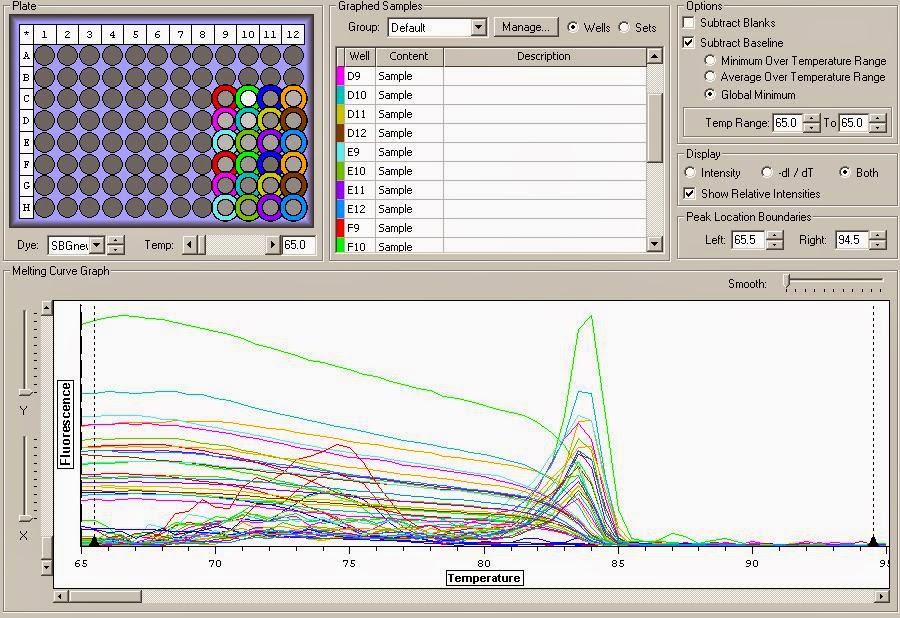
It appears that there is definite gDNA contamination in the samples which is a shame. To remedy this I will be running another round of DNase treatment on them today. I'll check them with another qPCR tonight. You can view the raw qPCR file here


Tuesday, May 5, 2015

5 5 2015 310 Heat Shock RNA Isolation / qPCR

Today I process the heat shock samples from the Fish 310 lab. I isolated the RNA, DNase treated the sample, and ran a qPCR for quality control. I changed a few things from the previous protocols to make things run smoother and more efficient today. I've also taken several of Sam's suggestions on how I can improve my notebook.

RNA Isolation Protocol.
  1. 100 mg tissue homogenized in 1 ml RNAzol RT at room temp. 
  2. Added 400 ul 0.1% DEPC water to homogenate.
  3. Incubated 15 minutes at room temp
  4. Centrifuged 15 minutes at 11,400 rpm (~12,000 g)
  5. Transferred 1 ml supernatant to fresh tube
  6. Added 400 ul 75% EtOH
  7. Mixed via inversion for 15 seconds
  8. Incubated samples 10 minutes at room temp
  9. Centrifuged 8 minutes at 11,400 rpm (~12,000 g)
  10. Discarded supernant
  11. Added 600 ul 75% EtOH
  12. Vortexed 15 seconds
  13. Centrifuged 3 minutes at 7,400 rpm (~8000 g)
  14. Repeated steps 10 - 13. 
  15. Removed supernatant
  16. resuspended RNA in 50 ul 0.1% DEPC water
Instead of nanodropping the RNA, I immediately Turbo DNase Treated the samples to remove any DNA contamination. 

DNase Treatment Protocol:

1. Added 5 ul DNase 10X Buffer to each 50 ul of RNA.
2. Added 1 ul Turbo DNase to each RNA.
3. Incubated at room temp for 30 minutes
4. Added 5 ul DNase inhibitor to each sample
5. Incubated at room temp for 5 minutes, flicking occasionally
6. Centrifuged at 9400 rpm (~10,000 g) for 1.5 minutes
7. Decanted the top 50 ul of supernatant to fresh tube
8. Nanodropped

Nanodrop Results (including positive control):
Sample IDDateTimeng/ulA260A280260/280260/230
C+5/5/20154:17 PM167.34.1822.09222.34
42715HT15/5/20154:18 PM238.585.9653.3661.770.66
42715HT25/5/20154:19 PM422.4510.5615.4311.941
42715HT35/5/20154:21 PM175.574.3892.261.941.79
42715HT45/5/20154:22 PM251.196.283.5321.780.68
42715HT55/5/20154:23 PM391.299.7825.1331.910.87
42715ST15/5/20154:24 PM690.9417.27410.2581.680.49
42715ST25/5/20154:25 PM393.979.8495.1811.90.91
42715ST35/5/20154:25 PM365.739.1434.9171.860.99
42715ST45/5/20154:26 PM426.3310.6585.4071.970.99
42715ST55/5/20154:27 PM343.498.5874.6221.860.81
For the qPCR I used Actin primers and a positive control from Fidalgo seed oysters extracted on 3/23/2015. My negative control contained no DNA as to show there was no contamination in the Master Mix. I also bumped up the volume of sample used to 0.5 ul due to issues with the pipetter not being able to accurately pipette 0.2 ul. This is about 2.5 X the concentration of contamination gDNA that the cDNA will have in it. I also bumped down the amount of water by 1 ul per reaction so as to ensure proper reaction mixture ratios were maintained. 

qPCR Reagent Table:
VolumeReactions X12
Ssofast Evagreen MM 10140
FWD Primer0.57
REV Primer0.57
Nuclease Free H2O8.8123.2
RNA0.5

qPCR protocol:

1. Added each from greatest volume to least to make the master mix. 
2. Pipetted 20 ul master mix into each well of a qPCR partial plate
3. Added 0.5 ul sample to each tube

qPCR plate lay out:

1112
CC-C+
D42715HT142715ST1
E42715HT242715ST2
F42715HT342715ST3
G42715HT442715ST4
H42715HT542715ST5
This layout can be seen in the top left corner of the qPCR image below. 

qPCR program:

Sybr New Plate+Sybr cDNA 55 melt 1 Read
StepTemperatureTime
Initiation95 C10 min
Elongation95 C15 sec
55 C15 sec
Read
72 C15 sec
Repeat Elongation 40 times
Termination95 C1 min
55 C1 sec
Melt Curve Manual ramp 0.2C per sec Read 0.5 C65 - 95 C30 sec
21 C10 min
End


Results:
It looks like the DNase treatment removed some but not all the DNA. The DNA replicates much much earlier in the cycles. Overall I think these samples are good samples with high concentrations and mild DNA contamination. You can see the data files for the qPCR here and here

Sometime this week I will begin the process of creating cDNA to use with qPCR to test for HSP70 and other RNA markers. 


Monday, May 4, 2015

5 4 2015 DNase treatment

Today I ran the DNase treatment on the samples to remove any excess DNA from the samples. The treatment was pretty simple but I don't think it helped much as their was amplification at roughly the sample cycle as there was in the last quality check. The DNase treatments were old but I don't think that would cause an issue. I also had to mix kits as there wasn't enough reagents in a single kit to do the treatments on 10 samples.

Protocol for treatment:

1. Added 10 ul DNase 10X Buffer to each 100 ul of RNA.
2. Added 2 ul Turbo DNase to each RNA.
3. Incubated at 37 C for 30 minutes
4. Added 10 ul DNase inhibitor to each sample
5. Incubated at room temp for 5 minutes, flicking occasionally
6. Centrifuged at 10,000 g for 1.5 minutes
7. Decanted the top 100 ul of supernatant to fresh tube
8. Placed in -80 until I could run qPCR

Later this afternoon I ran the qPCR on the treatment.

Reagent work sheet:
VolumeReactions X12
Ssofast Evagreen MM 10140
FWD Actin Primer0.57
REV Actin Primer0.57
Nuclease Free H2O9.8137.2
RNA0.2

1. Added each from greatest volume to least to make the master mix. 
2. Pipetted 21 ul master mix into each well of a qPCR partial plate
3. Added 0.2 ul sample to each tube
4. Positive control was DNA extract from Oly seed oysters
5. Negative control had nothing added to the master mix

I ran the following program:
Sybr New Plate+Sybr cDNA 55 melt 2
StepTemperatureTime
Initiation95 C10 min
Elongation95 C15 sec
55 C15 sec
Read
72 C15 sec
Read
Repeat Elongation 40 times
Termination95 C1 min
55 C1 sec
Melt Curve Manual ramp 0.2C per sec Read 0.5 C65 - 95 C30 sec
21 C10 min
End
You can see the results below

bright green = positive control, red = negative control, light blue down to brown = HM1-5, dark blue to yellow = SM1-5

The positive control began amplifying at the 21 cycle marks. One sample began at 30 cycles the rest were between 34 and 36. 

You can see the raw datafile here.

Tomorrow I will isolate the RNA from the 310 heat shock samples, treat with DNase, and qPCR for quality. 


Friday, May 1, 2015

5 1 2015 qPCR Quality Check

Today I ran a quality check on the samples that I isolated yesterday. Instead of creating cDNA before doing the qPCR I ran just the RNA with Actin primers to determine if there was any genomic contamination in the RNA samples. I diluted the RNA to levels similar to that which would have gone from the cDNA process to the qPCR process. This was to ensure that any genomic dna would be at levels similar to that from from the cDNA process and wouldn't over estimate the concentration of them in the sample.

The qPCR protocol was as follows

Master Mix
VolumeReactions X12
Ssofast Evagreen MM 10120
FWD Primer0.56
REV Primer0.56
Nuclease Free H2O9.8117.6

1. Added the reagents from highest volume to lowest to the master mix
2. Vortexed
3. pipetted into .5 ml qPCR tubes
4. Added 0.2 ul RNA to each tube from each isolation
5. Placed into the Opticon 2 qPCR machine
6. Ran the program "Sybr New Plate + Sybr cDNA 55 melt 2 reads"

Results


As you can see, the samples began amplifying at 27-30 cycles which is indicative of a genomic DNA contamination. The negative control did not begin amplifying until 37 cycles. 

For future work, I need to use a DNase treatment to remove genomic DNA before I create cDNA. Next week I will isolate the 310 heat shock animals, DNase treat everything, and produce cDNA.