Primers:
| 1640 | BMP-2_FWD | TGAAGGAACGACCAAAGCCA | JH | 5/21/2015 | 20 | 55 | O.lurida | Bone morphogenetic protein 2 (BMP-2) (Bone morphogenetic protein 2A) (BMP-2A) | P12643 | |
| 1639 | BMP-2_REV | TCCGGTTGAAGAACCTCGTG | JH | 5/21/2015 | 20 | 55 | O.lurida | Bone morphogenetic protein 2 (BMP-2) (Bone morphogenetic protein 2A) (BMP-2A) | P12643 |
| Volume | Reactions X116 | |
| Ssofast Evagreen MM | 10 | 1160 |
| FWD Primer | 0.5 | 58 |
| REV Primer | 0.5 | 58 |
| 1:9 cDNA | 9 |
- Added reagents from greatest to least volume
- Vortexed
- Centrifuged briefly
- Pipetted 11 ul Master Mix to each tube using a 12 shot multichannel pipetter
- Pipetted 9 ul of 1:9 cDNA each column using a channel pipetter
- Centrifuged plate at 2000 rpm for 1 minute
- Ran Program Below
Program:
| Step | Temperature | Time |
| Initiation | 95 C | 10 min |
| Elongation | 95 C | 30 sec |
| 60 C | 1 min | |
| Read | ||
| 72 C | 30 sec | |
| Read | ||
| Repeat Elongation 39 times | ||
| Termination | 95 C | 1 min |
| 55 C | 1 sec | |
| Melt Curve Manual ramp 0.2C per sec Read 0.5 C | 55 - 95 C | 30 sec |
| 21 C | 10 min | |
| End |
Plate Layout:
| 1 | 2 | 3 | 4 | 5 | 6 | 7 | 8 | 9 | 10 | 11 | 12 |
| DNased 42215 HC1 | DNased 42215 NC1 | DNased 42215 SC1 | DNased 42215 HT1 1 | DNased 42215 NT1 1 | DNased 42215 ST1 1 | DNased 42215 HC1 | DNased 42215 NC1 | DNased 42215 SC1 | DNased 42215 HT1 1 | DNased 42215 NT1 1 | DNased 42215 ST1 1 |
| DNased 42215 HC2 | DNased 42215 NC2 | DNased 42215 SC2 | DNased 42215 HT1 2 | DNased 42215 NT1 2 | DNased 42215 ST1 2 | DNased 42215 HC2 | DNased 42215 NC2 | DNased 42215 SC2 | DNased 42215 HT1 2 | DNased 42215 NT1 2 | DNased 42215 ST1 2 |
| DNased 42215 HC3 | DNased 42215 NC3 | DNased 42215 SC3 | DNased 42215 HT1 3 | DNased 42215 NT1 3 | DNased 42215 ST1 3 | DNased 42215 HC3 | DNased 42215 NC3 | DNased 42215 SC3 | DNased 42215 HT1 3 | DNased 42215 NT1 3 | DNased 42215 ST1 3 |
| DNased 42215 HC4 | DNased 42215 NC4 | DNased 42215 SC4 | DNased 42215 HT1 4 | DNased 42215 NT1 4 | DNased 42215 ST1 4 | DNased 42215 HC4 | DNased 42215 NC4 | DNased 42215 SC4 | DNased 42215 HT1 4 | DNased 42215 NT1 4 | DNased 42215 ST1 4 |
| DNased 42215 HC5 | DNased 42215 NC5 | DNased 42215 SC5 | DNased 42215 HT1 5 | DNased 42215 NT1 5 | DNased 42215 ST1 5 | DNased 42215 HC5 | DNased 42215 NC5 | DNased 42215 SC5 | DNased 42215 HT1 5 | DNased 42215 NT1 5 | DNased 42215 ST1 5 |
| DNased 42215 HC6 | DNased 42215 NC6 | DNased 42215 SC6 | DNased 42215 HT1 6 | DNased 42215 NT1 6 | DNased 42215 ST1 6 | DNased 42215 HC6 | DNased 42215 NC6 | DNased 42215 SC6 | DNased 42215 HT1 6 | DNased 42215 NT1 6 | DNased 42215 ST1 6 |
| DNased 42215 HC7 | DNased 42215 NC7 | DNased 42215 SC7 | DNased 42215 HT1 7 | DNased 42215 NT1 7 | DNased 42215 ST1 7 | DNased 42215 HC7 | DNased 42215 NC7 | DNased 42215 SC7 | DNased 42215 HT1 7 | DNased 42215 NT1 7 | DNased 42215 ST1 7 |
| DNased 42215 HC8 | DNased 42215 NC8 | DNased 42215 SC8 | DNased 42215 HT1 8 | DNased 42215 NT1 8 | DNased 42215 ST1 8 | DNased 42215 HC8 | DNased 42215 NC8 | DNased 42215 SC8 | DNased 42215 HT1 8 | DNased 42215 NT1 8 | DNased 42215 ST1 8 |
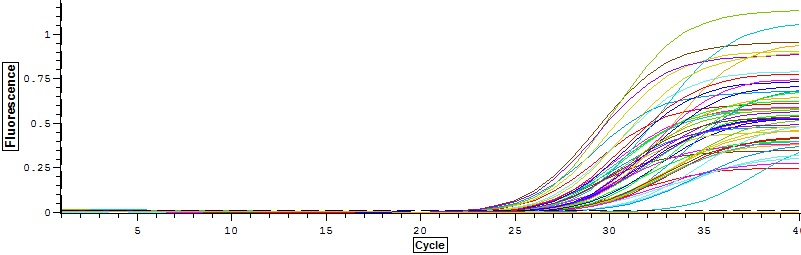
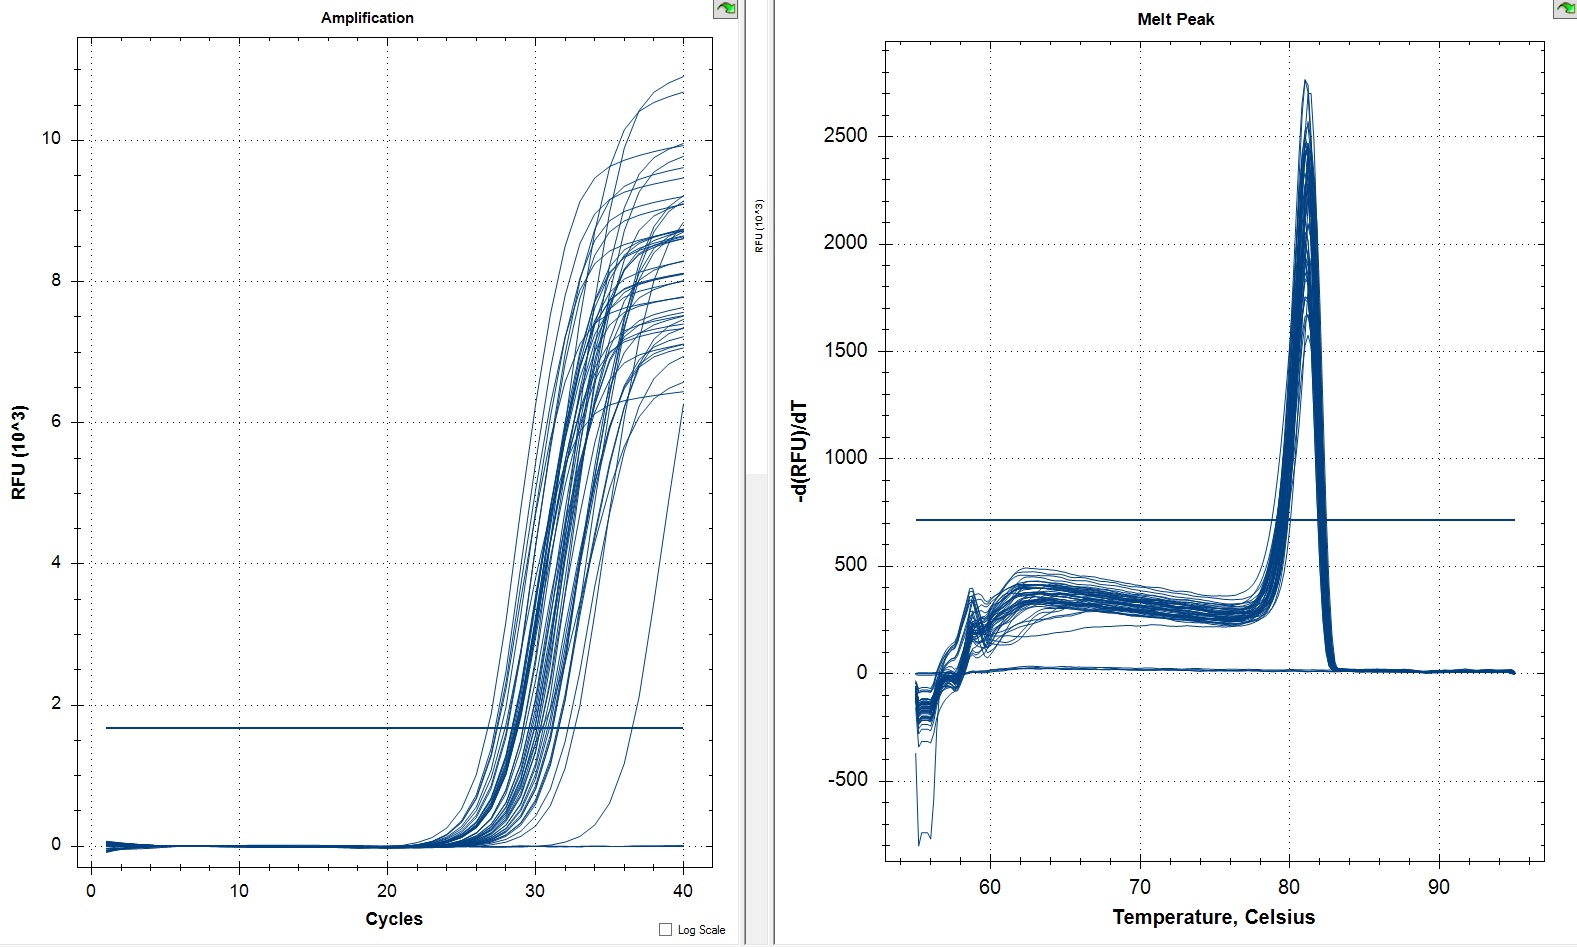
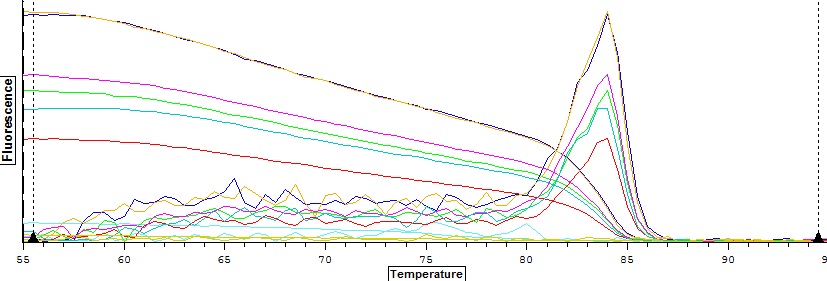
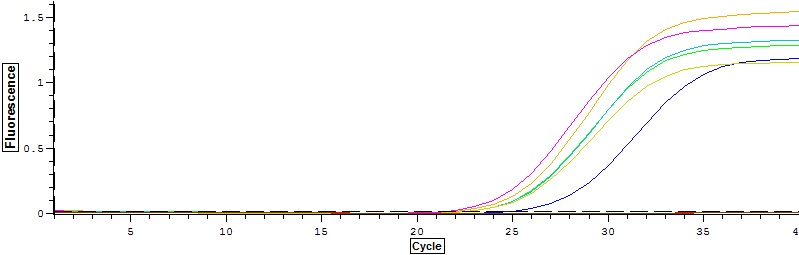
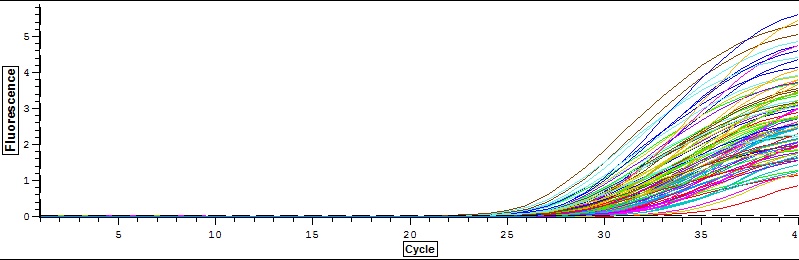
All
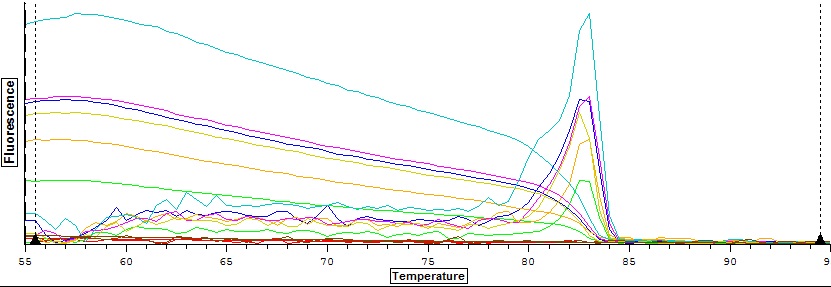
Amplifications
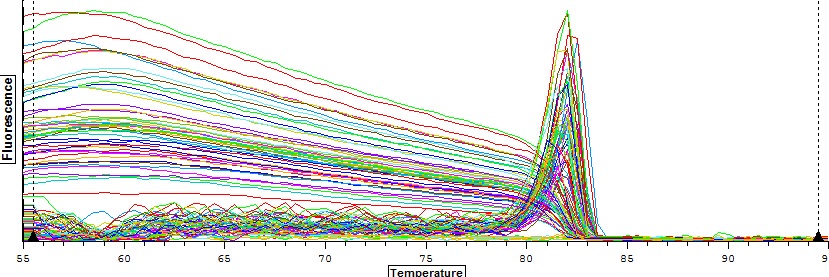
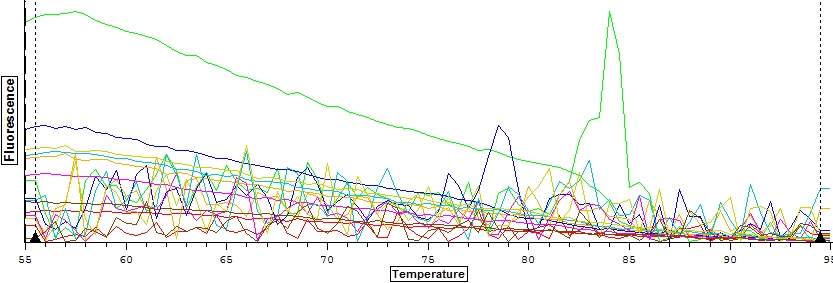
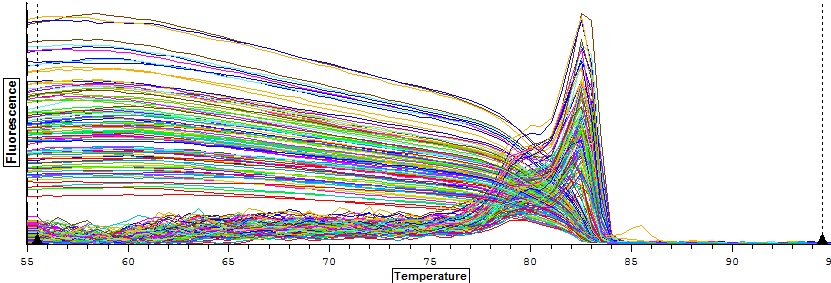
Melt Curve
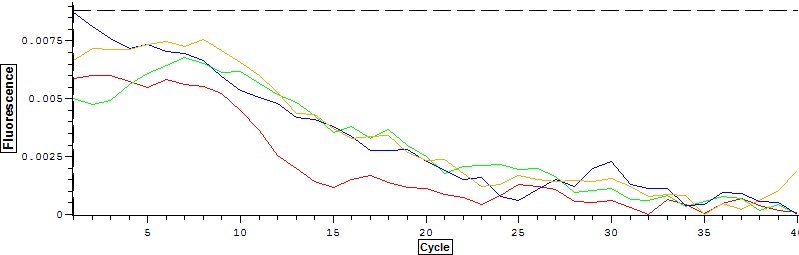
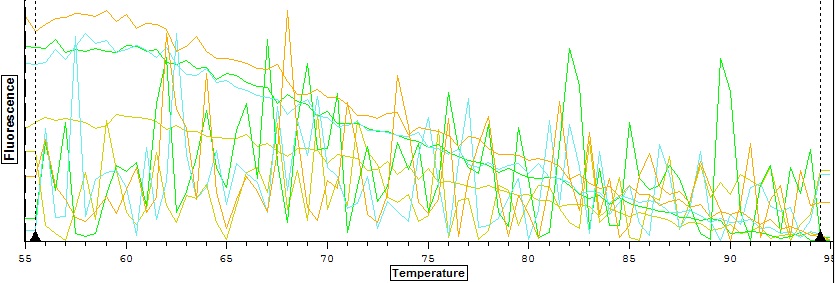
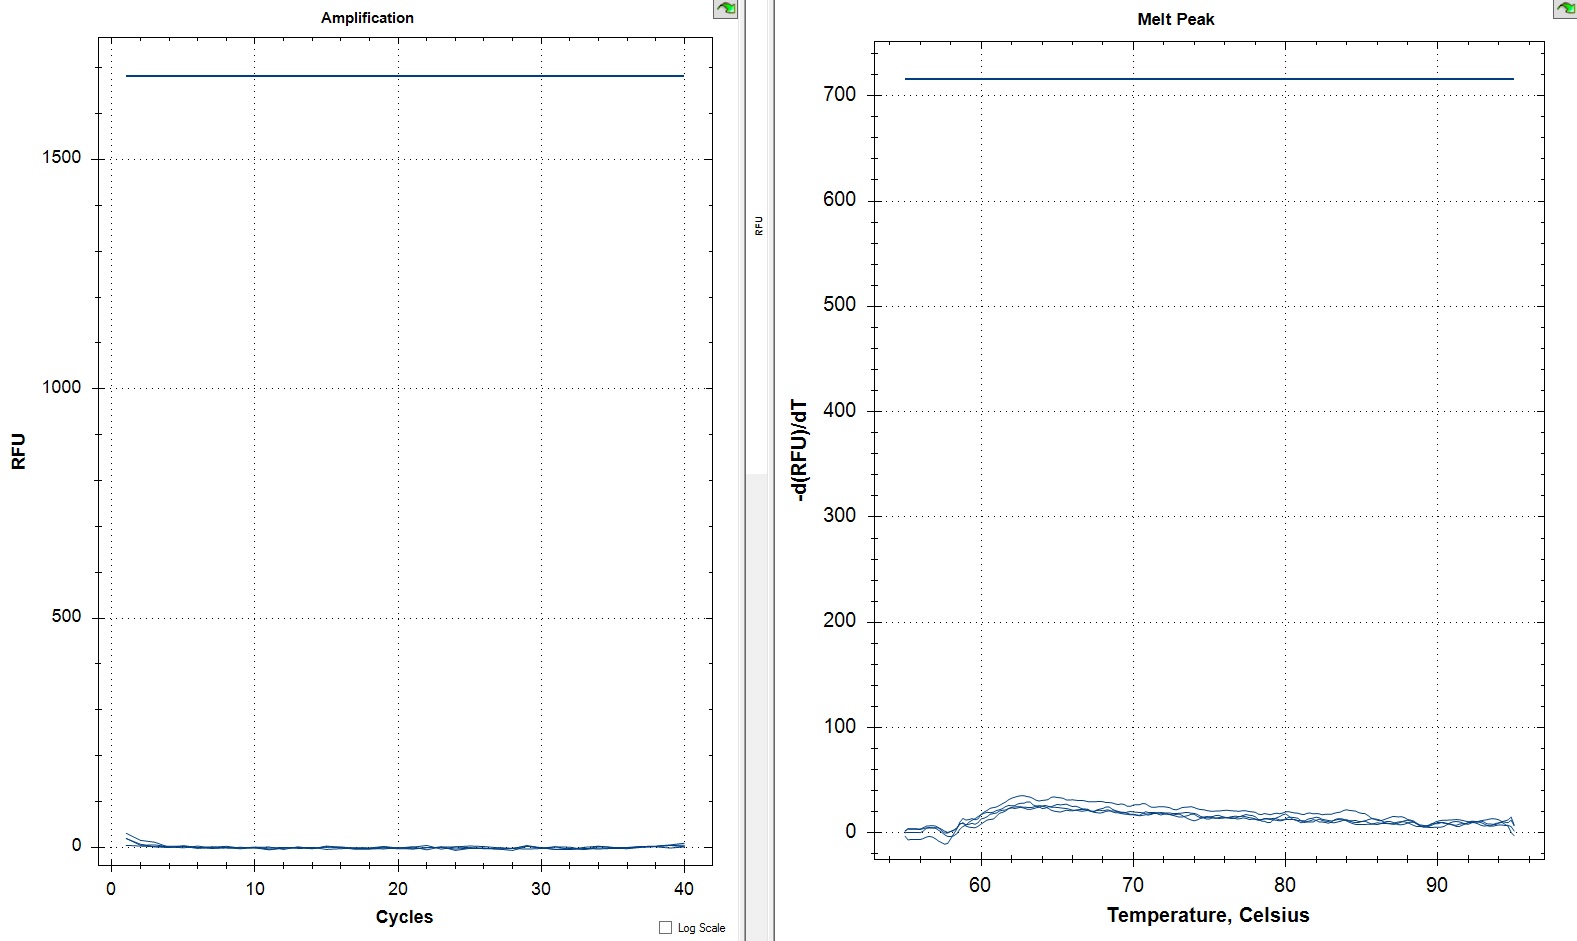
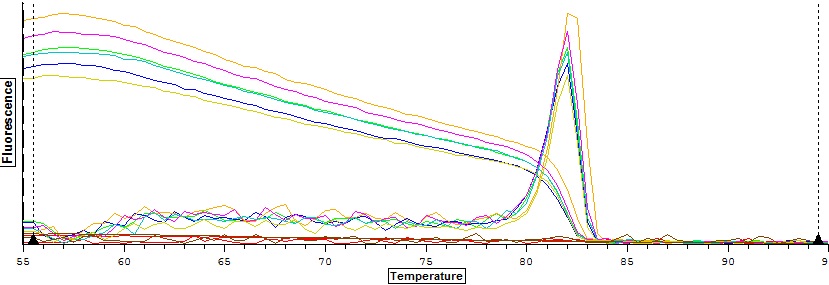
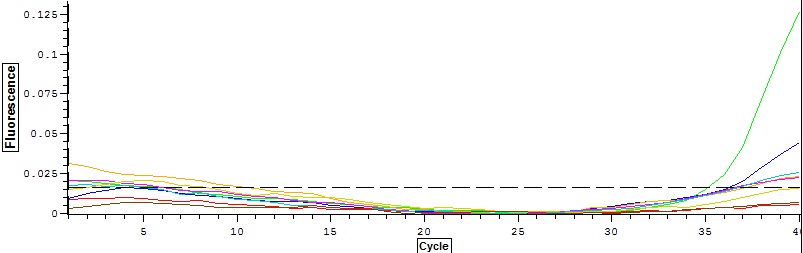
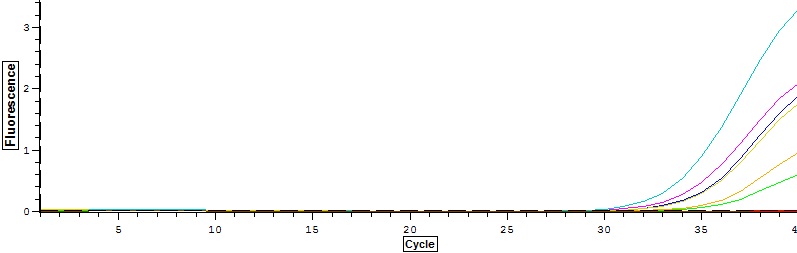
NTCs
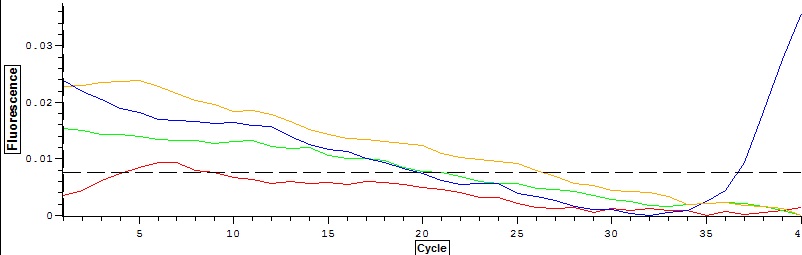
Amplifications
Melt Curve
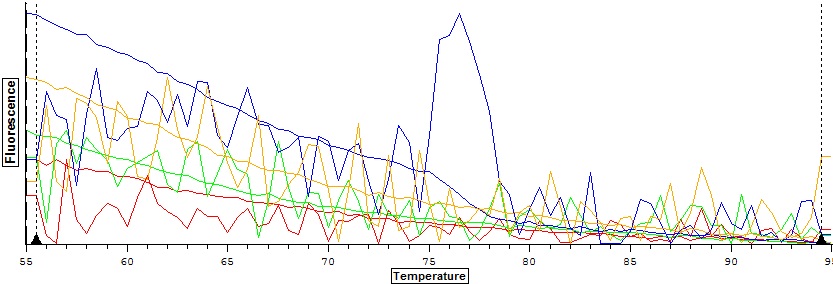
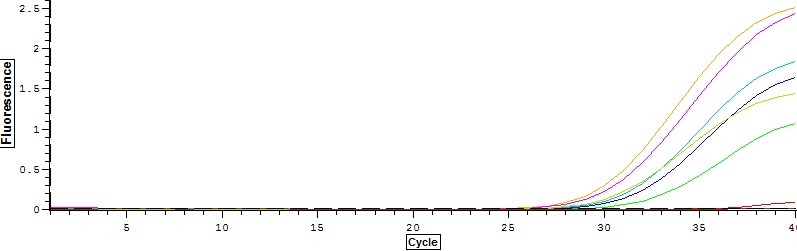
The amplification curves look good. There's minor amplification in the NTCs but its a primer dimer. Melt curve still isn't great but still pretty strong.
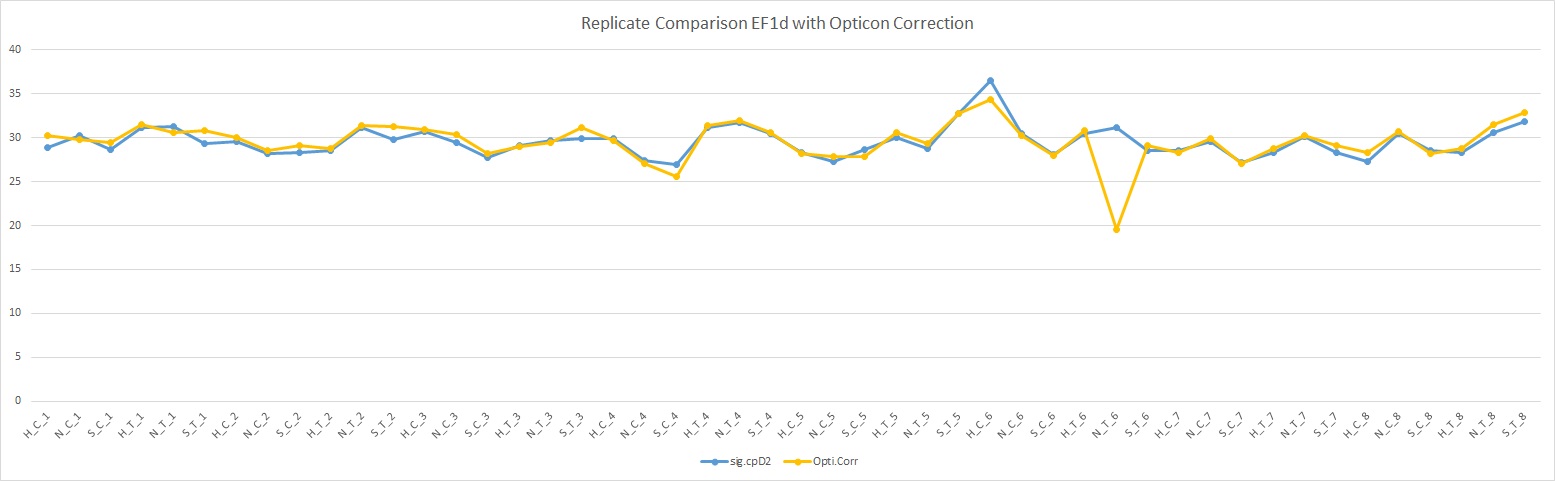
The reps I added to the comparison spreadsheet and we're working on determining their value.