Primers:
| 1640 | BMP-2_FWD | TGAAGGAACGACCAAAGCCA | JH | 5/21/2015 | 20 | 55 | O.lurida | Bone morphogenetic protein 2 (BMP-2) (Bone morphogenetic protein 2A) (BMP-2A) | P12643 | |
| 1639 | BMP-2_REV | TCCGGTTGAAGAACCTCGTG | JH | 5/21/2015 | 20 | 55 | O.lurida | Bone morphogenetic protein 2 (BMP-2) (Bone morphogenetic protein 2A) (BMP-2A) | P12643 |
Reagent Table:
| Volume | Reactions X116 | |
| Ssofast Evagreen MM | 10 | 1160 |
| FWD Primer | 0.5 | 58 |
| REV Primer | 0.5 | 58 |
| 1:9 cDNA | 9 |
- Added reagents from greatest to least volume
- Vortexed
- Centrifuged briefly
- Pipetted 11 ul Master Mix to each tube
- Pipetted 9 ul of 1:9 cDNA each column using a channel pipetter
- Centrifuged plate at 2000 rpm for 1 minute
- Ran Program Below
Program:
| Step | Temperature | Time |
| Initiation | 95 C | 10 min |
| Elongation | 95 C | 30 sec |
| 60 C | 1 min | |
| Read | ||
| 72 C | 30 sec | |
| Read | ||
| Repeat Elongation 39 times | ||
| Termination | 95 C | 1 min |
| 55 C | 1 sec | |
| Melt Curve Manual ramp 0.2C per sec Read 0.5 C | 55 - 95 C | 30 sec |
| 21 C | 10 min | |
| End |
Plate Layout:
| 1 | 2 | 3 | 4 | 5 | 6 | 7 |
| DNased 42215 HC1 | DNased 42215 NC1 | DNased 42215 SC1 | DNased 42215 HT1 1 | DNased 42215 NT1 1 | DNased 42215 ST1 1 | NTC |
| DNased 42215 HC2 | DNased 42215 NC2 | DNased 42215 SC2 | DNased 42215 HT1 2 | DNased 42215 NT1 2 | DNased 42215 ST1 2 | NTC |
| DNased 42215 HC3 | DNased 42215 NC3 | DNased 42215 SC3 | DNased 42215 HT1 3 | DNased 42215 NT1 3 | DNased 42215 ST1 3 | NTC |
| DNased 42215 HC4 | DNased 42215 NC4 | DNased 42215 SC4 | DNased 42215 HT1 4 | DNased 42215 NT1 4 | DNased 42215 ST1 4 | NTC |
| DNased 42215 HC5 | DNased 42215 NC5 | DNased 42215 SC5 | DNased 42215 HT1 5 | DNased 42215 NT1 5 | DNased 42215 ST1 5 | |
| DNased 42215 HC6 | DNased 42215 NC6 | DNased 42215 SC6 | DNased 42215 HT1 6 | DNased 42215 NT1 6 | DNased 42215 ST1 6 | |
| DNased 42215 HC7 | DNased 42215 NC7 | DNased 42215 SC7 | DNased 42215 HT1 7 | DNased 42215 NT1 7 | DNased 42215 ST1 7 | |
| DNased 42215 HC8 | DNased 42215 NC8 | DNased 42215 SC8 | DNased 42215 HT1 8 | DNased 42215 NT1 8 | DNased 42215 ST1 8 |
Results:
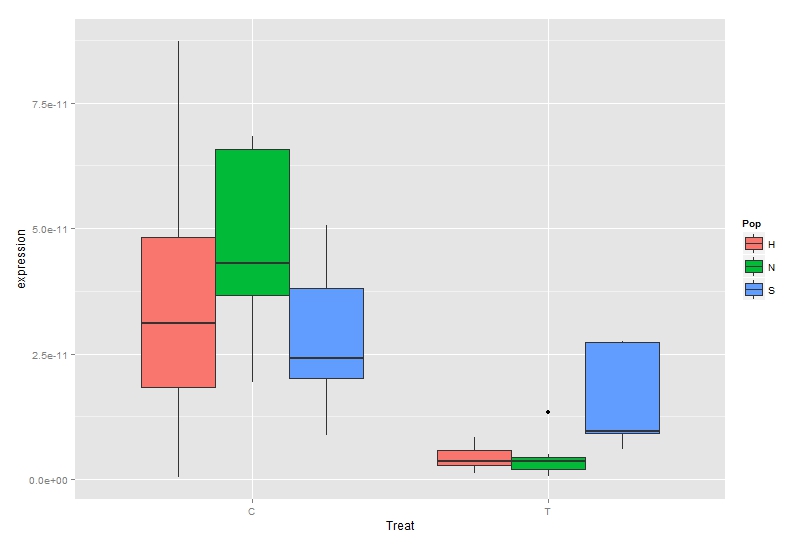
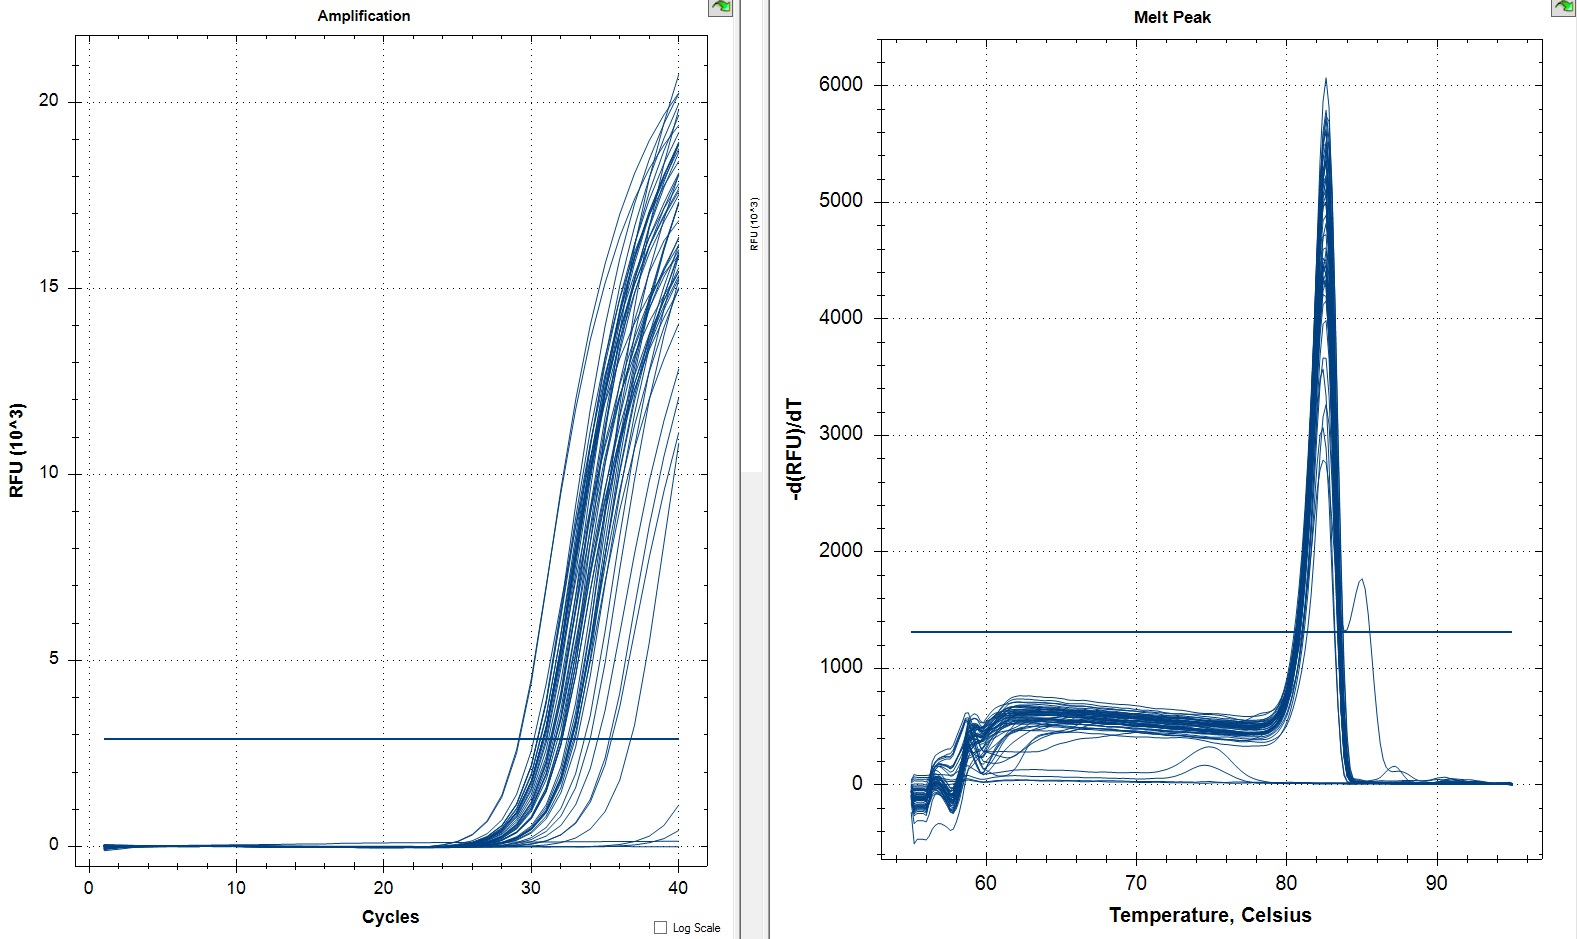
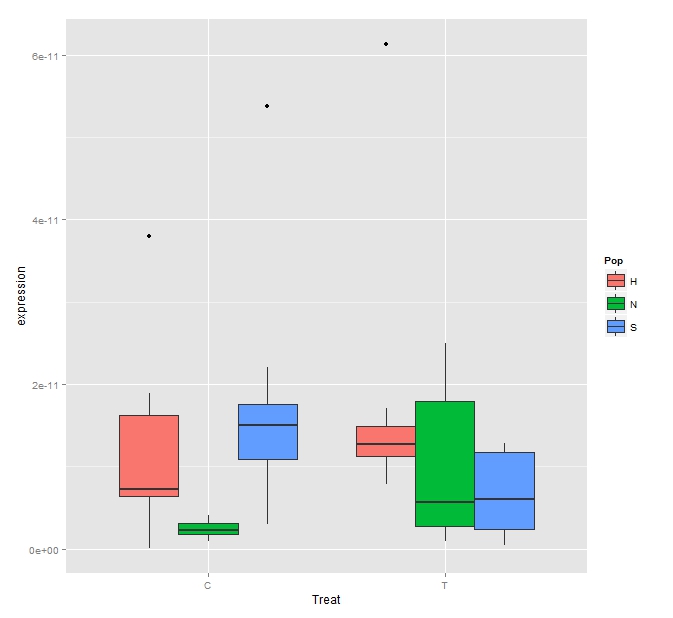
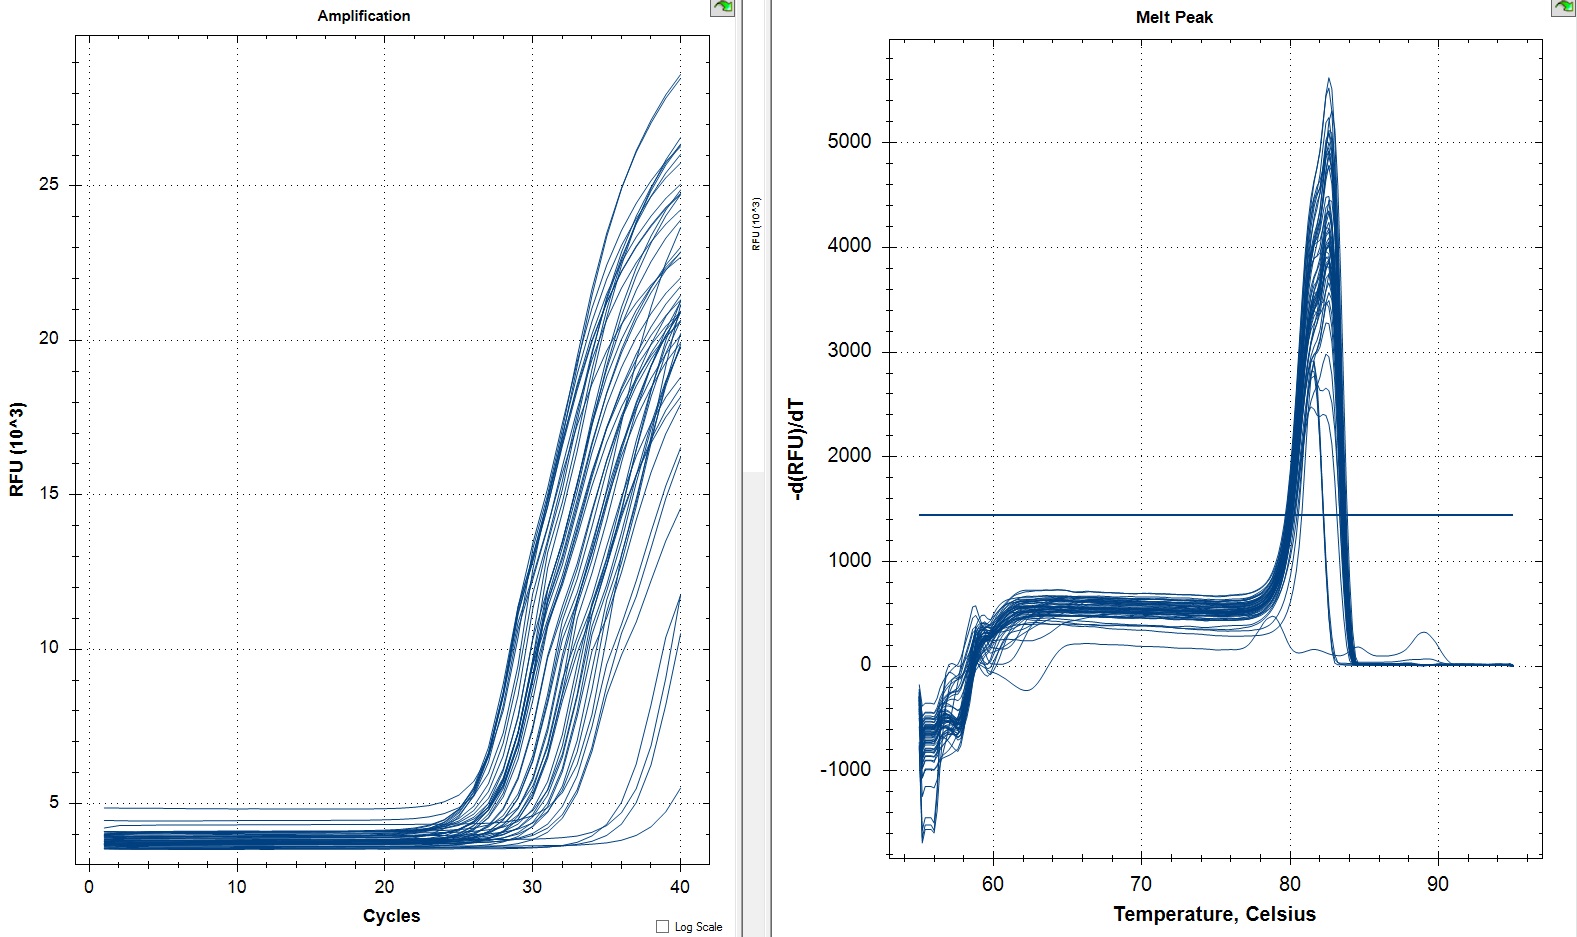
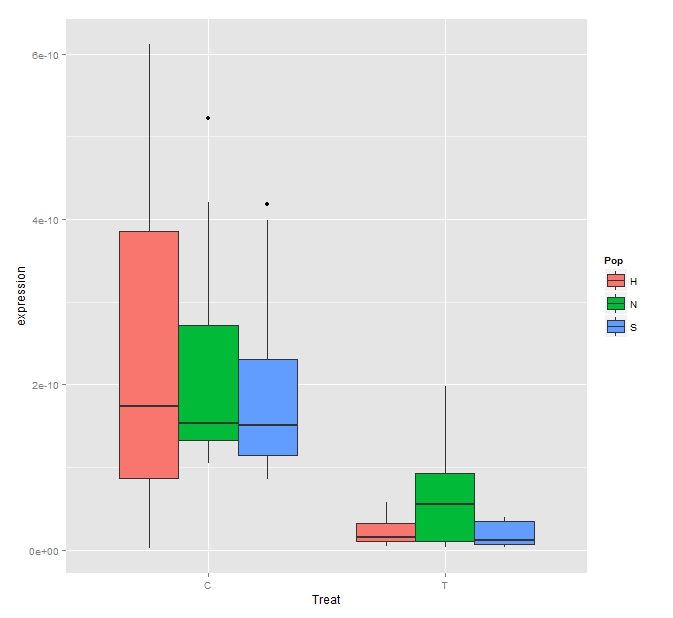
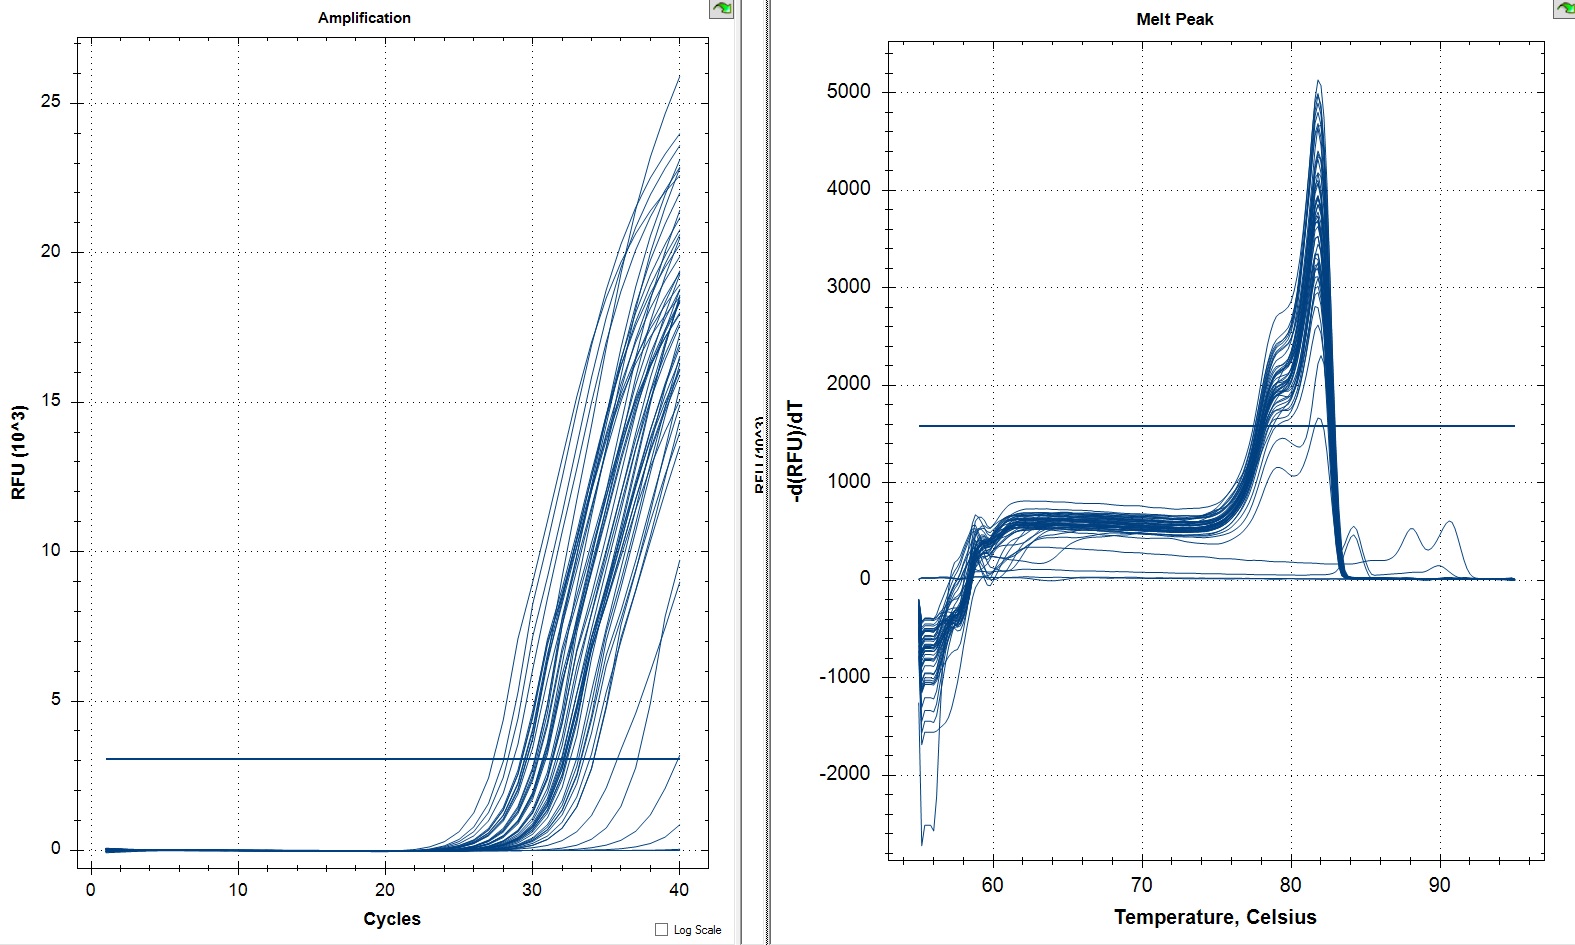
All samples
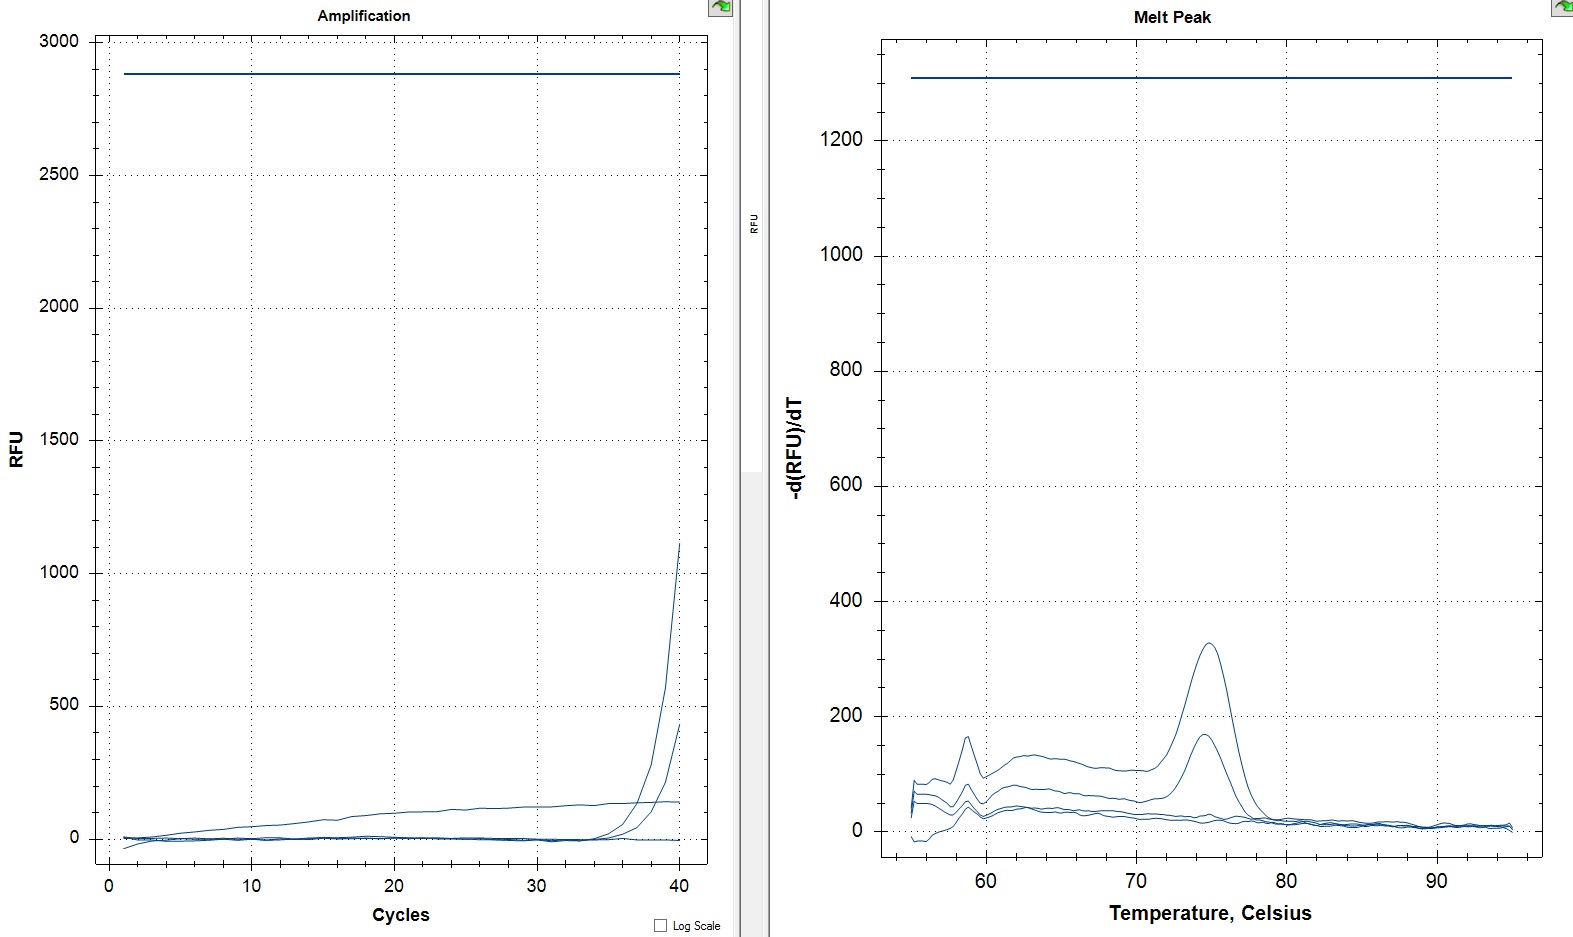
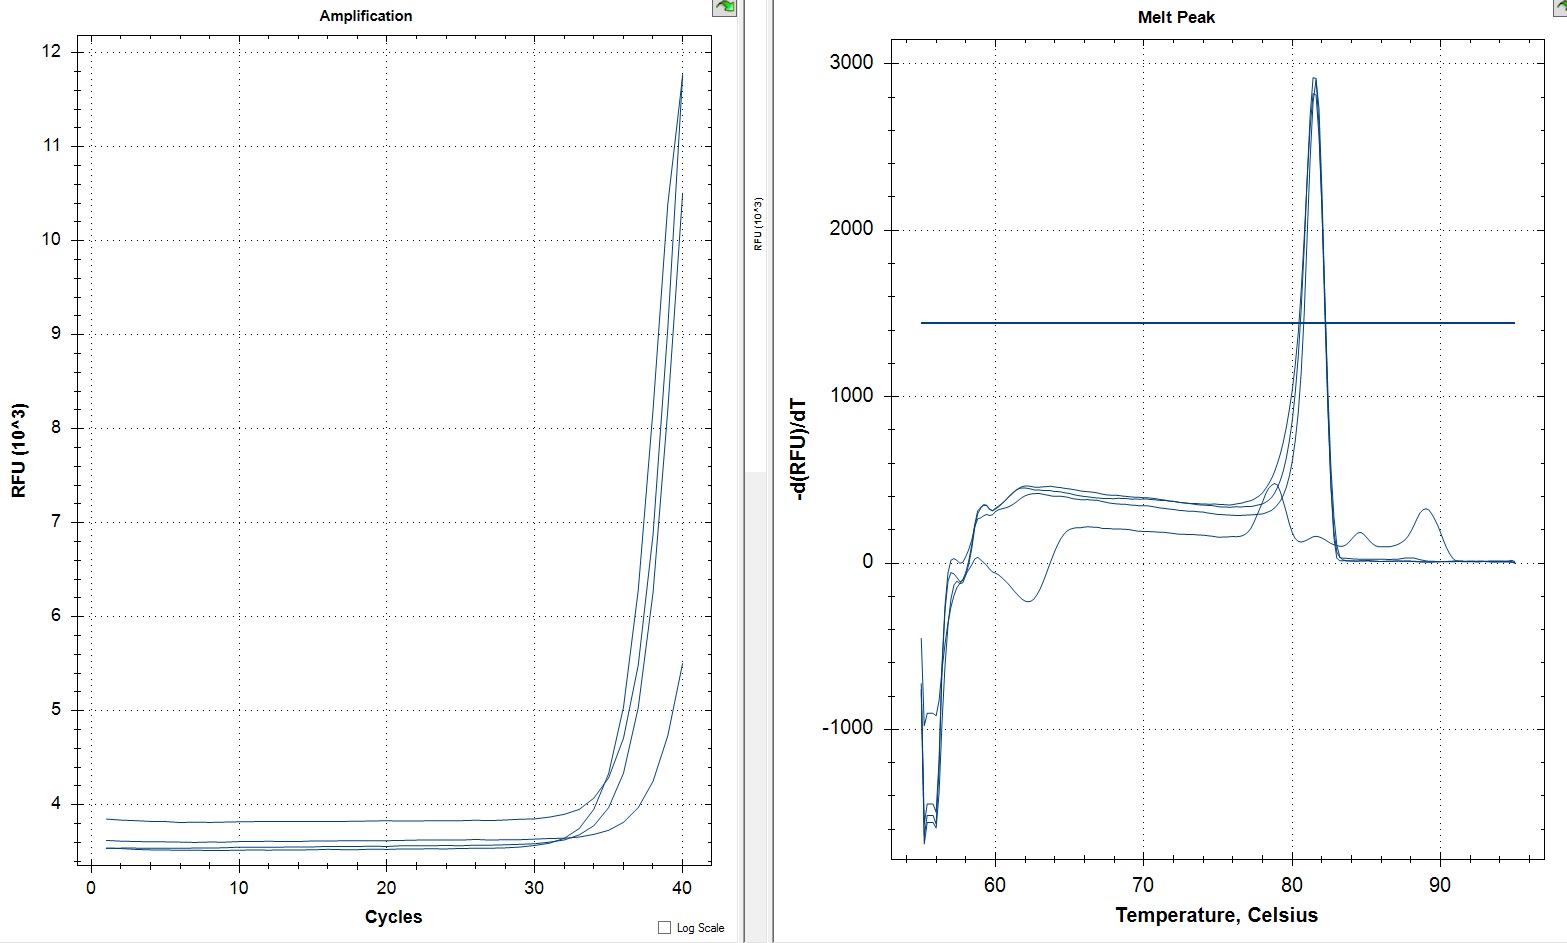
NTCs
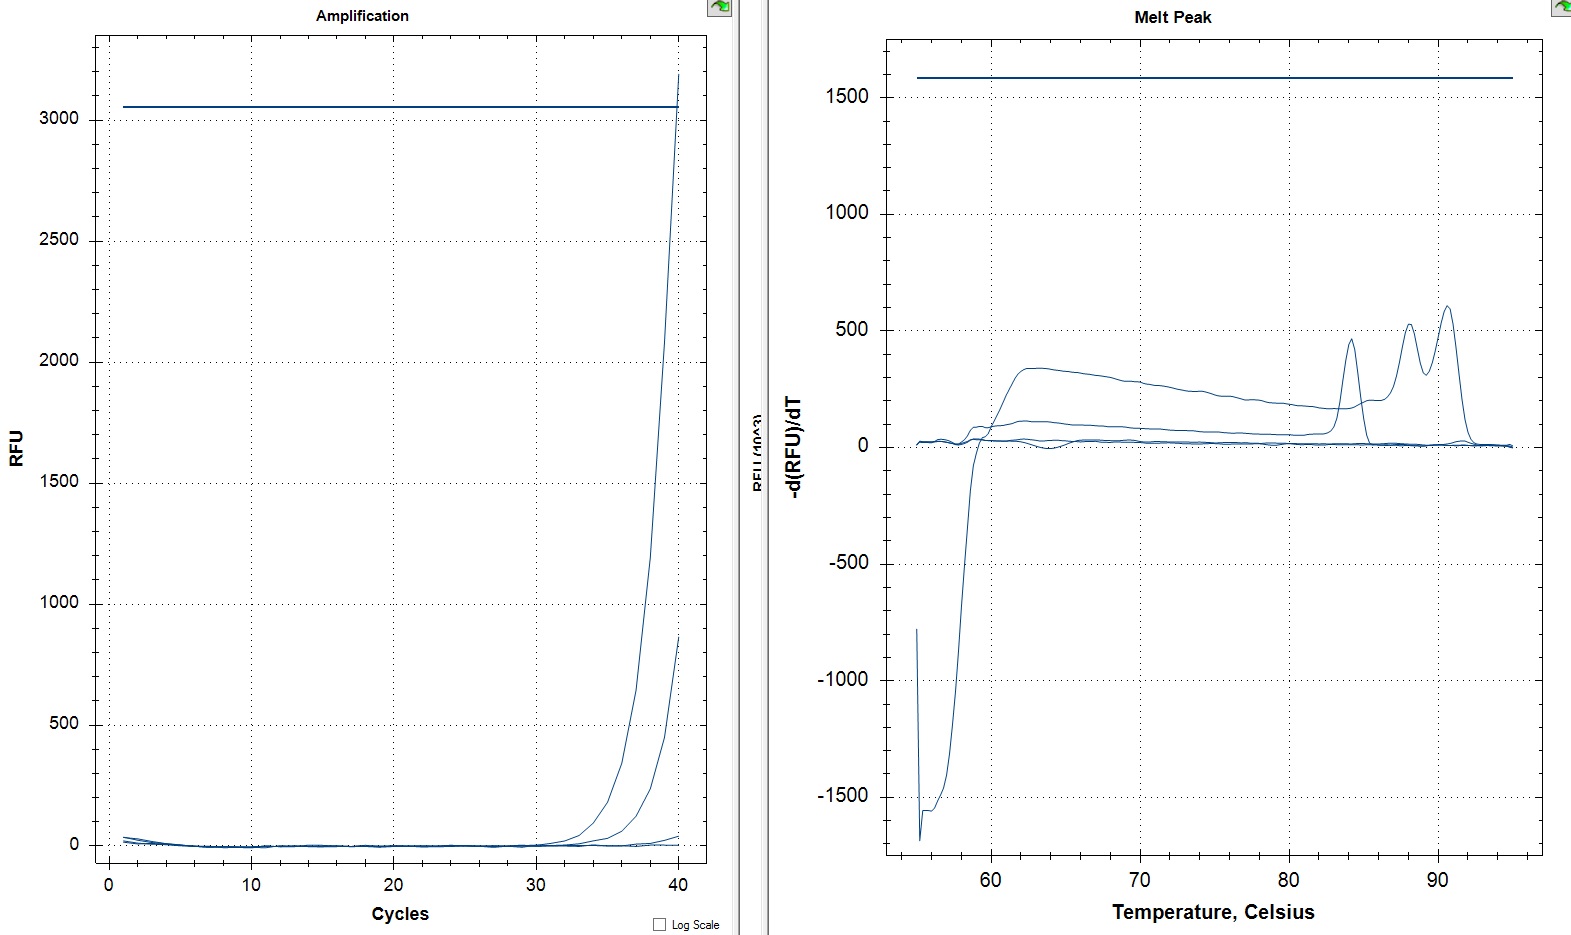
These amplification curves look better than the last run of BMP2. There is some minor amplification in the NTCs but it is larger than the target and is probably an artifact of the PCR process. To analyze these data I ran them through an updated stats and graphs script which runs a Two Way ANOVA and produces a boxplot and expression bar graph. The data did not have its outliers eliminated which worked fine with this as most samples showed some expression.
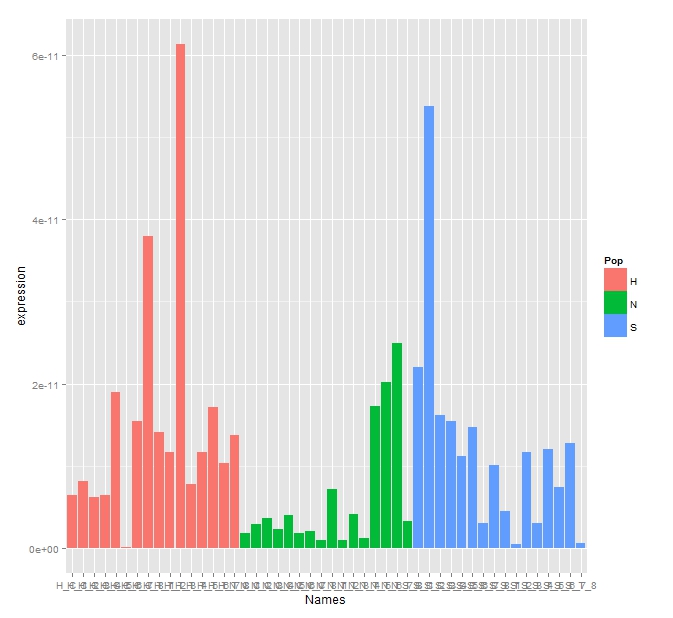
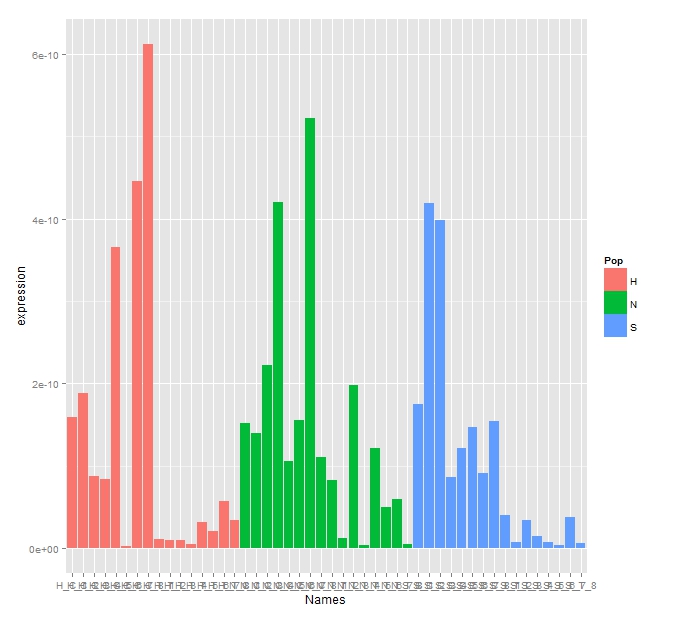
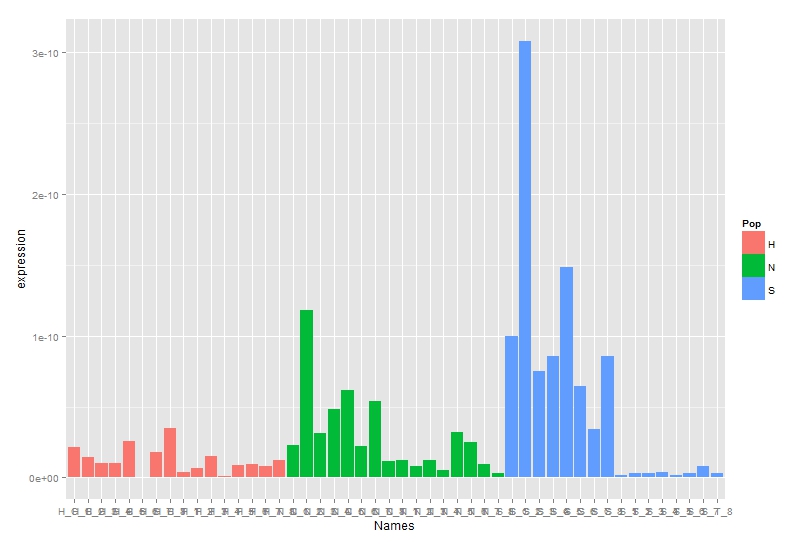
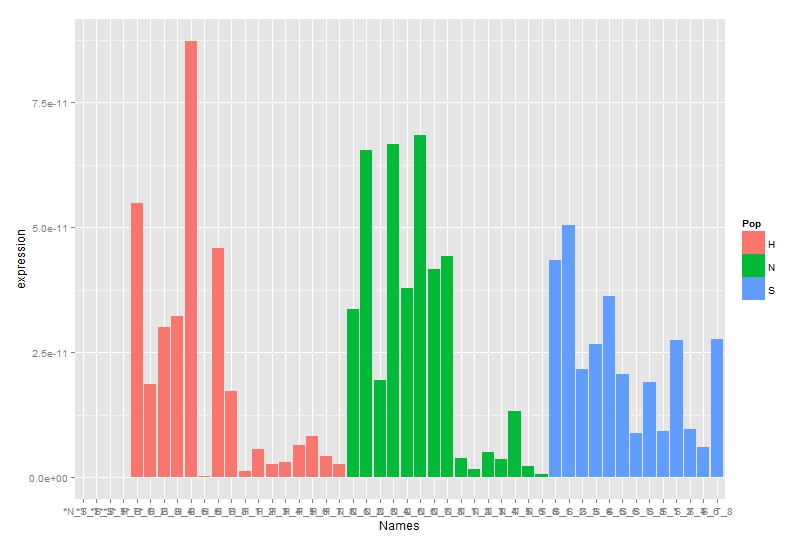
Expression Bar Graph
Statistics
Call:
aov(formula = expression ~ Pop + Treat + Pop:Treat, data = rep2res2)
Terms:
Pop Treat Pop:Treat Residuals
Sum of Squares 1.703293e-20 3.032145e-20 2.201442e-20 6.077281e-20
Deg. of Freedom 2 1 2 42
Residual standard error: 3.803908e-11
Estimated effects may be unbalanced
> TukeyHSD(fit)
Tukey multiple comparisons of means
95% family-wise confidence level
Fit: aov(formula = expression ~ Pop + Treat + Pop:Treat, data = rep2res2)
$Pop
diff lwr upr p adj
N-H 0.4089519
S-H 0.0041846
S-N 0.1002050
$Treat
diff lwr upr p adj
T-C 4.14e-05
$`Pop:Treat`
diff lwr upr p adj
N:C-H:C 0.6348257
S:C-H:C 0.0001275
H:T-H:C 0.9973637
N:T-H:C 0.9999701
S:T-H:C 0.9814628
S:C-N:C 0.0134535
H:T-N:C 0.3564950
N:T-N:C 0.5192134
S:T-N:C 0.2393859
H:T-S:C 0.0000292
N:T-S:C 0.0000710
S:T-S:C 0.0000133
N:T-H:T 0.9997768
S:T-H:T 0.9998827
S:T-N:T 0.9953619
There definitely appears a significant difference between treatment and control. From the stats it appears the Oyster Bay population control has significantly larger expression of BMP2 than the other two populations as well as it the Oyster Bay treatment. You can see this in the bar graph generated below.
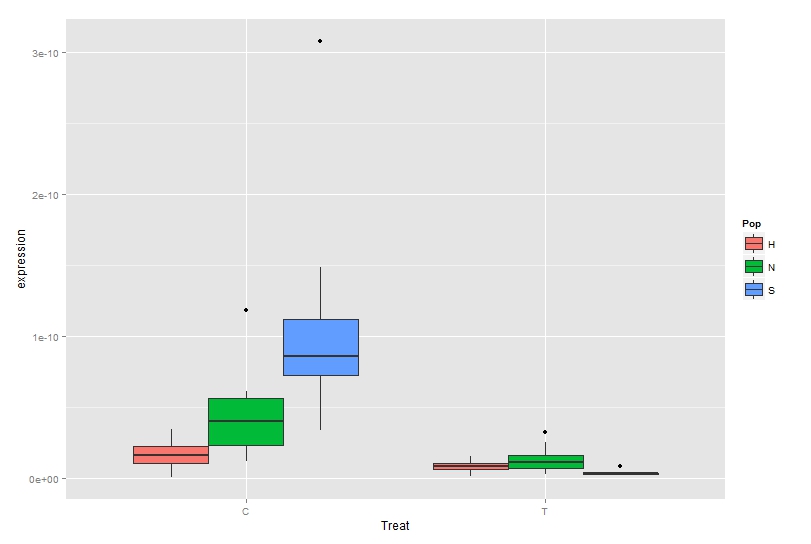
The most distressing thing about these data is that it doesn't match the graphs from last week. The controls have much lower expression than they did last week which should not have changed between replicates. I reran the previous data with all the outliers but it still doesn't change the statistics.
Previous Expression Data
Previous Data Stats
Call:
aov(formula = expression ~ Pop + Treat + Pop:Treat, data = rep2res2)
Terms:
Pop Treat Pop:Treat Residuals
Sum of Squares 3.918260e-22 9.723005e-21 1.573763e-21 9.279358e-21
Deg. of Freedom 2 1 2 38
Residual standard error: 1.56267e-11
Estimated effects may be unbalanced
4 observations deleted due to missingness
> TukeyHSD(fit)
Tukey multiple comparisons of means
95% family-wise confidence level
Fit: aov(formula = expression ~ Pop + Treat + Pop:Treat, data = rep2res2)
$Pop
p adj
N-H 0.4224591
S-H 0.8174685
S-N 0.8189700
$Treat
p adj
T-C 2e-07
$`Pop:Treat`
p adj
N:C-H:C 0.6961640
S:C-H:C 0.9298189
H:T-H:C 0.0032438
N:T-H:C 0.0048368
S:T-H:C 0.2481527
S:C-N:C 0.1806352
H:T-N:C 0.0000405
N:T-N:C 0.0000732
S:T-N:C 0.0140727
H:T-S:C 0.0411016
N:T-S:C 0.0532668
S:T-S:C 0.7297433
N:T-H:T 1.0000000
S:T-H:T 0.7788719
S:T-N:T 0.7991437
The stats don't match which is distressing. Even the boxplots dont seem to match.