Tag Archives: 18s

qPCR – Ronit’s DNAsed C.gigas Ploidy/Dessication RNA with 18s primers

After DNasing Ronit’s RNA earlier today, I needed to check for any residual gDNA.

Identified some old, old C.gigas 18s primers that should amplify gDNA:

  • gigas18s_fw (SRID 157)
  • gigas18s_rv (SRID 156)

Used some old C.gigas gDNA (BB15 from 20090519) as a positive control.

Samples were run on Roberts Lab CFX Connect (BioRad). All samples were run in duplicate. See qPCR Report (Results section) for plate layout, cycling params, etc.

qPCR master mix calcs (Google Sheet):


Results

qPCR Report (PDF):

qPCR File (PCRD):

qPCR Data (CSV):

Well, this primer set and/or the gDNA is not good. In the plots below, the positive control gNDA is in green, samples in blue, and no template controls (NTC) are in red.

Poor performance is most easily noticed when looking at the melt curves. They have multiple peaks, suggesting non-specific amplification, even in the positive control.

Additionally, although less evident from just looking at the plots, is the replicates are highly inconsistent. Although it’s possible that might be due to poor technique, it’s very unlikely.

Will have to identify different primers and/or positive control DNA.


Amplification Plots


Melt Curves

qPCR – DNased RNA from earlier today

Checked DNased RNA samples from earlier today for the presence of residual gDNA. Used C.gigas BB16 gDNA (from 20110201) diluted to ~7ng/uL as a positive control to match the dilution factor of the RNA that will be used in the reverse transcription reaction (175ng in 25uL = 7ng/uL). All samples were run in duplicate. Master mix calcs are here. Plate layout, cycling params, etc can be found in the qPCR Report (see Results).

Results:

qPCR Data (CFX96)

qPCR Report (PDF)

Positive control (in Green in qPCR Report) worked perfectly and showed excellent repeatability. The remainder of the samples (in Blue in qPCR Report) and the NTCs (in Red in qPCR Report) were extremely inconsistent with many having one replicate show late amplification, while the other replicate showed no amplification at all. Will have to repeat to get a more definitive assessment of residual gDNA content in these samples.

qPCR – C.gigas 18s and EF1a on V.vulnificus exposure cDNA (from 20110311)

Ran a qPCR on all cDNA samples from the V.vulnificus exposure experiment from 20110111. This qPCR was to test 2 of 4 potential normalizing genes to evaluate which genes show the least amount of effect from the treatments in this experiment. Primers for 18s used were Cg_18s_1644_F (SR ID: 1168), Cg_18s_1750_R (SR ID: 1169). Primers for EF1a used were EF1_qPCR_5′ (SR ID: 309), EF1_qPCR_3′ (SR ID: 310)Samples were run in duplicate. Master mix calcs are here. The master mix info is the same that was used earlier today, but with the primers noted above, not those listed on the calcs page. Plate layout, cycling params, etc., can be seen in the qPCR Report (see Results).

Results:

qPCR Data File (BioRad CFX96)

qPCR Report (PDF)

18s: Average Cq = 22.39, Standard Deviation = 0.905

EF1a: Average Cq = 20.59, Standard Deviation = 0.658

qPCR – Check DNased RNA BB01 for Residual gDNA (from earlier today)

Ran qPCR on DNased RNA from earlier today to verify removal of contaminating gDNA. Used C.gigas 18s primers (SR IDs: 156, 157). 0.5uL (~40ng) of DNased RNA was used for testing. This corresponds, roughly, to the amount of sample that would be carried through to qPCR analysis of cDNA, assuming 1ug of RNA was used to make the cDNA (cDNA = 1000ng RNA/25uL = 40ng/uL, 1uL of cDNA in 25uL qPCR reaction). Positive control sample was ~25ng BB16 gDNA (from 20090519). Master mix calcs are here. Plate layout, cycling params, etc can be found in the qPCR Report (see Results). RNA was stored @ -80C in “Sam’s -80C Box”.

Results:

qPCR Report (PDF)

qPCR Data File (CFX96)

Residual gDNA is present in the sample. So, it’s become apparent that it’s virtually impossible to rid the BB01 RNA of contaminating gDNA. Will discuss with Steven and Mac if it’s feasible to exclude this from the additional PROPS analysis that needs to be done and how this could potentially affect our data. Talked to Steven and, duh, we can just remove the previous BB01 data from our analysis. Will make new batch of cDNA from existing DNased RNA samples.

qPCR – Check DNased RNA BB01 for Residual gDNA (from earlier today)

Ran qPCR on DNased RNA from earlier today to verify removal of contaminating gDNA. Used C.gigas 18s primers (SR IDs: 156, 157). 0.75uL (~50ng) of DNased RNA was used for testing. This corresponds, roughly, to the amount of sample that would be carried through to qPCR analysis of cDNA, assuming 1ug of RNA was used to make the cDNA (cDNA = 1000ng RNA/25uL = 40ng/uL, 1uL of cDNA in 25uL qPCR reaction). Positive control sample was ~25ng BB16 gDNA (from 20090519). Master mix calcs are here. Plate layout, cycling params, etc can be found in the qPCR Report (see Results). RNA was stored @ -80C in “Sam’s -80C Box”.

Results:

qPCR Report (PDF)

qPCR Data File (CFX96)

Well, this sucks. Still gDNA contamination. Will just start with original RNA again and discard this “DNased” sample.

qPCR – Check DNased RNA BB01 for Residual gDNA (from earlier today)

Ran qPCR on DNased RNA from earlier today to verify removal of contaminating gDNA. Used C.gigas 18s primers (SR IDs: 156, 157). 0.5uL (50ng) of DNased RNA was used for testing. This corresponds, roughly, to the amount of sample that would be carried through to qPCR analysis of cDNA, assuming 1ug of RNA was used to make the cDNA (cDNA = 1000ng RNA/25uL = 40ng/uL, 1uL of cDNA in 25uL qPCR reaction). Positive control sample was ~25ng BB16 gDNA (from 20090519). Master mix calcs are here. Plate layout, cycling params, etc can be found in the qPCR Report (see Results). RNA was stored @ -80C in “Sam’s -80C Box”.

Results:

qPCR Report (PDF)

qPCR Data File (CFX96)

Ugh. Still gDNA present in this sample. Hmmmm. Will consider starting from original RNA, but will precipitate this sample again and treat again to see if I can get rid of that cursed gDNA.

qPCR – Check DNased RNA BB01 & 09 (from earlier today)

Ran qPCR on DNased RNA from earlier today to verify that it was free of contaminating gDNA. Used C.gigas 18s primers (SR IDs: 156, 157). 0.5uL (50ng) of DNased RNA was used for testing. This corresponds, roughly, to the amount of sample that would be carried through to qPCR analysis of cDNA, assuming 1ug of RNA was used to make the cDNA (cDNA = 1000ng RNA/25uL = 40ng/uL, 1uL of cDNA in 25uL qPCR reaction). Positive control sample was ~25ng BB16 gDNA (from 20090519). Master mix calcs are here. Plate layout, cycling params, etc can be found in the qPCR Report (see Results). RNA was stored @ -80C in “Sam’s -80C Box”.

Results:

qPCR Report (PDF).

qPCR Data file (CFX96).

There is residual gDNA in the BB01 sample. Will EtOH precipitate and treat again.

DNased BB09 was stored @ -80C in “Mac’s Gigas DNased RNA Box #1″ (on the top shelf) with the rest of the PROPS DNased RNA.

Data Analysis – Young Lab ABI 7300 Calibration Checks

All runs (3 runs were conducted) were created using a master mix containing C.gigas gDNA (either 50ng or 100ng), 1X Promega qPCR Master Mix, 0.2uM each of forward/reverse primers (18s; Roberts SR ID: 156, 157). The master mix was mixed well and 10uL were distributed in each well of ABI plates. Plates were sealed with ABI optical adhesive covers.

It should also be noted that this analysis was only done with a single primer set and was not tested on any other qPCR machines. This can easily be done if it is desired, however I think one of the issues still being observed with the machine is sample-independent (see Results section below).

Results:

Here’s an extremely quick and dirty analysis of what these qPCR runs have revealed (across the entire plate, 3 plates of data):

Avg. Range of Cts Across Plates – 1.70

Avg. Std. Deviation of Cts Across Plates – 0.352

Based off of the graphs below (particularly the Ct vs Well Position plot), my conclusion is that the machine reads plates inaccurately in Rows A, B, C, F, G, & H. Rows D & E exhibit the most consistent well-to-well readings and, potentially, could be used for qPCR.

The entire work up (which includes a breakdown of each well position relative to each other) is here (Excel Workbook .xlsx). Below are screen captures of one of the three plates (as an example, since all looked the same) that were used for analysis of the amplification plots, melt curves and Ct vs Well Position and a quick description/assessment of what I have observed.

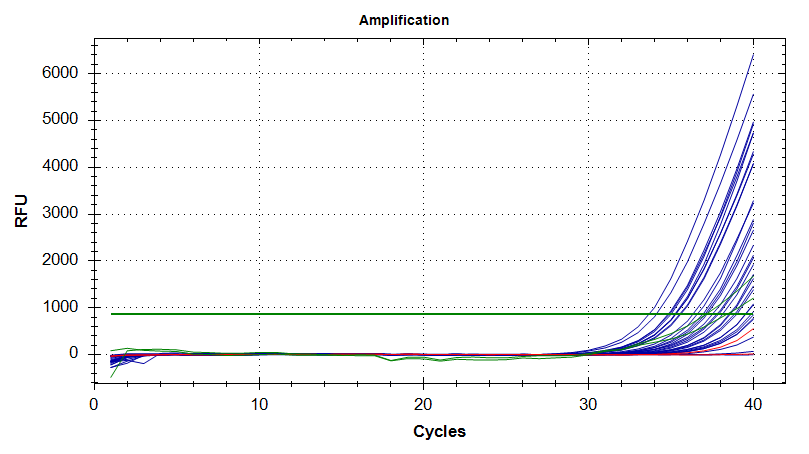
The amplification plot (below) clearly shows the type of spread in Cts across an entire plate that was observed in each run, as well as a large range in fluorescence detected (Rn) in each well.

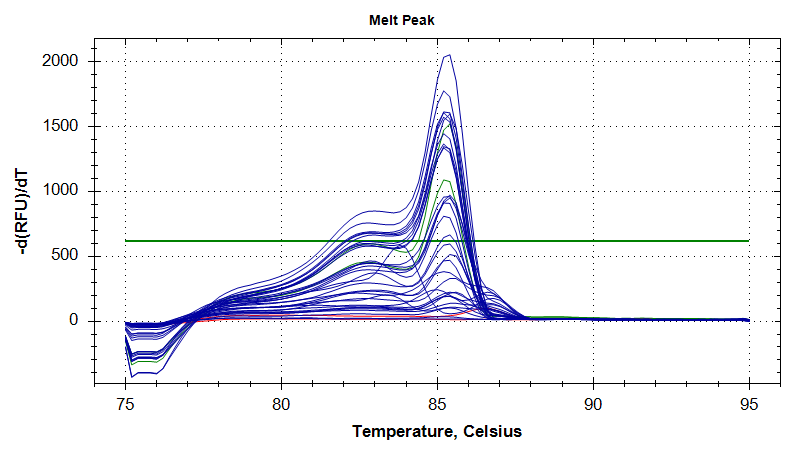
The melt curve (below) reflects the large range of detected fluorescence seen in the amplification plot. Additionally, some wells exhibit small “bumps” between 75C and 80C. This provides more evidence for a problem with well-to-well consistency.

A graph of Ct vs. Well Position (below) reveals some enlightening information. From looking at this plot, it’s clear that the machine reads from A1 to A12, then B1 to B12 (reads by row, not column) and so on. This plot reveals that most of the variation seen in Ct values occurs in the two rows closest to the edge of the plate, and within those rows, the middle wells’ Cts are more similar to the Cts observed throughout the rest of the plate.

qPCR – Test Young Lab qPCR Calibration

Recently, the Young Lab’s ABI 7300 qPCR machine was calibrated. Steven asked me to run a plate and see how well the calibration worked. Ran a plate with C.gigas gDNA and Gigas 18s primers (SR ID: 156 and 157) that are known to amplify gDNA. Master mix calcs are here (top half of page). Cycling params were as follows:

  • 95C – 10min

40 Cycles of:

  • 95C – 15s
  • 55C – 30s
  • 72C – 30s

Melt curve.

Results:

Absolutely no amplification of any kind. However, I did use one of our conventional PCR plates and not one of the ABI “prism” plates. Additionally, when I removed the plate from the machine, the plate looked as though it had been vigorously shaken:

Will repeat this qPCR with a proper ABI “prism” plate.

PCR – Test Lexie’s Mercenaria 18s contamination issue

Lexie’s PCR with this primer set and a pool of Mercenria cDNA has yielded contamination in all of her waters. Performed two sets of PCR: one with her existing primer working stocks and the other with a fresh aliquot of primer working stocks. Used my own reagents/water. PCR set up and cycling params are here. PCR ran O/N.

Results:

Lane 1 – 100bp ladder

Lane 2 – H2O (Lexie’s primer stocks)

Lane 3 – H2O (Lexie’s primer stocks)

Lane 4 – cDNA (Lexie’s primer stocks)

Lane 5 – H2O (fresh primer stocks)

Lane 6 – H2O (fresh primer stocks)

Lane 7 – cDNA (fresh primer stocks)

All water samples look clean and there’s a nice bright band in the cDNA samples. Lexie’s contamination issue is probably a technique issue and not one of reagent contamination.