Tag Archives: barcodes

Illumina Methylation Library Construction – Oly/C.gigas Bisulfite-treated DNA

Took the bisulfite-treated DNA from 20151218 and made Illumina libraries using the TruSeq DNA Methylation Library Kit (Illumina).

Quantified the completed libraries using the Qubit 3.0 dsDNA BR Kit (ThermoFisher).

Evaluated the DNA with the Bioanalyzer 2100 (Agilent) using the DNA 12000 assay. Illumina recommended using the High Sensitivity assay, but we don’t have access to that so I figured I’d just give the DNA 12000 assay a go.

SampleName IndexNumber BarCode
1NF11 1 ATCACG
1NF15 2 CGATGT
1NF16 3 TTAGGC
1NF17 4 TGACCA
2NF5 5 ACAGTG
2NF6 6 GCCAAT
2NF7 7 CAGATC
2NF8 8 ACTTGA
M2 9 GATCAG
M3 10 TAGCTT
NF2_6 11 GGCTAC
NF_18 12 CTTGTA


Results:

Library Quantification (Google Sheet): 20151221_quantification_illumina_methylation_libraries

Test Name Concentration (ng/μL)
1NF11 Out of range
1NF15 2.14
1NF16 2.74
1NF17 2.64
2NF5 2.92
2NF6 Out of range
2NF7 2.42
2NF8 2.56
M2 Out of range
M3 2.1
NF2_6 2.38
NF2_18 Out of range


I used the Qubit’s BR (broad range) kit because I wasn’t sure what concentrations to expect. I need to use the high sensitivity kit to get a better evaluation of all the samples’ concentrations.


Bioanalyzer Data File (Bioanalyzer 2100): 2100_20expert_DNA_2012000_DE72902486_2015-12-21_16-58-43.xad


Ha! Well, looks like you definitely need to use the DNA High Sensitivty assay for the Bioanalyzer to pick up anything. Although, I guess you can see a slight hump in most of the samples at the appropriate sizes (~300bp); you just have to squint. ;)

PCR – Oly RAD-seq Prep Scale PCR

Continuing with the RAD-seq library prep. Following the Meyer Lab 2bRAD protocol.
After determining the minimum number of PCR cycles to run to generate a visible, 166bp band on a gel yesterday, ran a full library “prep scale” PCR.


REAGENT SINGLE REACTION (μL) x11
Template 40 NA
ILL-HT1 (1μM) 5 55
ILL-BC# (1μM) 5 NA
NanoPure H2O 5 55
dNTPs (1mM) 20 220
ILL-LIB1 (10μM) 2 22
ILL-LIB2 (10μM) 2 22
5x Q5 Reaction Buffer 20 220
Q5 DNA Polymerase 1 11
TOTAL 100 550


Combined the following for PCR reactions:

  • 55μL PCR master mix
  • 40μL ligation mix
  • 5μL of ILL-BC# (1μM) – The barcode number and the respective sample are listed below.


SAMPLE BARCODE SEQUENCE
Oly RAD 02  1  CGTGAT
Oly RAD 03  2  ACATCG
Oly RAD 04  3  GCCTAA
Oly RAD 06  4  TGGTCA
Oly RAD 07  5  CACTGT
Oly RAD 08  6  ATTGGC
Oly RAD 14  7  GATCTG
Oly RAD 17  8  TCAAGT
Oly RAD 23  9  CTGATC
Oly RAD 30 10 AAGCTA


Cycling was performed on a PTC-200 (MJ Research) with a heated lid:

STEP TEMP (C) TIME (s)
Initial Denaturation
  • 98
  • 30
17 cycles
  • 98
  • 60
  • 72
  • 5
  • 20
  • 10


After cycling, added 16μL of 6x loading dye to each sample.

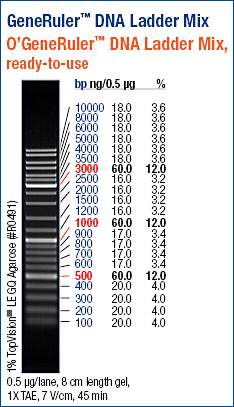
Loaded 10μL of ladder on each of the two gels.

Results:


Things looked fine. Excised the bands from each sample indicated by the green arrow. Before and after gel images show regions excised. Will purify the bands and quantify library yields.

Epinext Adaptor 1 Counts – LSU C.virginica Oil Spill Samples

Before contacting the Univ. of Oregon facility for help with this sequence demultiplexing dilemma, I contacted Epigentek to find out what the other adaptor sequence that is used in the EpiNext Post-Bisulfite DNA Library Preparation Kit (Illumina). I used grep and fastx_barcode_splitter to determine how many reads (if any) contained this adaptor sequence. All analysis was performed in the embedded Jupyter (IPython) notebook embedded below.

NBviewer: 20150317_LSU_OilSpill_EpinextAdaptor1_ID.ipynb


Results:

This adaptor sequence is not present in any of the reads in the FASTQ file analyzed.

TruSeq Adaptor Counts – LSU C.virginica Oil Spill Sequences

Initial analysis, comparing barcode identification methods, revealed the following info about demultiplexing on untrimmed sequences:

Using grep:

long barcodes: Found in ~12% of all reads

short barcodes: Found in ~25% of all reads

Using fastx_barcode_splitter:

long barcodes, beginning of line: Found in ~15% of all reads

long barcodes, end of line: Found in < 0.008% of all reads (yes, that is actually percentage)

short barcodes, beginning of line: Found in ~1.3% of all reads

short barcodes, end of line: Found in ~2.7% of all reads


Decided to determine what percentage of the sequences in this FASTQ file have just the beginning of the adaptor sequence (up to the 6bp barcode/index):

GATCGGAAGAGCACACGTCTGAACTCCAGTCAC

This was done to see if the numbers increased without the barcode index (i.e. see if majority of sequences are being generated from “empty” adaptors lacking barcodes).

The analysis was performed in a Jupyter (IPython) notebook and the notebook is linked, and embedded, below.

NBViewer: 20150316_LSU_OilSpill_Adapter_ID.ipynb


Results:

Using grep:

15% of the sequences match

That’s about 3% more than when the adaptor and barcode are searched as one sequence.

Using fastx_barcode_splitter:

beginning of line – 17% match

end of line – 0.06% match

The beginning of line matches are ~2% higher than when the adaptor and barcode are searched as one sequence.

Will contact Univ. of Oregon to see if they can shed any light and/or help with the demultiplexing dilemma we have here. Lots of sequence, but how did it get generated if adaptors aren’t present on all of the reads?

TruSeq Adaptor Identification Method Comparison – LSU C.virginica Oil Spill Sequences

We recently received Illumina HiSeq2500 data back from this project. Initially looking at the data, something seems off.  Using FASTQC, the quality drops of drastically towards the last 20 bases of the reads. We also see a high degree of Illumina TruSeq adaptor/index sequences present in our data.

Since this sequencing run was multiplexed (i.e. multiple libraries were pooled and run together on the HiSeq), we need to demultiplex our sequences before performing any trimming. Otherwise, the trimming could remove the index (barcodes) sequences from the data and prevent us from separating out the different libraries from each other.

However, it turns out, demultiplexing is not a simple, straightforward task. There are a variety of programs available and they all have different options. I decided to compare TruSeq index identification using two programs:

-grep (grep is a built-in command line (bash) program that searches through files to find matches to user-provided information.)
-fastx_barcode_splitter.pl (fastx_barcode_splitter.pl is a component of the fastx_tookit that searches through FASTQ files to identify matches to user-provided index/barcode sequences.)

The advantage(s) of using grep is that it’s extremely fast, easy to use, and already exists on most Unix-based computers (Linux, OS X), thus not requiring any software installation. The disadvantage(s) of using grep for a situation like this is that it is not amenable to allowing for mismatches and/or partial matches to the user-provided information.

The advantage(s) of using fastx_barcode_splitter.pl is that it can accept a user-defined number of mismatches and/or partial matches to the user-defined index/barcode sequences. The disadvantage(s) of using fastx_barcode_splitter.pl is that it requires the user to specify the expected location of the index/barcode sequence in the target sequence: either the beginning of the line or the end of the line. It will not search beyond the length(s) of the provided index/barcode sequences. That means if you index/barcode exists in the middle of your sequences, this program will not find it. Additionally, since this program doesn’t exist natively on Unix-based machines, it must be downloaded and installed by the user.

So, I tested both of these programs to see how they compared at matching both long (the TruSeq adaptor/index sequences identified with FASTQC) and “short” (the actual 6bp index sequence) barcodes.

To simplify testing, only a single sequence file was used from the data set.

All analysis was done in a Jupyter (IPython) notebook.

FASTQC HTML file for easier viewing of FASTQC output.

NBViewer version of embedded notebook below.


Result:

grep

long barcodes: Found in ~12% of all reads

short barcodes: Found in ~25% of all reads


fastx_barcode_splitter

long barcodes, beginning of line: Found in ~15% of all reads

long barcodes, end of line: Found in < 0.008% of all reads (yes, that is actually percentage)


short barcodes, beginning of line: Found in ~1.3% of all reads

short barcodes, end of line: Found in ~2.7% of all reads


Overall, the comparison is interesting, however, the important take home from this is that in the best-case scenario (grep, short barcodes), we’re only able to identify 25% of the reads in our sequences!

It should also be noted that my analysis only used sequences in one orientation. It would be a good idea to also do this analysis by searching with the reverse and reverse complements of these sequences.

Bisuflite NGS Library Prep – C.gigas larvae OA bisulfite DNA (continued from yesterday)

Continued Illumina library prep of bisulfite-treated DNA samples (400ppm and 1000ppm; from 20150114)  with Methylamp DNA Modification Kit (Epigentek). Performed bead clean up immediately after End Repair.

PCR cycles: 14

No other changes were made to the manufacturer’s protocol.

Epigentek Barcode Indices assigned, per their recommendations for using two libraries for multiplexing:

400ppm – barcode #6 – GCCAAT

1000ppm – barcode #12 – CTTGTA

The two libraries were stored @ -20C and will be quantified tomorrow.


Oligo Reconstitution – Illumina RNAseq Library Oligos and Barcodes

Reconstituted all of the oligos and barcodes for library construction in TE (pH = 8.0) to a final concentration of 100uM. Created 10uM working stocks of all oligos and barcodes. All samples (stocks and working stocks) are stored @ -80C in their own box (Illumina Library Oligos & Barcodes) due to the fact that one of the oligos is an RNA oligo and requires storage at -80C.