Tag Archives: gel

PCR – Oly RAD-seq Test-scale PCR

Continuing with the RAD-seq library prep. Following the Meyer Lab 2bRAD protocol.

Prior to generating full-blown libraries, we needed to run a “test-scale” PCR to identify the minimum number of cycles needed to produce the intended product size (166bp).

I ran PCR reactions on a subset (Sample #: 2, 3, & 4) of the 10 samples that I performed adaptor ligations on Friday.

PCR reactions were set up on ice in 0.5mL PCR tubes.

REAGENT SINGLE REACTION (μL) x4.4
Template 8 NA
NanoPure H2O 1 4.4
dNTPs (1mM) 4 17.6
ILL-LIB1 (10μM) 0.4 1.76
ILL-LIB2 (10μM) 0.4 1.76
ILL-HT1 (1μM) 1 4.4
ILL-BC1 (1μM) 1 4.4
5x Q5 Reaction Buffer 4 17.6
Q5 DNA Polymerase 0.2 0.88
TOTAL 20 52.8


Combined 12μL of master mix with 8μL of the ligation reaction from earlier today.

Cycling was performed on a PTC-200 (MJ Research) with a heated lid:

STEP TEMP (C) TIME (s)
Initial Denaturation
  • 98
  • 30
27 cycles
  • 98
  • 60
  • 72
  • 5
  • 20
  • 10

We’re following the “1/4 reduced representation” aspect of the protocol. As such, 5μL of each reaction was pulled immediately after the extension (72C – machine was paused) of cycles 12, 17, 22, & 27 in order to determine the ideal number of cycles to use. Also ran the ligation reactions (labeled “Ligations” on the gel below) of the samples as a pre-PCR comparison. Treated them the same as the PCR reactions: mixed 8μL of the ligation with 12μL of H2O, used 5μL of that mix to load on gel.

These samples were run on a 1x modified TAE 2% agarose gel (w/EtBr).


Results:


Test-scale PCR gel. Green arrow indicates desired band. The numbers below the headings indicate the sample number.


This looks pretty good. The green arrow on the gel indicates the desired band size (~166bp). Although difficult to see on this gel image, there is a gradient in band intensities across the cycles (band intensity increases as cycle number increases). Looks like we can use 12 cycles for our PCRs.

One other aspect of this gel that is very interesting is the ligations. The three ligation samples all show an intact high molecular weight band! This is very surprising, since the input gDNA from these three samples does not look this.
Agarose Gel – Geoduck & Olympia Oyster gDNA

Needed to assess the integrity of the newest gDNA isolated for the two genome sequencing projects: Geoduck gDNA from earlier today and Olympia oyster gDNA from 20151002.

Also needed to assess the integrity of the gDNA of ethanol-preserved Olympia oyster mantle tissue from Jake’s reciprocal transplant experiment, isolated on 20151002: samples NF1A & SN49A.

Ran samples on a 0.8% agarose, 1X modified TAE gel.

Loaded 1μL (~300ng) of the geoduck, Oly and NF1A samples.

Loaded 2μL (~100ng) of the SN49A sample.

Used 5μL of ladder.

Results:


Genome Sequencing Samples

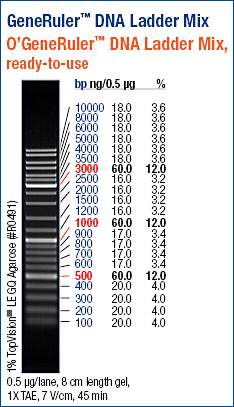
The geoduck and the Oly samples look good. Intact, high molecular weight band. My only concern is the noticeable difference in band intensities between these two. Both samples should be ~300ng/μL, based on the NanoDrop1000 readings. However, it’s evident that the concentrations of these two samples differ greatly. Additionally, we can use the ladder to gauge the concentrations of the samples, since I loaded 0.5μg of the ladder, which is the quantity referenced on the ladder guide above.

It would appear that the geoduck sample concentration is closer to 60ng/μL (band intensity is similar to that of the 500, 1000, & 3000bp markers), as opposed to the 292ng/μL that the NanoDrop1000 indicated.

The Oly sample appears to have even less and appears less intense than the lowest concentration bands on the marker (16.0ng/μL). That’s not even remotely close to the 331ng/μL measured by the NanoDrop1000.

It’s difficult to say why this might be, as both samples were RNased and neither of them show extensive smearing (both of those factors would contribute to inflated spec readings).

Regardless, will ship them off to BGI to supplement the previous gDNA for this project.

Ethanol-Preserved Samples

Both samples show extensive smearing and no high molecular weight band, indicating they are both completely degraded. This is a very bad result for this project, as the tissue in this group is/was a bit of grasping at straws to obtain some intact DNA to use for the RAD-seq that we intend to pursue.

PCR – Oly RAD-seq Test-scale PCR

Yesterday’s test scale PCR failed to produce any bands in any samples (expected size of ~166bp). This is not particularly surprising, due to the level of degradation in these samples. As such, repeated the test scale PCR, but increased the number of cycles.

Following the Meyer Lab 2bRAD protocol.

I ran PCR reactions on a the same subset of samples as yesterday (Sample #: 4, 7, 14, & 30).

PCR reactions were set up on ice in 0.5mL PCR tubes.

REAGENT SINGLE REACTION (μL) x4.4
Template 8 NA
NanoPure H2O 1 4.4
dNTPs (1mM) 4 17.6
ILL-LIB1 (10μM) 0.4 1.76
ILL-LIB2 (10μM) 0.4 1.76
ILL-HT1 (1μM) 1 4.4
ILL-BC1 (1μM) 1 4.4
5x Q5 Reaction Buffer 4 17.6
Q5 DNA Polymerase 0.2 0.88
TOTAL 20 52.8


Combined 12μL of master mix with 8μL of the ligation reaction from yesterday.

Cycling was performed on a PTC-200 (MJ Research) with a heated lid:

STEP TEMP (C) TIME (s)
Initial Denaturation
  • 98
  • 30
42 cycles
  • 98
  • 60
  • 72
  • 5
  • 20
  • 10

We’re following the “1/4 reduced representation” aspect of the protocol. As such, 5μL of each reaction was pulled immediately after the extension (72C – machine was paused) of cycles 27, 32, 37, & 42 in order to determine the ideal number of cycles to use. Also ran the ligation reactions (labelled “ligations” on the gel below) of two samples (samples #: 14 & 30) as a pre-PCR comparison.

These samples were run on a 1x modified TAE 2% agarose gel (w/EtBr).

Results:


NOTE: Today’s gel image was taken with a proper gel imager (yesterday’s gel image was captured with my phone). The 27 cycles appears similar to yesterday’s results, even though the bands are not visible on yesterdays’ gel, due to limitations of the phone’s camera sensitivity.

There are a number of bands visible on this gel.

The green arrow on the image identifies what I believe to be the proper size band (~160bp). This band is present in all four cycling groups and at similar intensities across cycling groups.

The two lower molecular weight bands are very likely primer dimers. The Meyer Lab Protocol indicates that primer dimers will likely be present at ~70bp, ~90bp, & ~133bp.

Since we’ve been following along with Katherine Silliman’s 2bRAD progress, here’s an image of her test scale PCR to compare to ours:

Katherine’s test scale PCR. Notice how much more prominent her bands are in all cycle groups, compared to my gel above.


Since this is my first foray into RAD-seq QC, I’m not certain whether or not our test scale PCRs indicate any level of success. I will consult with Katherine and Steven about what they think. Since we’re on a timeline, and we’re just testing the viability of this whole process, I suspect Steven will have me proceed and see how things turnout.

PCR – Oly RAD-seq Test-scale PCR

Continuing with the RAD-seq library prep. Following the Meyer Lab 2bRAD protocol.

Prior to generating full-blown libraries, we need to run a “test-scale” PCR to identify the minimum number of cycles needed to produce the intended product size (166bp).

I ran PCR reactions on a subset (Sample #: 4, 7, 14, & 30) of the 10 samples that I performed adaptor ligations on earlier today.

All components were stored on ice.

dNTPs – 1mM working stock was made

  • 10μL dNTPs (10mM)
  • 90μL NanoPure H2O


ILL-LIB1 & 2 – 10μM working stocks were made

  • 10μL ILL-LIB1 or -LIB2 (100μM)
  • 90μL NanoPure H2O


ILL-HT1 & 2 – 1μM working stocks were made

  • 1μL ILL-HT1 or -HT2 (100μM)
  • 99μL NanoPure H2O


ILL-BC1 – 1μM working stock was made

  • 1μL ILL-BC1 (100μM)
  • 99μL NanoPure H2O


PCR reactions were set up on ice in 0.5mL PCR tubes.

REAGENT SINGLE REACTION (μL) x4.4
Template 8 NA
NanoPure H2O 1 4.4
dNTPs (1mM) 4 17.6
ILL-LIB1 (10μM) 0.4 1.76
ILL-LIB2 (10μM) 0.4 1.76
ILL-HT1 (1μM) 1 4.4
ILL-BC1 (1μM) 1 4.4
5x Q5 Reaction Buffer 4 17.6
Q5 DNA Polymerase 0.2 0.88
TOTAL 20 52.8


Combined 12μL of master mix with 8μL of the ligation reaction from earlier today.

Cycling was performed on a PTC-200 (MJ Research) with a heated lid:

STEP TEMP (C) TIME (s)
Initial Denaturation
  • 98
  • 30
27 cycles
  • 98
  • 60
  • 72
  • 5
  • 20
  • 10

We’re following the “1/4 reduced representation” aspect of the protocol. As such, 5μL of each reaction was pulled immediately after the extension (72C – machine was paused) of cycles 12, 17, 22, & 27 in order to determine the ideal number of cycles to use. Also ran the ligation reactions (labelled “Digests” on the gel below) of two samples (samples #: 4 & 7) as a pre-PCR comparison.

These samples were run on a 1x modified TAE 2% agarose gel (w/EtBr).


Results:


The results aren’t great. No band(s) visible in any samples at even the highest cycle number (27 cycles). Although, if you squint pretty hard, an extremely faint band might be visible in between the 100/200bp markers in the 27 cycles group.

Regardless, the PCRs will need to be repeated with an increased number of cycles. This is not terribly surprising, as the Meyer Lab protocol indicates that degraded samples will likely need a greater number of cycles than what they recommend and that cycle number will have to be determined empirically.


Agarose Gel – Geoduck & Olympia oyster gDNA Integrity Check

Ran a 0.8% agarose, 1x modified TAE gel (w/EtBr) with geoduck and Olympia oyster gDNA that was precipitated earlier today. Used 5μL of each sample (~500ng).

Results:

Geoduck gDNA on left. Oly gDNA on right.


Overall, the DNA still looks very good. Slight smearing (indicating slight degradation), but the high molecular weight band is very prominent. Will fill out the necessary BGI forms and ship samples out on Monday.


Agarose Gel – Olympia oyster Whole Body gDNA Integrity Check

Ran the gDNA isolated yesterday from Ostrea lurida whole body on a 0.8% modified TAE gel (w/EtBr) to assess gDNA integrity. Used 1μL of each sample.


Results:

The results are not good. Every sample exhibits serious degradation (the smearing that’s present in each lane). There should be a distinct, high molecular weight band with no smearing if the gDNA was high quality and intact. These extractions also served as a comparison in slight differences in the extraction procedure (homogenization with & without mortar/pestle), as described in Steven’s post. However, those differences seem to have no impact on the quality of the resulting gDNA.

I isolated gDNA from Ostrea lurida tissue samples two weeks ago using the E.Z.N.A. Mollusc DNA Kit (Omega Bio-Tek) and didn’t see this level of degradation. Additionally, Katherine Silliman used the E.Z.N.A. Mollusc DNA Kit to isolate gDNA from Ostrea lurida larvae and obtained high quality gDNA in virtually all of her samples. Below is my gel and Katherine’s gel for quick comparison to the one above:

Ostrea lurida gDNA isolated from adductor muscle & mantle tissues (lanes 4 & 5). Despite low quantity loading, notice that smearing below high molecular weight bands is limited to a low molecular weight range.

Katherine’s gel of Ostrea lurida gDNA isolated from larvae.


I can’t be certain what is causing this issue. We previously had this same issue with a different group of Ostrea lurida whole body gDNA isolations (using a DNeasy Blood & Tissue Kit [Qiagen]). Two different kits using whole bodies and both sets of extractions have produced similarly bad results. It’s certainly possible that some nastiness (that’s a scientific term, btw) is being introduced by using whole body instead of specific tissues.

Another possible contributor to the DNA degradation we’ve seen is how the samples were collected and stored. I’m not up-to-date on exactly how the preservation was accomplished, but I do know that the Ostrea lurida whole body samples I previously worked with were just masses of black when I removed them from shells/tubes for isolation. So, in that case, it wasn’t terribly surprising that that the gDNA obtained from those was degraded. It should also be noted that Katherine’s extraction were from whole larvae that had been stored in RNAlater. Although a direct comparison cannot be made due to the difference in developmental stage between Katherine’s samples and these, it lends some evidence to the possibility that sample collection/storage is a contributor to the degraded gDNA we’re obtaining from whole body oyster extractions. However, with that being said, I’m not sure what the collection and storage background is on this particular set of samples.

Agarose Gel – Geoduck gDNA Integrity Check

Ran 0.8% agarose 1x modified TAE gel stained with EtBr to assess the integrity of geoduck gDNA isolated earlier today.

Ran ~500ng of each sample:

Geoduck adductor muscle 1: 4μL


Results:


The gDNA looks really good with a prominent high molecular weight band and little smearing.

Will proceed with pooling all accumulated geoduck gDNA for this project.

Agarose Gel – Geoduck & Olympia Oyster gDNA Integrity Check

Ran 0.8% agarose 1x modified TAE gel stained with EtBr to assess the integrity of geoduck gDNA and Olympia oyster gDNA isolated earlier today.

Ran ~500ng of each sample:

Geoduck adductor muscle 1: 6.8μL

Geoduck adductor muscle 2: 20μL (260ng)

Geoduck foot 1: 16.6μL

Geoduck foot 2: 20μL (200ng)

Oly adductor muscle: 4μL

Oly mantle: 4.7μL

Results:


The gel is loaded in the order listed above (going left to right on the gel).

All samples look really good with prominent high molecular weight bands and little smearing.

Agarose Gel – Geoduck & Olympia Oyster gDNA Integrity Check

Ran 0.8% agarose 1x modified TAE gel stained with EtBr to assess the integrity of geoduck gDNA and Olympia oyster gDNA isolated yesterday.

Ran ~500ng of each sample:

Geoduck adductor muscle 1: 4.4μL

Geoduck adductor muscle 2: 20μL (355ng)

Geoduck foot 1: 20μL

Geoduckk foot 2: 6.9μL

Oly adductor muscle: 5.5μL

Oly mantle: 3.05μL

Results:


The gel is loaded in the order listed above (going left to right on the gel).

All samples look really good with prominent high molecular weight bands and little smearing.

Current total approximate yields from all extractions from both species are as follows:

Geoduck: 49.8μg

Olympia oyster: 54.1μg

Still need ~25μg of each species to have sufficient quantities for sequencing.

Agarose Gel – Geoduck & Olympia Oyster gDNA Integrity Check

Ran 0.8% agarose 1x modified TAE gel stained with EtBr to assess the integrity of geoduck gDNA (from 20150828) and Olympia oyster gDNA (from 20150901).

Ran 500ng of each sample:

Geoduck adductor muscle: 4.87μL

Geoduck foot: 4.50μL

Oly adductor muscle: 4.22μL

Oly mantle: 2.51μL

Results:


The gel was loaded in the same order as the sample volumes listed above.

The gel is a bit disappointing.

Geoduck adductor

High molecular weight band present, but extremely faint. Not too much smearing, but accumulation of low molecular weight smudge suggests residual RNA. This is despite the fact that the kit used for isolation (E.Z.N.A. Mollusc DNA Kit) has a RNase treatment. This residual RNA could explain why the amount loaded on the gel appears to be so little compared to other samples (the RNA is contributing to the absorbance at 260nm, thus inflating the calculated concentration of gDNA).

Geoduck foot

High molecular weight band present and bright. Some smearing (i.e. degradation) present, along with degarded DNA visible at ~500bp. This sample may require a Bioanalyzer run to accurately quantify the high molecular weight DNA, as the lower molecular weight DNA (i.e. degarded DNA) is “artificially” inflating the concentration of the DNA in the sample.

Oly adductor

High molecular weight band present and bright. Some smearing (i.e. degradation) present, along with degarded DNA visible at ~500bp. This sample may require a Bioanalyzer run to accurately quantify the high molecular weight DNA, as the lower molecular weight DNA (i.e. degarded DNA) is “artificially” inflating the concentration of the DNA in the sample.

Oly mantle

High molecular weight band present, but extremely faint. Some smearing and a smudge around 500bp, indicating degraded DNA. The low visibility of this sample on the gel suggests that the concentration determined by the NanoDrop1000 is inaccurate. However, unlike the geoduck adductor sample, it doesn’t appear that RNA carryover is responsible, as there is no noticeable low molecular weight (~100bp) smudge.


Overall, the geoduck foot and the Oly adductor samples are likely usable. Currently awaiting clarification from BGI for DNA quantity requirements for the genome sequencing of these two species.