Tag Archives: RAD-seq

Restriction Digest – Oly gDNA for RAD-seq w/AlfI

The previous attempt at making these RAD libraries failed during the prep-scale PCR, likely due to a discrepancy in the version of the Meyer Lab protocol I was following, so I have to start at the beginning to try to make these libraries again.

Since the input DNA is so degraded, I’ve repeated this using 9μg of input DNA (instead of the recommended 1.2μg). This should increase the number of available cleavage sites for AlfI, thus improving the number of available ligation sites for the adaptors.

Used a subset (10 samples) from the Ostrea lurida gDNA isolated 20150916 to prepare RAD libraries.

Followed the 2bRAD protocol (PDF) developed by Eli Meyer’s lab.

Prepared 9.0μg of each of the following samples in a volume of 9.5μL:

Google Sheet: 20151028_RADseq_DNA_calcs


Prepared master mix for restriction enzyme reaction:

REAGENT SINGLE REACTION (μL) x11
DNA 9.5 NA
10x Buffer R 1.2μL 13.2μL
150μM SAM 0.8μL 8.8μL
AlfI 0.5μL 5.5μL


Combined 2.5μL of the master mix with 9.5μL of each DNA sample in 0.5mL snap cap tubes. Incubated @ 37C O/N in thermal cycler (PTC-200; no heated lid).

Troubleshooting – Oly RAD-seq

After the failure of the prep-scale PCR for the RAD library construction, Katherin Silliman pointed out a potential problem (too much dNTPs). This was odd because I was following the Meyer Protocol and I used what was indicated.

Oddly, it turns out that Katherine’s version of the Meyer Lab 2bRAD protocol differed from what I had download. To add to the confusion, both protocols have the same file name. Here’s what I’m talking about:


The file on the left is the one I was using and the one on the right is the file Katherine is using (NOTE: The file name’s aren’t exact because they were saved to the same directory and the numbers in the parentheses were appended to the file name automatically)

I’ve updated our copy of the protocol in our GitHub account. However, Katherine informed me that she’s just been pulling up the Meyer Lab page to reference the protocol. So, it’s possible they made a change to the file after I initially downloaded it, but the change wasn’t indicated in the file name.

http://people.oregonstate.edu/~meyere/docs/

However, when discussing with Katherine, she made a good point and said she just scaled up the test-scale PCR. Since the test-scale PCR was successful, she didn’t see a need to make any changes.

Will try this procedure again with the correct protocol; probably by scaling up the test-scale PCR.

PCR – Oly RAD-seq Prep Scale PCR

Continuing with the RAD-seq library prep. Following the Meyer Lab 2bRAD protocol.

After determining the minimum number of PCR cycles to run to generate a visible, 166bp band on a gel yesterday, ran a full library “prep scale” PCR.


REAGENT SINGLE REACTION (μL) x11
Template 40 NA
ILL-HT1 (1μM) 5 NA
ILL-BC# (1μM) 5 NA
NanoPure H2O 5 55
dNTPs (10mM) 20 220
ILL-LIB1 (10μM) 2 22
ILL-LIB2 (10μM) 2 22
5x Q5 Reaction Buffer 20 220
Q5 DNA Polymerase 1 11
TOTAL 100 550


Combined the following for PCR reactions:

  • 50μL PCR master mix
  • 40μL ligation mix
  • 5μL of ILL-HT1 (1μM)
  • 5μL of ILL-BC# (1μM) – The barcode number and the respective sample are listed below.

NOTE: Samples 02, 03, & 04 did not have 40μL of the ligation reaction left (only 32μL) due to additional usage in the test scale PCR yesterday. Supplemented those three reactions with 8μL of H2O to bring them to 100μL.


SAMPLE BARCODE SEQUENCE
Oly RAD 02  1  CGTGAT
Oly RAD 03  2  ACATCG
Oly RAD 04  3  GCCTAA
Oly RAD 06  4  TGGTCA
Oly RAD 07  5  CACTGT
Oly RAD 08  6  ATTGGC
Oly RAD 14  7  GATCTG
Oly RAD 17  8  TCAAGT
Oly RAD 23  9  CTGATC
Oly RAD 30 10 AAGCTA


Cycling was performed on a PTC-200 (MJ Research) with a heated lid:

STEP TEMP (C) TIME (s)
Initial Denaturation
  • 98
  • 30
12 cycles
  • 98
  • 60
  • 72
  • 5
  • 20
  • 10


After cycling, added 16μL of 6x loading dye to each sample.

Due to limitations in available comb sizes and inability to combine combs to make larger well sizes, only loaded 58μL of samples in each well on this gel. Will load remainder on a second gel and combine after PCR products are purified.

Results:


Well, this is lame. There are absolutely no PCR products on this gel. In fact, this just looks like big smears of degraded DNA. I was expecting an amplicon of ~166bp to cut out of the gel. Based off of the test scale PCR from yesterday, everything should have been hunky dory. Not really sure what to think about this…

PCR – Oly RAD-seq Test-scale PCR

Continuing with the RAD-seq library prep. Following the Meyer Lab 2bRAD protocol.

Prior to generating full-blown libraries, we needed to run a “test-scale” PCR to identify the minimum number of cycles needed to produce the intended product size (166bp).

I ran PCR reactions on a subset (Sample #: 2, 3, & 4) of the 10 samples that I performed adaptor ligations on Friday.

PCR reactions were set up on ice in 0.5mL PCR tubes.

REAGENT SINGLE REACTION (μL) x4.4
Template 8 NA
NanoPure H2O 1 4.4
dNTPs (1mM) 4 17.6
ILL-LIB1 (10μM) 0.4 1.76
ILL-LIB2 (10μM) 0.4 1.76
ILL-HT1 (1μM) 1 4.4
ILL-BC1 (1μM) 1 4.4
5x Q5 Reaction Buffer 4 17.6
Q5 DNA Polymerase 0.2 0.88
TOTAL 20 52.8


Combined 12μL of master mix with 8μL of the ligation reaction from earlier today.

Cycling was performed on a PTC-200 (MJ Research) with a heated lid:

STEP TEMP (C) TIME (s)
Initial Denaturation
  • 98
  • 30
27 cycles
  • 98
  • 60
  • 72
  • 5
  • 20
  • 10

We’re following the “1/4 reduced representation” aspect of the protocol. As such, 5μL of each reaction was pulled immediately after the extension (72C – machine was paused) of cycles 12, 17, 22, & 27 in order to determine the ideal number of cycles to use. Also ran the ligation reactions (labeled “Ligations” on the gel below) of the samples as a pre-PCR comparison. Treated them the same as the PCR reactions: mixed 8μL of the ligation with 12μL of H2O, used 5μL of that mix to load on gel.

These samples were run on a 1x modified TAE 2% agarose gel (w/EtBr).


Results:


Test-scale PCR gel. Green arrow indicates desired band. The numbers below the headings indicate the sample number.


This looks pretty good. The green arrow on the gel indicates the desired band size (~166bp). Although difficult to see on this gel image, there is a gradient in band intensities across the cycles (band intensity increases as cycle number increases). Looks like we can use 12 cycles for our PCRs.

One other aspect of this gel that is very interesting is the ligations. The three ligation samples all show an intact high molecular weight band! This is very surprising, since the input gDNA from these three samples does not look this.

Adaptor Ligation – Oly AlfI-Digested gDNA for RAD-seq

Continued to follow the 2bRAD protocol (PDF) developed by Eli Meyer’s lab.

Digested DNA from earlier today was not run out on a gel due to the fact that the input gDNA was degraded and a shift in the high molecular weight band (indicating the digestion was successful) would not exist because a high molecular weight band is absent in these samples.


Anneal Adaptors

After preparing the two adaptors below, they were incubated for 10mins @ RT:

  • Adaptor 1 (2μM final concentration of each oligo): 1.5μL of 5ILL-NR (100μM) + 1.5μL of anti-ILL (100μM) + 72μL H2O = 75μL total
  • Adaptor 2 (2μM final concentration of each oligo): 1.5μL of 3ILL-NR (100μM) + 1.5μL of anti-ILL (100μM) + 72μL H2O = 75μL total

After annealing, the adaptors were stored on ice.


Adaptor Ligation

All components were stored on ice. Ligation reactions were prepared on ice and performed in 0.5mL snap cap tubes.

REAGENT SINGLE REACTION (μL) x11
Digested DNA 10 NA
ATP (10mM) 1 11
10x T4 Ligase Buffer 4 44
Adaptor 1 (2μM) 5 55
Adaptor 2 (2μM) 5 55
T4 DNA Ligase 1 11
NanoPure H2O 24 264
TOTAL 50 440

Combined 40μL of the master mix with 10μL of AlfI-digested DNA in a 0.5mL snap cap tube.

Incubated ligation reaction @ 16C for 3hrs in PTC-200 thermal cycler (MJ Research) – no heated lid.

Ligations were stored @ -20C until I can continue working with them on Monday.

Restriction Digest – Oly gDNA for RAD-seq w/AlfI

Previously initiated the RAD-seq procedure for the sample set described below. However, the test scale PCR yielded poor results. Katherine Silliman suggested that the poor performance of the test scale PCR was likely due to low numbers of adaptor-ligated fragments. Since the input DNA is so degraded, I’ve repeated this using 9μg of input DNA (instead of the recommended 1.2μg). This should increase the number of available cleavage sites for AlfI, thus improving the number of available ligation sites for the adaptors.

Used a subset (10 samples) from the Ostrea lurida gDNA isolated 20150916 to prepare RAD libraries.

Followed the 2bRAD protocol (PDF) developed by Eli Meyer’s lab.

Prepared 9.0μg of each of the following samples in a volume of 10μL:

Google Sheet: 20151009_RADseq_DNA_calcs


Prepared a 150μM working stock of the SAM buffer needed for the restriction digestion by diluting 30μL of the supplied stock (500μM) in 70μL NanoPure H2O (total volume = 100μL). This working stock was stored @ -20C in FTR 209 in the “RAD-seq Reagents” box.

Prepared master mix for restriction enzyme reaction:

REAGENT SINGLE REACTION (μL) x11
DNA 8 NA
10x Buffer R 1.2μL 13.2μL
150μM SAM 0.8μL 8.8μL
AlfI 0.5μL 5.5μL
H2O 1.5μL 16.5μL


Combined 4μL of the master mix with 8μL of each sample in 0.5mL snap cap tubes. Incubated @ 37C 2hrs. in thermal cycler (PTC-200; no heated lid). Heat inactivated the digest @ 65C for 10mins.

PCR – Oly RAD-seq Test-scale PCR

Yesterday’s test scale PCR failed to produce any bands in any samples (expected size of ~166bp). This is not particularly surprising, due to the level of degradation in these samples. As such, repeated the test scale PCR, but increased the number of cycles.

Following the Meyer Lab 2bRAD protocol.

I ran PCR reactions on a the same subset of samples as yesterday (Sample #: 4, 7, 14, & 30).

PCR reactions were set up on ice in 0.5mL PCR tubes.

REAGENT SINGLE REACTION (μL) x4.4
Template 8 NA
NanoPure H2O 1 4.4
dNTPs (1mM) 4 17.6
ILL-LIB1 (10μM) 0.4 1.76
ILL-LIB2 (10μM) 0.4 1.76
ILL-HT1 (1μM) 1 4.4
ILL-BC1 (1μM) 1 4.4
5x Q5 Reaction Buffer 4 17.6
Q5 DNA Polymerase 0.2 0.88
TOTAL 20 52.8


Combined 12μL of master mix with 8μL of the ligation reaction from yesterday.

Cycling was performed on a PTC-200 (MJ Research) with a heated lid:

STEP TEMP (C) TIME (s)
Initial Denaturation
  • 98
  • 30
42 cycles
  • 98
  • 60
  • 72
  • 5
  • 20
  • 10

We’re following the “1/4 reduced representation” aspect of the protocol. As such, 5μL of each reaction was pulled immediately after the extension (72C – machine was paused) of cycles 27, 32, 37, & 42 in order to determine the ideal number of cycles to use. Also ran the ligation reactions (labelled “ligations” on the gel below) of two samples (samples #: 14 & 30) as a pre-PCR comparison.

These samples were run on a 1x modified TAE 2% agarose gel (w/EtBr).

Results:
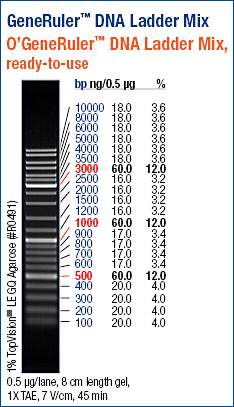


NOTE: Today’s gel image was taken with a proper gel imager (yesterday’s gel image was captured with my phone). The 27 cycles appears similar to yesterday’s results, even though the bands are not visible on yesterdays’ gel, due to limitations of the phone’s camera sensitivity.

There are a number of bands visible on this gel.

The green arrow on the image identifies what I believe to be the proper size band (~160bp). This band is present in all four cycling groups and at similar intensities across cycling groups.

The two lower molecular weight bands are very likely primer dimers. The Meyer Lab Protocol indicates that primer dimers will likely be present at ~70bp, ~90bp, & ~133bp.

Since we’ve been following along with Katherine Silliman’s 2bRAD progress, here’s an image of her test scale PCR to compare to ours:

Katherine’s test scale PCR. Notice how much more prominent her bands are in all cycle groups, compared to my gel above.


Since this is my first foray into RAD-seq QC, I’m not certain whether or not our test scale PCRs indicate any level of success. I will consult with Katherine and Steven about what they think. Since we’re on a timeline, and we’re just testing the viability of this whole process, I suspect Steven will have me proceed and see how things turnout.

PCR – Oly RAD-seq Test-scale PCR

Continuing with the RAD-seq library prep. Following the Meyer Lab 2bRAD protocol.

Prior to generating full-blown libraries, we need to run a “test-scale” PCR to identify the minimum number of cycles needed to produce the intended product size (166bp).

I ran PCR reactions on a subset (Sample #: 4, 7, 14, & 30) of the 10 samples that I performed adaptor ligations on earlier today.

All components were stored on ice.

dNTPs – 1mM working stock was made

  • 10μL dNTPs (10mM)
  • 90μL NanoPure H2O


ILL-LIB1 & 2 – 10μM working stocks were made

  • 10μL ILL-LIB1 or -LIB2 (100μM)
  • 90μL NanoPure H2O


ILL-HT1 & 2 – 1μM working stocks were made

  • 1μL ILL-HT1 or -HT2 (100μM)
  • 99μL NanoPure H2O


ILL-BC1 – 1μM working stock was made

  • 1μL ILL-BC1 (100μM)
  • 99μL NanoPure H2O


PCR reactions were set up on ice in 0.5mL PCR tubes.

REAGENT SINGLE REACTION (μL) x4.4
Template 8 NA
NanoPure H2O 1 4.4
dNTPs (1mM) 4 17.6
ILL-LIB1 (10μM) 0.4 1.76
ILL-LIB2 (10μM) 0.4 1.76
ILL-HT1 (1μM) 1 4.4
ILL-BC1 (1μM) 1 4.4
5x Q5 Reaction Buffer 4 17.6
Q5 DNA Polymerase 0.2 0.88
TOTAL 20 52.8


Combined 12μL of master mix with 8μL of the ligation reaction from earlier today.

Cycling was performed on a PTC-200 (MJ Research) with a heated lid:

STEP TEMP (C) TIME (s)
Initial Denaturation
  • 98
  • 30
27 cycles
  • 98
  • 60
  • 72
  • 5
  • 20
  • 10

We’re following the “1/4 reduced representation” aspect of the protocol. As such, 5μL of each reaction was pulled immediately after the extension (72C – machine was paused) of cycles 12, 17, 22, & 27 in order to determine the ideal number of cycles to use. Also ran the ligation reactions (labelled “Digests” on the gel below) of two samples (samples #: 4 & 7) as a pre-PCR comparison.

These samples were run on a 1x modified TAE 2% agarose gel (w/EtBr).


Results:


The results aren’t great. No band(s) visible in any samples at even the highest cycle number (27 cycles). Although, if you squint pretty hard, an extremely faint band might be visible in between the 100/200bp markers in the 27 cycles group.

Regardless, the PCRs will need to be repeated with an increased number of cycles. This is not terribly surprising, as the Meyer Lab protocol indicates that degraded samples will likely need a greater number of cycles than what they recommend and that cycle number will have to be determined empirically.


Adaptor Ligation – Oly AlfI-Digested gDNA for RAD-seq

Yesterday’s AlfI over night restriction digest was heat inactivated by heating @ 65C for 10mins. Samples were stored on ice.

Continued to follow  the 2bRAD protocol (PDF) developed by Eli Meyer’s lab.

Digested DNA was not run out on a gel due to the fact that the input gDNA was degraded and a shift in the high molecular weight band (indicating the digestion was successful) would not exist because a high molecular weight band is absent in these samples.

The following oligos were reconstituted in TE buffer (pH = 8.0) to 100μM:

  • 3ILL-NR
  • 5ILL-NR
  • anti-ILL
  • ILL-BC1 (Barcode sequence: CGTGAT)
  • ILL-HT1 (Barcode sequence: ATGCAT)
  • ILL-HT2 (Barcode sequence: CGTACG)
  • ILL-LIB1
  • ILL-LIB2

Anneal Adaptors

After preparing the two adaptors below, they were incubated for 10mins @ RT:

  • Adaptor 1 (2μM final concentration of each oligo): 1.5μL of 5ILL-NR (100μM) + 1.5μL of anti-ILL (100μM) + 72μL H2O = 75μL total
  • Adaptor 2 (2μM final concentration of each oligo): 1.5μL of 3ILL-NR (100μM) + 1.5μL of anti-ILL (100μM) + 72μL H2O = 75μL total

After annealing, the adaptors were stored on ice.


Adaptor Ligation

All components were stored on ice. Ligation reactions were prepared on ice and performed in 0.5mL snap cap tubes.

REAGENT SINGLE REACTION (μL) x11
Digested DNA 10 NA
ATP (10mM) 1 11
10x T4 Ligase Buffer 4 44
Adaptor 1 (2μM) 5 55
Adaptor 2 (2μM) 5 55
T4 DNA Ligase 1 11
NanoPure H2O 24 264
TOTAL 50 440

Added 40μL of the master mix to each tube of AlfI-digested DNA (12μL). NOTE: I made a mistake here. I should have only combined 10μL of DNA with the 40μL of master mix for each. My mistake was due, in part, to the way the Meyer Lab 2bRAD protocol is written. In the Digestion section of the protocol, Step 5 (run 2μL of the digests on a gel) is listed as optional. However, in Step 2a of the Ligation section, it says to add the “remaining 10μL of digested DNA”. The use of the word “remaining” in this instance is misleading because it implies to use all that’s left in the tube.

Incubated ligation reaction @ 16C for 3hrs in PTC-200 thermal cycler (MJ Research) – no heated lid.

Transferred tubes to ice while preparing subsequent

Restriction Digest – Oly gDNA for RAD-seq w/AlfI

Used a subset (10 samples) from the Ostrea lurida gDNA isolated 20150916 to prepare RAD libraries. This will be done to assess whether or not these samples, which appear to be heavily degraded, are viable for RAD-seq.

Followed the 2bRAD protocol (PDF) developed by Eli Meyer’s lab.

Prepared 1.2μg of each of the following samples in a volume of 10μL:

Google Sheet: 20150930_RADseq_DNA_calcs


Prepared a 150μM working stock of the SAM buffer needed for the restriction digestion by diluting 30μL of the supplied stock (500μM) in 70μL NanoPure H2O (total volume = 100μL). This working stock was stored @ -20C in FTR 209 in the “RAD-seq Reagents” box.

Prepared master mix for restriction enzyme reaction:

REAGENT SINGLE REACTION (μL) x11
DNA 8 NA
10x Buffer R 1.2μL 13.2μL
150μM SAM 0.8μL 8.8μL
AlfI 0.5μL 5.5μL
H2O 1.5μL 16.5μL


Combined 4μL of the master mix with 8μL of each sample in 0.5mL snap cap tubes. Incubated @ 37C O/N in thermal cycler (no heated lid).