Tag Archives: Rondolino

Titrations – Yaamini’s Seawater Samples

All data is deposited in the following GitHub repo:

Sample sizes: ~50g

LabX Method:

Daily pH calibration data file:

Daily pH log file:

Titrant batch:

CRM Batch:

Daily CRM data file:

Sample data file(s):

See metadata file for sample info (including links to master samples sheets):

Titrations – Yaamini’s Seawater Samples

All data is deposited in the following GitHub repo:

Sample sizes: ~50g

LabX Methods:

Daily pH calibration data file:

Daily pH log file:

Titrant batch:

CRM Batch:

Daily CRM data file:

Sample data file(s):

See metadata file for sample info (including links to master samples sheets):

Titrations – Hollie’s Seawater Samples

All data is deposited in the following GitHub repo:

Sample sizes: ~50g

LabX Method:

Daily pH calibration data file:

Daily pH log file:

Titrant batch:

CRM Batch:

Daily CRM data file:

Sample data file(s):

See metadata file for sample info (including links to master samples sheets):

Titrations – Hollie’s Seawater Samples

Performed total alkalinity (TA) titrations on Hollie’s samples using our T5 Excellence titrator (Mettler Toledo) and Rondolino sample changer.

All data is deposited in the following GitHub repo:

Sample sizes: ~50g

LabX Titration Method:

Daily pH calibration data file:

Daily pH log file:

Titrant batch:

CRM Batch:

Daily CRM data file:

Sample data file(s):

See metadata file for sample info (including links to master sample info sheets):

Progress Report – Titrator

I’ll begin this entry with a TL;DR (becuase it’s definitely a very long read):

  • Sample weight (i.e. volume) appears to have an effect on total alkalinity (TA) determination, despite the fact that sample weight is taken into account when calculating TA.

  • Replicates are relatively consistent.

  • Our TA measurements of CO2 Reference Materials (CRMs) do not match TA info supplied with CRMs.

  • Conclusions?

    • The only thing that actually matters is consistent replicates.
    • Use 50g (i.e. 50mL) sample weights – will greatly conserve reagents (CRMs, acid)
    • Calculate offset from CRMs or just report our TA measurements and the corresponding CRM TA value(s)?
    • Ask Hollie Putnam what she thinks.

With that out of the way, here’s a fairly lengthy overview of what has been done to date with the titrator. In essence, this is a cumulative notebook entry of all the entries I should have been doing on a daily/weekly basis (I actually feel much shame for neglecting this – it’s a terrible practice and an even worse example for other lab members).

Teaser: there are graphs!

Anyway, I’ve spent a lot of time getting our titrator, protocols, and scripts to a point where we can not only begin collecting real data, but also actually analyze the data in a semi-automated way.

More recently, I’ve finally started taking some measurements to assess the consistency of the actual titrator and stumbled across an interesting observation that may (may not) have an impact on how we proceed with sample/data handling.


Protocols

Titrator SOP is the primary protocol that encompasses setting up/shutting down the titrator, use of the LabX software needed for recording/exporting data from the titrator, and how to implement the necessary scripts to handle the exported data is still in early stages.

In theory, the SOP should be rather straightforward, but due to the sensitivity involved with these measurements, the SOP needs to carefully address how to set things up properly, provide a means for documenting startup/shutdown procedures, and provide troubleshooting assistance (e.g. how to empty/remove burette if/when air bubbles develop).

Overall, it’s a bit of a beast, albeit and important one, but I’ve put it on the back burner in order to focus my efforts/time on getting to the point of being able to collect data from the titrator and feel confident that we’re getting good readings.

Once I get to that point and am able to begin running samples, I’ll be able to dedicate more time to fleshing out the SOP, including adding pictures of all the components.


Scripts

parsing_TA_output.R is the script that has consumed the majority of my titrator-related time in the last couple of weeks. It is fully functional (it only requires manual entry of the exported LabX data file location). However, I’m hoping to eventually automate this as well – i.e. when new LabX export file appears, this script will execute. I won’t be spending much time on this aspect of the script until I

This has been my highest priority. Without having this script in a usable state, it has been a MAJOR slog to manually retrieve the appropriate data necessary to use in TA determination.

This also has been my biggest challenge with the titrator process. Here are just some of the hurdles I’ve had to deal with in putting this script together:

  • “learning” R
  • handling “dynamic” titrator output data
    • this is not an easy task for a non-programmer!
    • the output data is of differing numbers of rows from sample to sample, so the script had to be able to handle this aspect automatically
    • making the script “flexible” (i.e. no “magic numbers”) to handle any number of samples without the user having to manually modify the script
    • making th script “flexible” by operating on column names instead of column numbers, since column numbers were/are not constant, depending on changes to the script
  • calculations resulting from two-part titration
    • still not sure if I ever would’ve figured this out if I hadn’t taken the intro computer science class at UW a couple of years ago!

Despite all of this, I also feel like it’s one of my biggest accomplishments! It’s super satisfying to have this script functioning with virtually no user input required!

pH_calibration_check.R is still a work in progess, but is easily usable. Currently, it still has some hard-coded values (row numbers) in it for parsing data, but that should be easy to fix after what I went through with the TA parsing script!

Eventually, these two scripts will work in tandem, with the pH_calibration_check script exporting data to a daily “log” file, which the parsing_TA_output script will use to read-in the necessary pH data.

TA_calculation.R will calculate the TA values, but currently requires fully manual data entry. It desperately needs attention and will likely be my primary focus in the immediate future, due to the need to have TA values for actual samples, as well as daily quality control checks (e.g. verify CRM measurements look OK before measuring actual samples).


Measurements

Consistency checks with Instant Ocean
Instant Ocean Tests

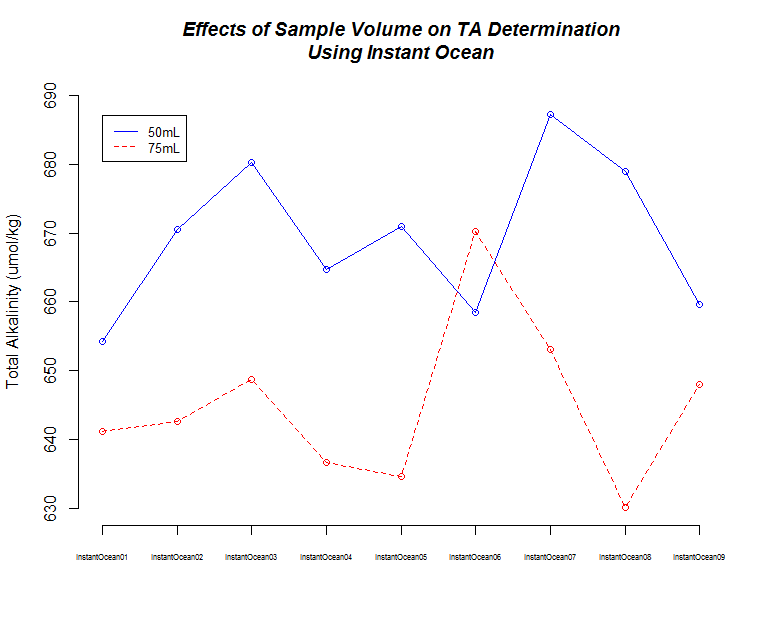
I ran nine replicates of Instant Ocean (36g/L in deionized water) at two different samples weights/volume (50g, 75g) to make sure the titrator was producing consistent results.

Here’s the R Studio Project folder with all the data/scripts used to gather the data and produce the plots:

TA values were determined using the seacarb R package. I used a salinity of 35 (seacarb default value?), but this has not been determined for this batch of Instant Ocean.

Sample Volume Mean TA Standard Deviation
50mL 669.4 11.14
75mL 645.0 11.96

The first thing I noticed was the low TA values when using Instant Ocean. I expected these to be more similar to sea water, but the Instant Ocean hasn’t been aerated, so maybe that could account for the low TA values. Regardless, this shouldn’t be too much of an issue, since I only wanted to use this to see if we were getting consistent measurements.

The second thing I noticed was the difference in TA values between the 50mL and 75mL samples. This is/was odd, as sample weight is taken into account with the seacarb package.

So, I decided to explore this a bit further, using the CRMs that we have. I felt that this would provide more informative data regarding measurement accuracy (i.e. do our measurements match a known value?), in addition to further evaluation of the effects of sample volume on TA determination.

Consistency checks with CRMs
CRM Tests

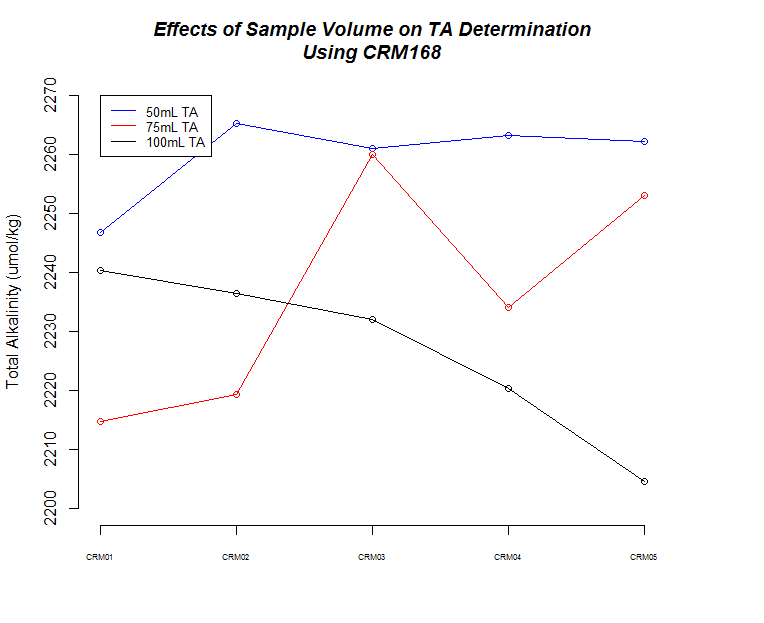
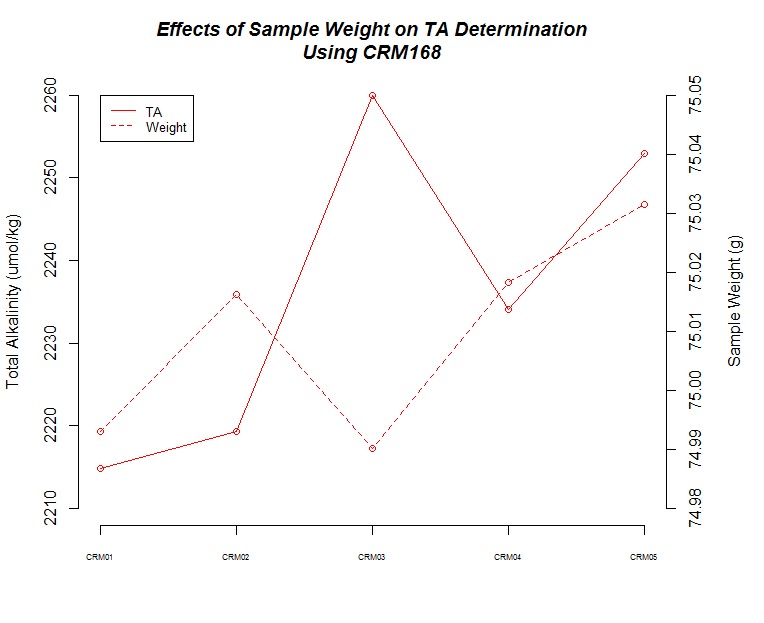
I ran five replicates of CRM Batch 168 (PDF) at three different sample weights/volume (50g, 75g, 100g) to make sure the titrator was producing consistent results and evaulate how accurate our measurements are.

Here’s the R Studio Project folder with all the data/scripts used to gather the data and produce the plots:

Here’s a bunch of graphs to consider:

Sample Mean TA Standard Deviation
CRM 168 2071.47 NA
50mL 2259.66 7.35
75mL 2236.22 19.96
100mL 2226.73 14.49

First thing to notice is that all sample measurements, regardless of volume, produce a TA value that is ~10% higher than what the CRM is certified to be. I’ve previously discussed this with Hollie and she’s indicated that there are two options:

  1. Calculate an offset relative to what the CRM is supposed to be and apply this offset to any sample measurements.

  2. Do not determine offset and just report calculated values, while providing CRM info.

The next thing that I noticed is the 50mL (g) samples produced the most consistent measurements.

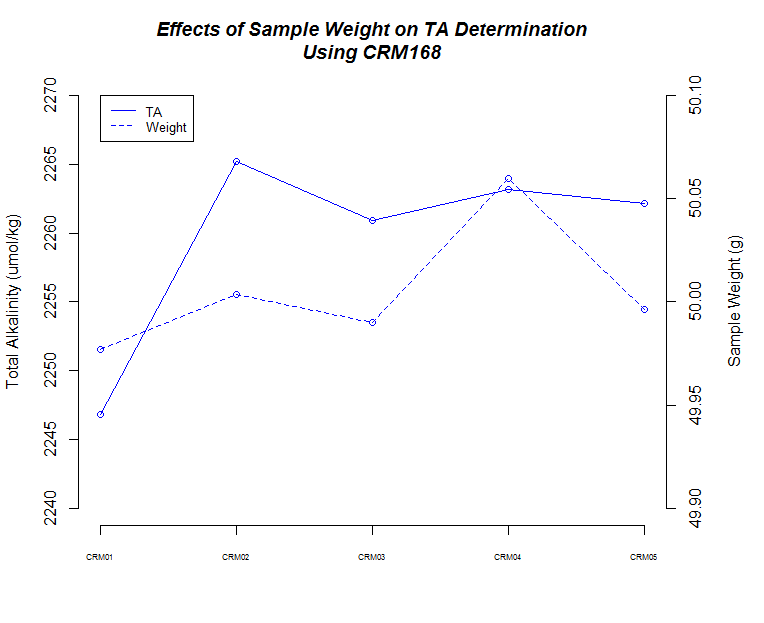
There also seems to be a pattern where fluctuations in TA values across replicates are mirrored by changes in weight for each corresponding replicate.

Finally, although it isn’t explicitly addressed, there is a time element in play here. As sample number increases, the longer those samples sat in the sample changer before titration. Oddly, it appears that there could be an effect on samples as they sit (e.g. sample evaporation prior to titration) when one considers the 75mL and 100mL samples, but both of those result in opposing trends, while the 50mL samples do not seem to suffer from any sort of time-related changes…


The Wrap Up

Whew! We made it! I’ll wait to get some feedback from lab members and Hollie before cranking through all of Hollie’s samples, but I feel pretty good about proceeding with a 50mL sample volume. If we decide to calculate an offset later on, it should only be a relatively minor tweak to our script.

Next up, figure out a way to pull out all of Hollie’s salinity data for the samples I’m going to measure and incorporate that into the TA_calculation.R script.

Titrator Setup – Functional Methods & Data Exports

I’ve been working on getting our T5 Excellence titrator (Mettler Toledo) with Rondolino sample changer (Mettler Toledo) set up and operational.

A significant part of the setup process is utilizing the LabX Software (Mettler Toledo, v.8.0.0). The software is vastly overpowered (i.e. overly complicated) for the nature of our work. As such, it’s been quite the struggle to get the titrator to do what we need it to do.

We’ve received a great deal of help and insight from Dr. Hollie Putnam (Univ. of Rhode Island). She provided us with a LabX Method that was previously used by some of her colleagues. In addition, she provided us with an SOP from those colleagues that helps describe how to physically operate the titrator and a corresponding workflow for data collection. Of course, she’s also helped immensely with understanding the entire process of the chemistry to how to process samples to implementing various quality control checks to ensure we’ll get the most accurate data we can.

After some significant struggles with getting the method to work properly, I contacted Mettler Toledo and the technician helped me modify the method that Hollie passed along to us to run properly.


Basic Functionality Fixes

The updated method resolves the following issues we were having (see annotated screenshot below the lists for more detailed overview of method changes):

  • Method only ends titration at specified maximum volume instead of specified potential
  • Method exits with Sample State = “Not OK”
  • Method fails to calculate acid Consumption at end of titration

I also modified the method to bring it up to spec with the Dickson Guide to Best Practices for Ocean CO2 Measurements- SOP3b:

  • Changed method template to use Endpoint (EP) titration instead of Equivalence Point (EQP) titration
  • Implemented initial titration step to pH=3.5 (200mV)
  • Added degassing step to match Dickson specs (increase stir speed and duration)
  • Improved titration precision by changing titration rate to automatically adjust relative to set endpoint values
  • Set correct voltages for pH=3.5 (200mV) & pH=3.0 (228.57mV); no need to adjust prior to running method

I recommend opening the image below in a new tab in order to be able to read all of the annotations.

So, all of that stuff makes the method actually run according to the Dickson specs. It also fixes the Consumption calculation. Although this aspect of the method is totally unnecessary (the consumption calculation could easily be integrated in downstream analysis), it feels good to have fixed the issue and learn how that aspect of the LabX software functions.


Data Export Fixes

We recently acquired the necessary license to unlock the ability to export data.

Digression:

This is a terrible practice implemented by Mettler Toledo, btw. I’m particularly annoyed because I specifically asked about data exports when I spoke with the sales rep when initiating the purchase. He neglected to mention that I’d need to purchase an additional license. I wasted a lot of time and hair pulling before I learned that this feature was locked by design and that I needed this additional license.

Anyway, the struggles continued even after activating the license. I was not able to export any data – every attempt at specifying a directory in which to save data failed.

Mettler Toledo informed me that it has to do with Windows Services Permissions.

To change permissions to allow data export:

  1. Search Windows for “Services”
  2. Open “Services”
  3. Right-click on “LabXHostService”
  4. Select “Properties”
  5. Click “Log On” tab.
  6. Click “Local System Account” radio button.
  7. Check “Allow service to interact with desktop” box.
  8. Restart computer.

Now, the data gets automatically exported to my desired directory as soon as a LabX task is finished!!


Data Management & Informational Resources

As we are very close to beginning to actually collect data with the titrator, I realized that all this data needs to go somewhere. Additionally, people need someplace to find out how to use all of this stuff (equipment, software, etc.).

I created a new GitHub repo: RobertsLab/titrator

Please feel free to look through it and post any ideas to the Issues section of the repo.

In my mind, this will be a “master” data repository for all measurements conducted on the titrator. All daily pH calibration data should get pushed to this repo. Any sample titration data should also end up on this repo. Basically, all the raw data coming off the machine each time it is used should end up in this repo. I think this will reduce data fragmentation (e.g. I perform measurements on a subset of samples one day and put the data in my folder on Owl. Then Grace performs measurements on the remaining samples and uploads those data to her folder on Owl. Now, the complete data set for an experiment is split between two different locations, making it difficult to find.)

Although this single data repository approach won’t eliminate fragmentation (it can’t be avoided since the Rondolino sample changer can only hold nine samples), I think it will be beneficial to know that all the data is in a single location.

This repo will also be a resource for SOPs and troubleshooting. A detailed SOP is currently in development (being modified from the SOP Hollie originally sent us) which will detail daily startup/shutdown procedures, running scripts to process data, and guides on how to evaluate quality control procedures at various points throughout the titration process.

Finally, it will also contain the necessary scripts that we develop for data grooming and analysis.


What’s Left?

Equipment

We only need one final physical component to actually begin collecting data. After reviewing the Dickson SOP3b and speaking with Hollie, it turns out we need an aquarium pump and rotameter (acquired this week) to sparge our samples; this aids in degassing prior to the titration from pH=3.5 to pH=3.0. Just waiting on tubing and tubing adapters for the rotameter. Once we have this, I should be able to start powering through samples.

Initial testing of the titrator (even without the full physical setup in place) shows highly consistent, reproducible measurements – both with pH calibration values and with total alkalinity (TA) determinations on Instant Ocean seawater. As such, I’m confident that I won’t have very much testing left to do once I can start bubbling air into the samples.

Software

Although these things are not necessary in order to start acquiring data, they will be necessary for performing TA calculations and, eventually be desired for analyzing and reporting TA calculations in near real-time (the end goal is to have this titrator setup in a wet lab where water TA calculations can be determined on the spot, as opposed to being stored and analyzed at a later time).

A to-do list is outlined here: RobertsLab/titrator/issues/1