Ran qPCRs on the O.lurida total RNA I isolated on 20150507 to assess presence of gDNA carryover with Oly Actin primers (SR IDs: 1505, 1504).
Used 1μL from all templates.
All samples were run in duplicate.
Positive control was HL1 O.lurida DNA isolated by Jake on 20150323.
Master mix calcs are here: 20150512_qPCR_Oly_RNA
Cycling params:
- 95C - 3mins
40 cycles of:
-
95C - 5s
-
60C - 20s
Melt curve
Plate layout: 20150512_qPCR_plate_Jake_Oly_Control_RNA
Results:
qPCR Data File (Opticon2): Sam_20150512_105811.tad
qPCR Report (Google Spreadsheet): 20150512_qPCR_Report_Jake_Oly_Control_RNA
Excluding the no template controls (NTC), all samples produced amplification. Will require DNasing before making cDNA.
On a side note, it should be noted that the efficiencies for all of the reactions were pretty bad; probably averaging 50%. Not entirely sure why or what that indicates.
In the amplification plots below, the positive control reps are the two red lines coming up at cycle ~22.
Amplification Plots
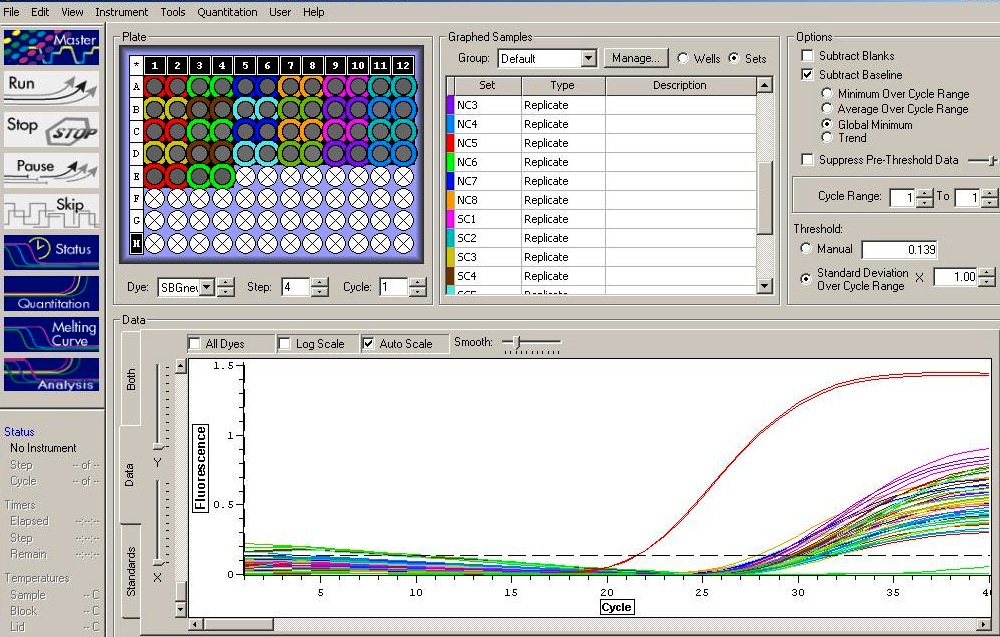 (http://eagle.fish.washington.edu/Arabidopsis/20150512_qPCR_Amp_Jake_Oly_Control_RNA.JPG)
Melt Curves
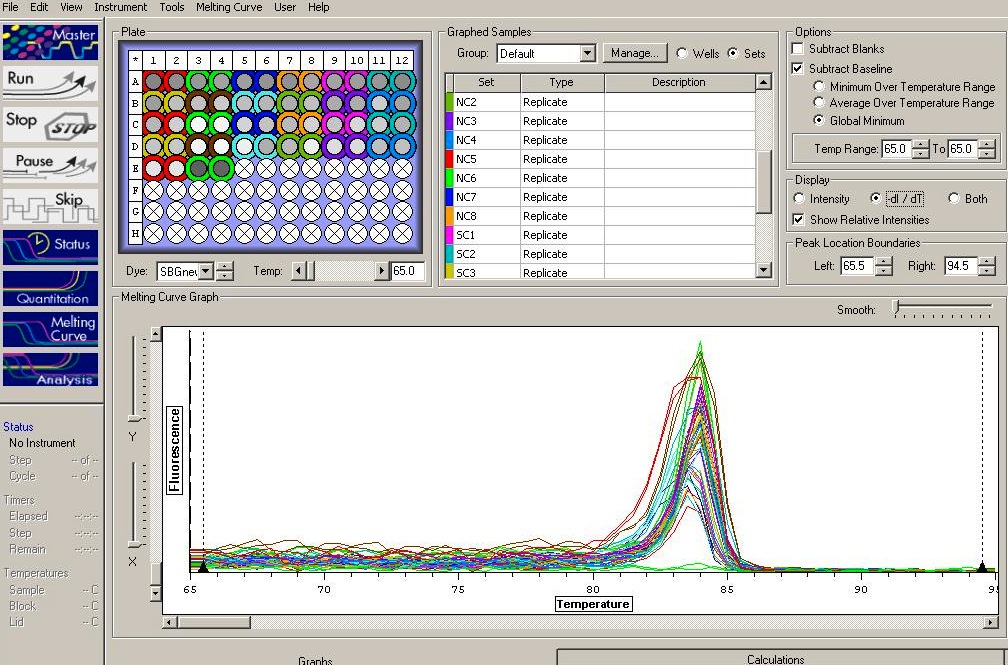 (http://eagle.fish.washington.edu/Arabidopsis/20150512_qPCR_Melt_Jake_Oly_Control_RNA.JPG)