Previously isolated RNA on 20191125 and made cDNA on 20191126 from some geoduck hemolymph and hemocyte samples that Shelly asked me to run qPCRs on.
Ran qPCR with vitellogenin primers I previously designed on 20181129 and tested on 20181206
Primers:
- 1712 (Pg_DN51983i8_1471)
- 1711 (Pg_DN51983i8_1347)
Positive control used was same pooled gonad cDNA used succesffully on 20181206 to test the assay. Due to sample limitations, positive control was not run in duplicate!
All qPCR reactions were run in duplicate. See qPCR Report (Results section below) for plate layout, cycling params, etc.
qPCR Master Mix calcs (Google Sheet):
NOTE: I actually ended up running this twice (55oC and 60oC)due to poor melt curves when run at 55oC anneal.
Results
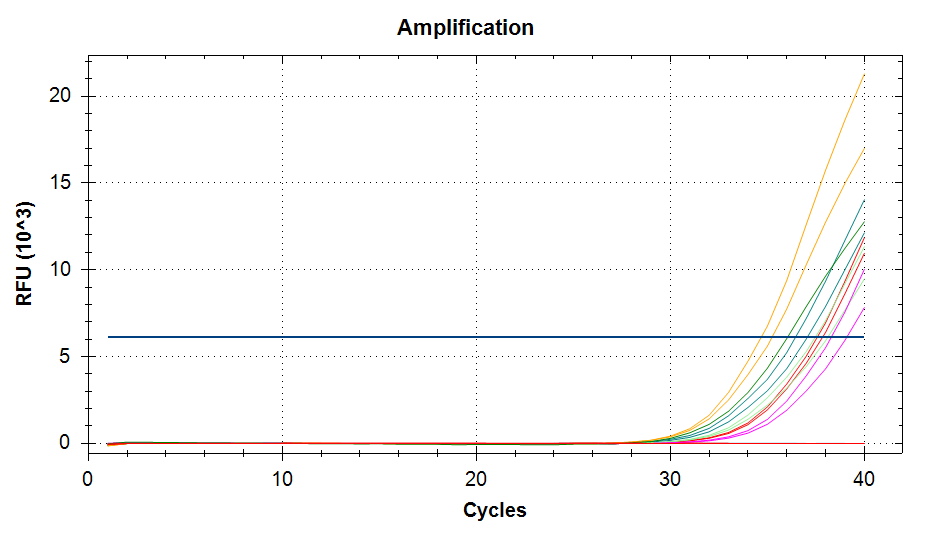
qPCR at 55oC anneal:
qPCR Report (PDF):
CFX Data File (PCRD):
CFX Results File (CSV):
- [sam_2019-11-2707-49-21_BR006896-20_Quantification_Cq_Results.csv](https://owl.fish.washington.edu/Athaliana/qPCR_data/sam_2019-11-27_07-49-21_BR006896-%20_Quantification_Cq_Results.csv)
Amplifcation plots
Melt curves
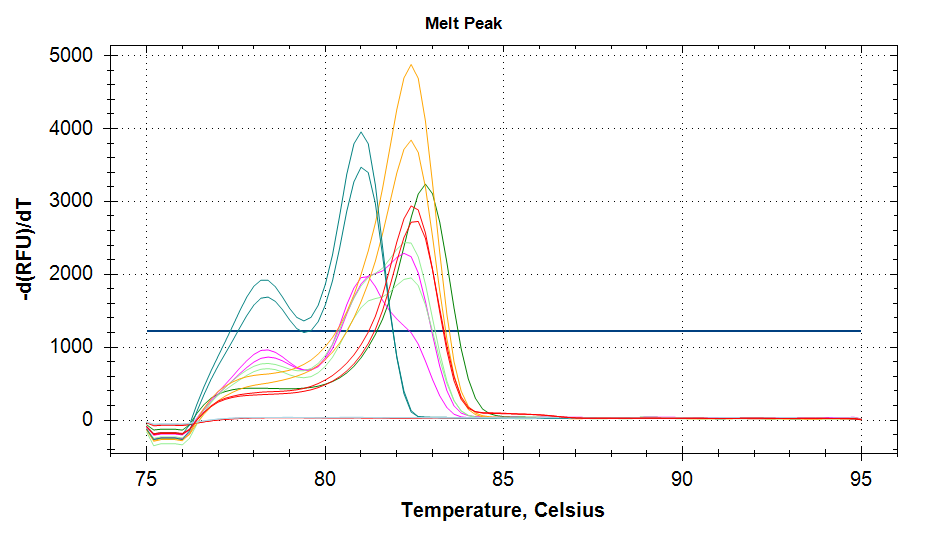
OK, here’s the quick rundown:
-
No amplification in 39H
-
Single melt peaks in 31H, 61H, and positive control only
Seeing this, I decided to run this at a higher annealing temp to see if I could increase specificity (see below).
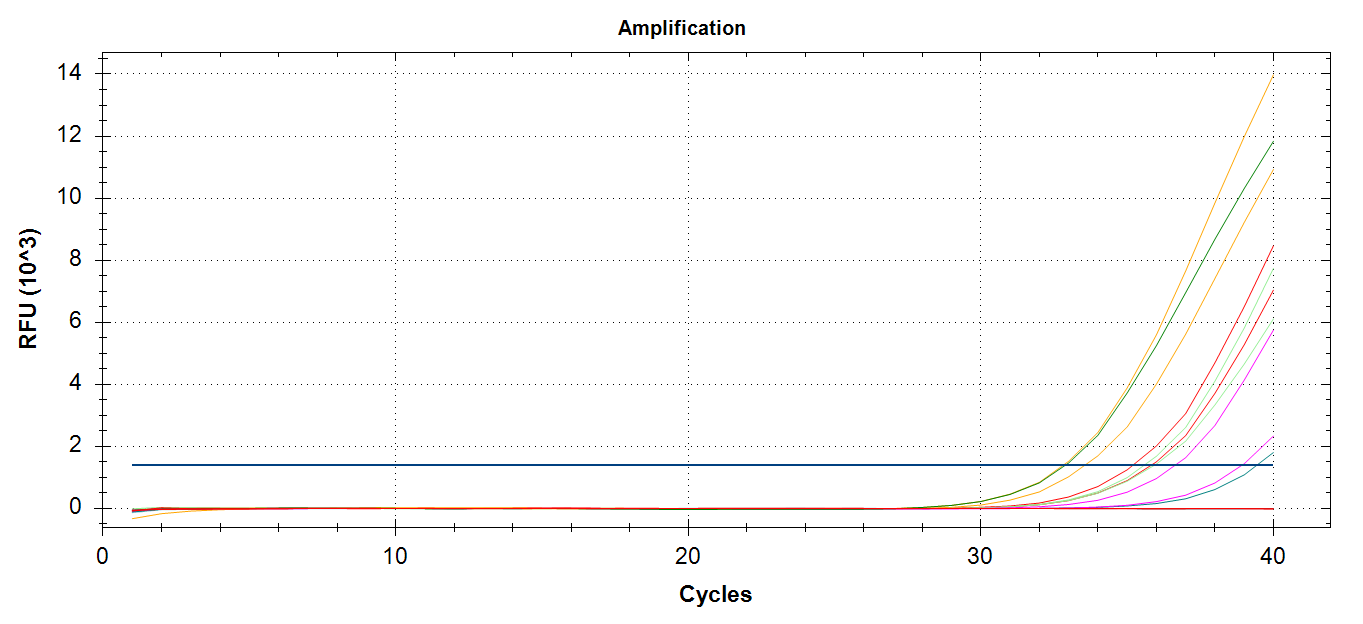
qPCR at 60oC anneal:
qPCR Report (PDF):
CFX Data File (PCRD):
CFX Results File (CSV):
- [sam_2019-11-2710-02-00_BR006896-_Quantification_Cq_Results.csv](https://owl.fish.washington.edu/Athaliana/qPCR_data/sam_2019-11-27_10-02-00_BR006896-__Quantification_Cq_Results.csv)
Amplification plots
Melt curves
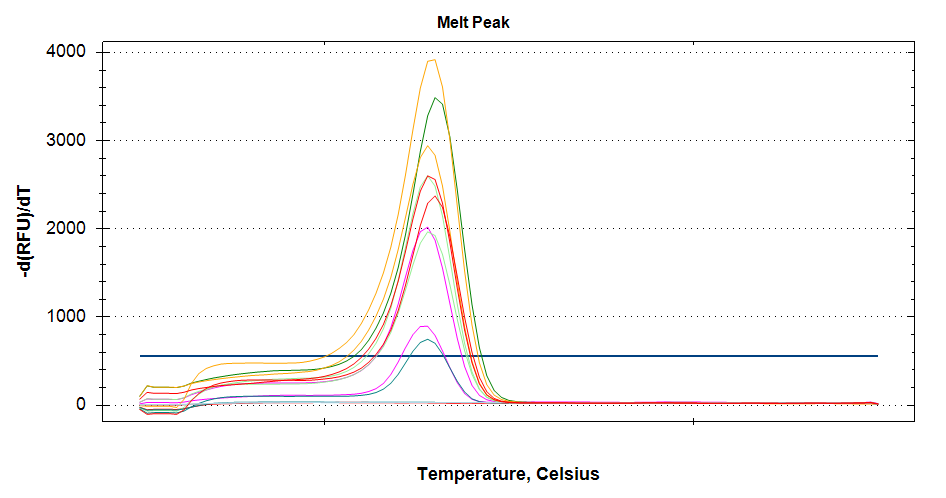
OK, here’s the quick rundown:
-
Still no amplification in 39H
-
All samples show single melt peak now