After deciding on a primer set to use for gDNA detection on 20200225, went ahead and ran a qPCR on most of the RNA samples described in Grace’s Google Sheet. Some samples were not run, as they had not yet been located at the time I began the qPCR.
Used 2ng of RNA (1uL) in each reaction. A 5uL dilution of each sample was made to a concentration of 2ng/uL. The decision for this quantity was based on the amount of RNA we might use in a reverse transcription reaction (50ng/25uL) and the volume of the resulting cDNA we’d run in a qPCR reaction (1uL). Calculations and the qPCR results (Cq values) are below (Google Sheet). It’s a modified version of Grace’s spreadsheet (linked above).
All reactions were run with 2x SsoFast EVA Green qPCR Master Mix (BioRad) on the Roberts Lab CFX Connect qPCR machine.
All samples were run in duplicate. See the qPCR Report (in Results section below) for plate layout, cycling params, etc.
Master mix calcs are here (Google Sheet):
NOTE: Sample 238 has almost nothing left; maybe 1uL?
RESULTS
qPCR data file (CFX):
qPCR Report (PDF):
qPCR results file (CSV):
- [sam_2020-02-26%2010-15-38BR006896-Quantification Cq Results.csv](https://owl.fish.washington.edu/Athaliana/qPCR_data/sam_2020-02-26%2010-15-38_BR006896-_Quantification%20Cq%20Results.csv)
The majority of samples that had been previously DNased did not have any residual gDNA. The majority of samples that had not been previously DNased still had residual gDNA.
Overall, about 50% of the samples (n = 20) will either need to be DNased and/or have additional RNA isolated in conjunction with the DNase step of the Quick DNA/RNA Microprep Plus Kit (ZymoResearch). The remaining samples (n = 24) are free of gDNA, buta couple of them may require more RNA to be isolated.
We might proceed just proceed with reverse transcription of samples that:
-
Do not need to be DNased.
-
Have sufficient quantity of RNA (whatever we deem that quantity to be…).
Will discuss with Steven and Grace to see how we want to roll.
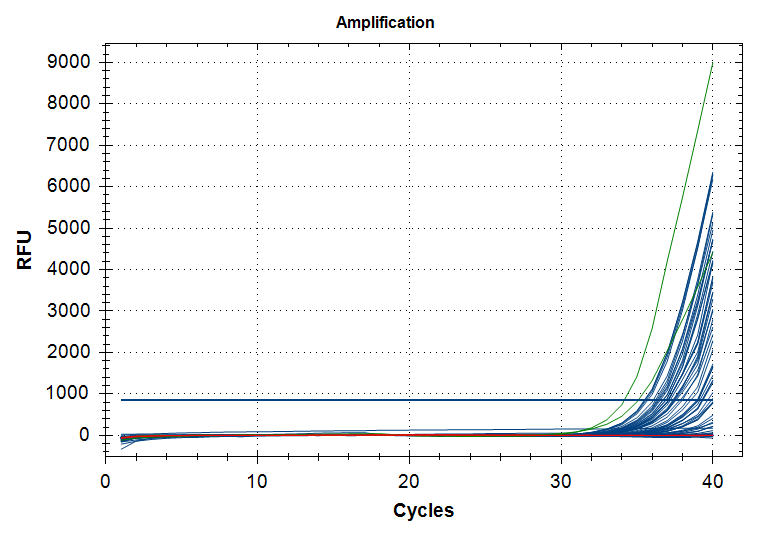
Amplification Plots
Blue: RNA samples
Green: Positive control gDNA
Red: No template controls
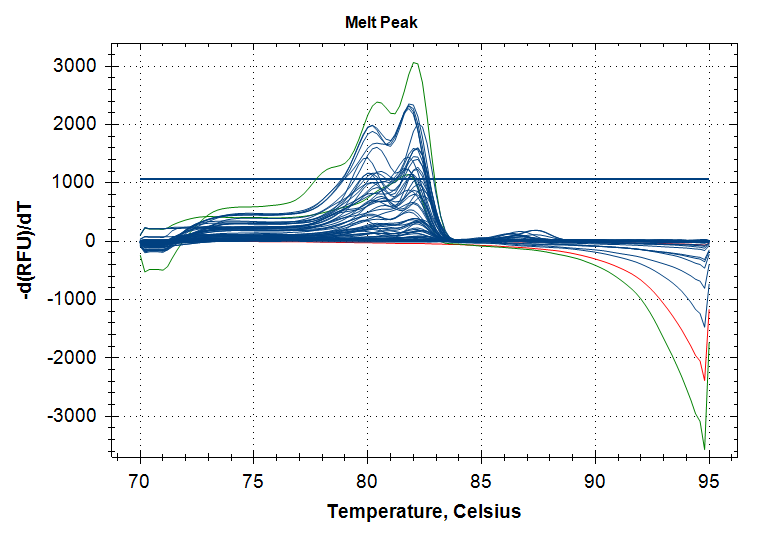
Melt curve plots
Same color scheme as amplification plots