On Monday (20200914), I checked a set of 28s and EF1a primer sets and determined that 28s-v4 and EF1a-v1 were probably the best of the bunch, although they all looked great. So, I needed to test these out on some individual cDNA samples to see if they might be useful as normalizing genes - should have consistent Cq values across all samples/treatments.
Primers tested:
| SRID | Primer_Name |
|---|---|
| 1797 | 28s_v4_FWD |
| 1796 | 28s_v4_REV |
| 1795 | EF1a_v1_FWD |
| 1794 | EF1a_v1_REV |
I tested them on a set of P.generosa hemolymph cDNA made by Kaitlyn on 20200212.
I also used a 1:10 dilution of geoduck gDNA (162ng/uL; from 20170105) as a positive control, as gDNA was amplified by all the primer sets on Monday.
Master mix calcs are here:
- 200200916_qPCR_geoduck_28s-4_EF1a-v1 (Google Sheet)
All qPCR reactions were run in duplicate. See qPCR Report (Results section below) for plate layout, cycling params, etc.
RESULTS
qPCR Report (PDF):
CFX Data File (PCRD):
CFX Results File (CSV):
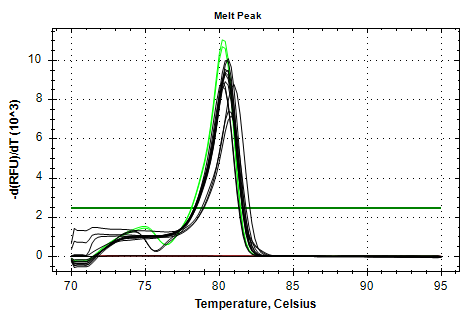
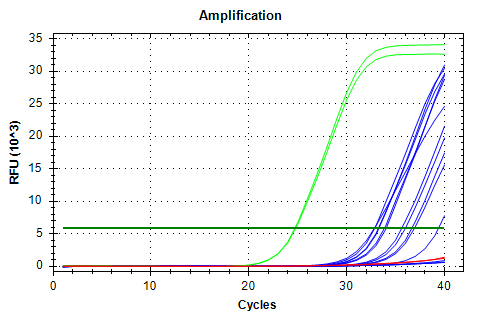
28s-v4 melt plots aren’t great and might even possibly have a slight shoulder, suggesting a secondary product. Not great. Additionally, the samples have a fairly large Cq range; not good for a normalizing gene.
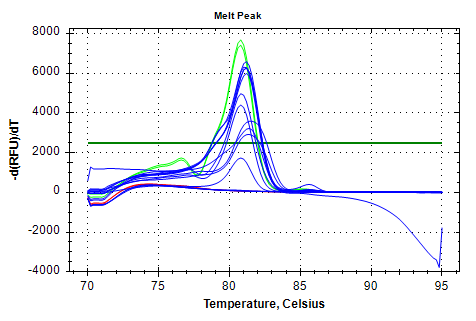
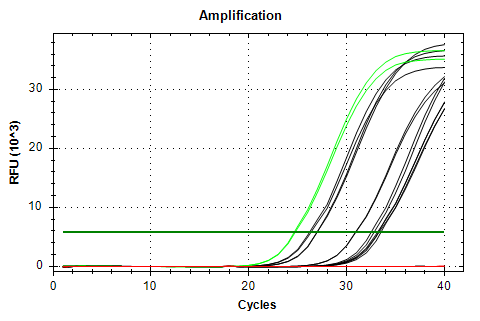
EF1a-v1 melt plots look great, but the amplification also exhibits a Cq range that’s too large for a normalizing gene.
With all of that said, I’m starting to think it would be best to re-quant the source RNA and remake cDNA.
Amplifcation and melt plots for each primer set are below. Color coding:
-
RED: No Template Control (NTC)
-
CHARTREUSE: gDNA
-
OTHER: cDNA
28s v4
AMPLIFICATION PLOTS
MELT PLOTS
EF1a v1
AMPLIFICATION PLOTS
MELT PLOTS