tldr – RNA-seq feature tracks
In an effort to better visualize the RNA-seq data from the heat shock experiment all accepted_hits.bam files from tophat2 analysis of the 6 libraries (3 pre, 3 post) were converted to bedgraphs.
!/Applications/bedtools2/bin/genomeCoverageBed
-bg
-split
-ibam accepted_hits.bam
-g /Volumes/web/halfshell/qdod3/Cg.GCA_000297895.1.25.dna_sm.toplevel.genomee
> 2M-HS.bedgraph
As per IGV recommendations, files were further converted to .tdf files.
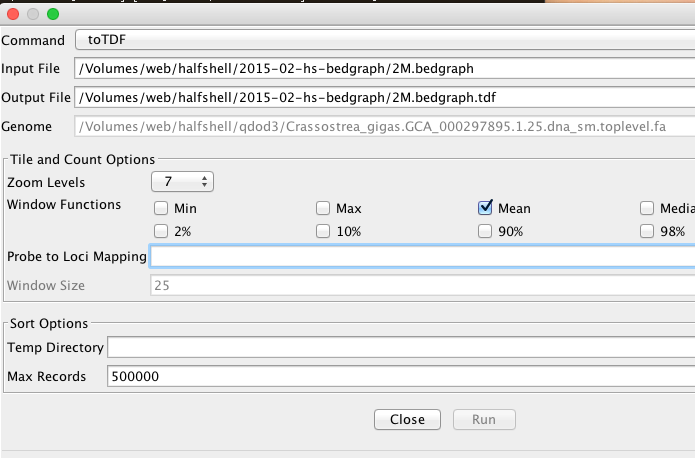
I tried to do this at the command line but the bedgraph input format seemed to be a problem.
Ultimately this renders as
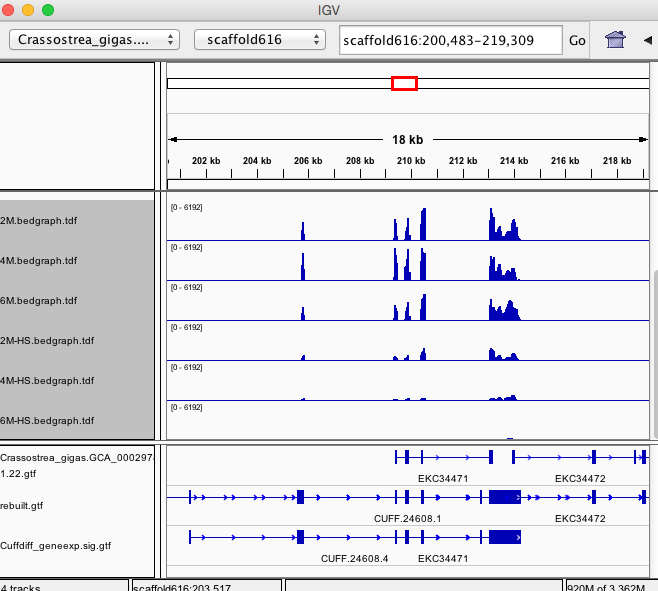
- [IGV xml File](http://owl.fish.washington.edu/halfshell/2015-02-hs-bedgraph/20150226-igv_session.xml) _only renders locally_
Next step still seems to be going back to DMRs and characterizing where the exist in the genome. Nothing yet seems obvious, particularly related to differentially expressed genes.
Recent Comments