Posted by & filed under Panopea generosa.

Work Accomplished

The overall goal of this project is to develop a fundamental understanding of processes controlling marine mollusc reproductive maturation. In order accomplish this goal the specific research objectives of this proposal were to 1) characterize tissue specific transcriptomic resources for the geoduck and 2) identify proteins that play a role in geoduck reproductive maturation.

The first step in this project was collecting clams at different reproductive stages as determined through histological analysis. Gonadal tissue from 70 geoducks was sampled in batches of about eight per week over the span of two months from November 2014 to early January 2015. Hundreds of images were analyzed and reproductive status was determined for each individual.

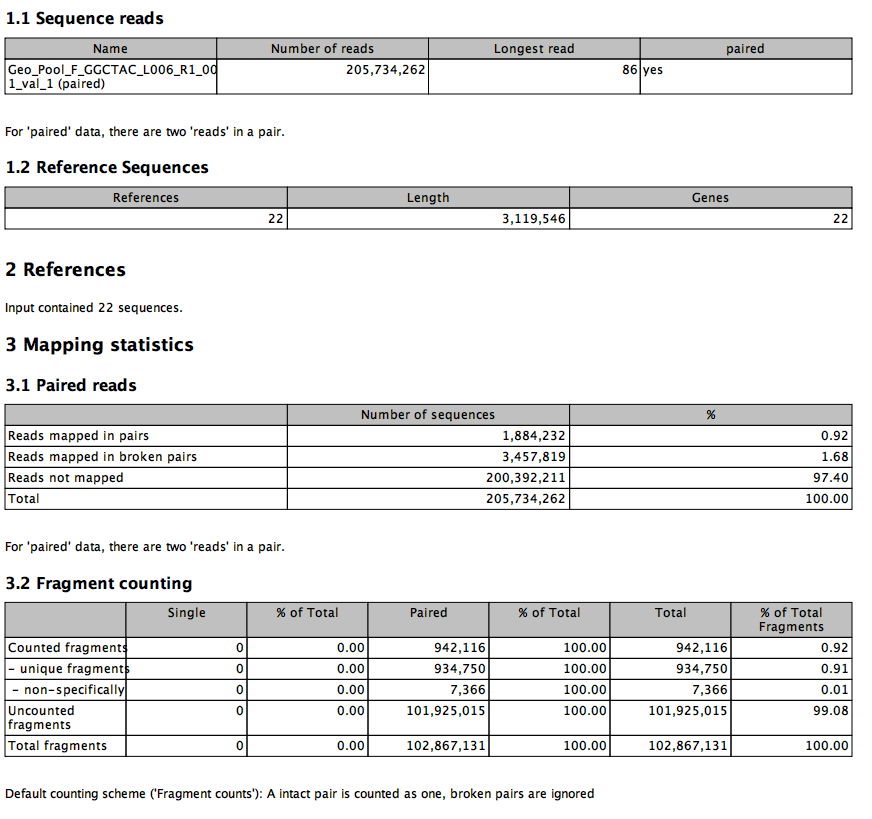
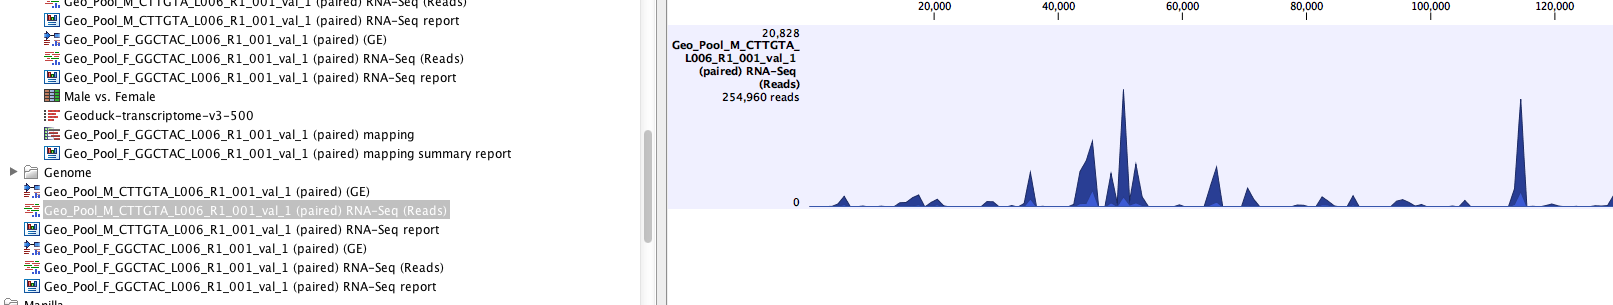
Based on histological determination of reproductive maturational stage, seven female and six male paraffin-embedded gonad samples were selected for construction of RNA-seq libraries. A total of 443,468,476 reads were obtained and the de novo assembly resulted in a total of 153,982 transcript contigs with a mean contig length of 660 bp and an N50 value of 1015 bp. In comparing our contigs with oyster sequences whose expression changed during gonad development in 161 matched including geoduck sequences corresponding to genes expressed in gonads in early gonad developmental stages (7), with increasing expression during spermatogenesis (44), with increasing expression during oogenesis (31) and genes with varying expression level during gonadogenesis in both sexes (79) .

Proteomic profiles were determined for the primary reproductive maturation stages in both male and female clams using data dependent acquisition (DDA) of gonad proteins. This approach yielded 3,627 detected proteins across both sexes and three maturation stages. This is a significant escalation in the understanding of proteomic responses in maturation stages of marine mollusks. Based on the DDA data, 27 proteins from early- and late-stage male and female clams were chosen for selected reaction monitoring (SRM). The SRM assay yielded a suite of indicator peptides that can be used as an efficient assay to non-lethally determine geoduck gonad maturation status.

Timmins-Schiffman-JPRv4-sr_docx_1E0D8BEB.png

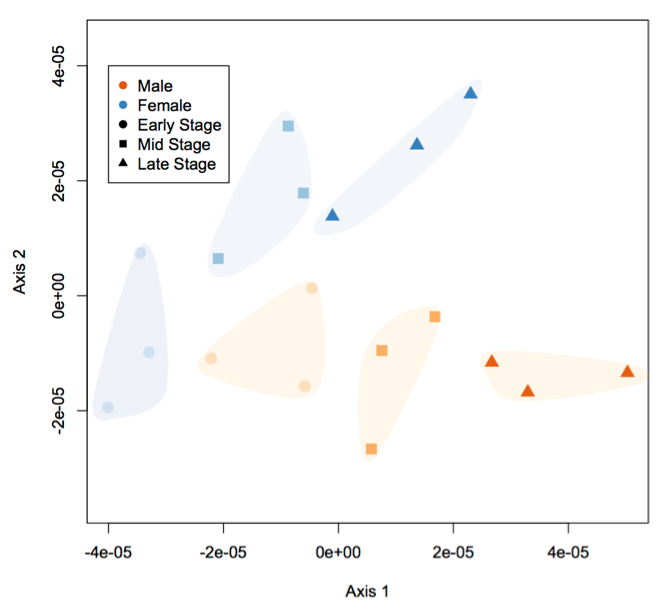
Non-metric multidimensional scaling plot (NMDS) of geoduck gonad whole proteomic profiles generated by data dependent acquisition. Gonad proteomes differ among clams by both sex (male = orange, female = blue) and stage (early-stage = circles, mid-stage = squares, late-stage = triangles; p<0.05).

Impact of Award

Beyond contributing to the fundamental knowledge of marine mollusk reproduction, this award produced numerous publications and provided basis for further funding and proposal submissions. In addition the transcriptomic data was the basis for the course: Bioinformatics for Transcriptomic and Epigenomic Analyses – Centro de Investigación Científica y de Educación Superior de Ensenada, B.C. (CICESE) 19-24 October 2015

Further Funding

Currently two projects have been funded that were based on this project and others have been submitted. Funded projects include: Proteomic response of shellfish to environmental stress; Department of Natural Resources $107,805 and Elucidating the physiological and epigenetic response of tetraploid and triploid Pacific Oysters to environmental stressors; NOAA $178,898. Submitted proposals include one to NOAA on the development of new clam species for aquaculture.

Publications

Crandall, Grace; Roberts, Steven (2016): Reproductive Maturation in Geoduck clams (Panopea generosa). figshare.
https://dx.doi.org/10.6084/m9.figshare.3205975.v1
Retrieved: 14 41, Dec 23, 2016 (GMT)
This fileset includes a research paper describing reproductive maturation in geoduck clams with 200 images of gonadal histological sections and associated datasheets. Downloads = 1761.

Emma B. Timmins-Schiffman, Grace A. Crandall, Brent Vadopalas, Michael E. Riffle, Brook L. Nunn, Steven B. Roberts (2016) Integrating proteomics and selected reaction monitoring to develop a non-invasive assay for geoduck reproductive maturation
bioRxiv 094615; doi: https://doi.org/10.1101/094615

[Data] Transcriptomic profiles of adult female & male gonads in Panopea generosa (Pacific geoduck).
https://www.ncbi.nlm.nih.gov/bioproject/PRJNA316216

Panopea gonad transcriptome
Open Science Framework Project
https://osf.io/3xf6m/

[Data] Geoduck (Panopea generosa) gonad DDA LC-MS/MS
https://www.ebi.ac.uk/pride/archive/projects/PXD003127

[Code] Source Code for GO Analysis in Geoduck Gonad Background
https://github.com/yeastrc/compgo-geoduck-public

[Data] Geoduck (Panopea generosa) gonad DIA LC-MS/MS
https://www.ebi.ac.uk/pride/archive/projects/PXD004921

[Data] Selected reaction monitoring of geoduck gonad peptides to develop biomarkers of reproductive maturation status
http://www.peptideatlas.org/PASS/PASS00943

[Data] Selected reaction monitoring of geoduck hemolymph peptides to develop biomarkers of reproductive maturation status
http://www.peptideatlas.org/PASS/PASS00942

Posted by & filed under Miscellaneous.

Getting back into gear, I am assisting Andrew ID some targets from a salmonid transcriptome. With said transcriptome I am taking the blast output and getting some protein names sans SQLshare.

The tldr can be seen here, but if you have the time I will point out the key code aspects and leave you with a tabular file.


First we had the good ol tr.

Annotation_1D4BD559.png

Then I went ahead and downloaded the newest version of Swiss-prot details


http://www.uniprot.org/uniprot/?query=reviewed%3ayes&force=yes&format=tab&columns=id,entry%20name,go-id,interactor,database(GO),go,reviewed,interpro,pathway,protein%20names,genes,tools,organism,length"

Before joining I needed to sort.

Annotation_1D4BD5EC.png

And with the join I needed a few parameters

!join -t $'\t' -1 3 -2 1 \
blastx_sprot.sort \
/Users/sr320/git-repos/nb-2016/uniprot-reviewed.sort

And because we need to get to Excel
!open blastx-join-uniprot-info.tab -a "Microsoft Excel"

Volia a tab file is created that can be examined further.

Posted by & filed under Snippit.

Working through the GBS data, I wanted to leave a trace of a workflow that will be improved upon (I used the wrong cut site) as well as results for comparison.

Only one end of the 96 files (ie samples) was used. Here is the notebook and output directory.

Requisite screenshot:
nb-2016_GBS-pyrad-2_ipynb_at_master_·_sr320_nb-2016_1CF64D0F.png

Posted by & filed under Ostrea lurida.

We currently have a version (0.0.2) of the Ostrea lurida genome on CoGe. This is 38 scaffolds greater than 80k bp. Below is an effort to map gonad RNA-seq data to said genome.

Two male gonad and two female libraries were mapped to the genome using TopHat in Cyverse Discovery Environment.
cy_1CEA6C82.png

Through the steps…

CoGe__My_Data_1CEA6505.png
CoGe__My_Data_1CEA6557.png

I moved the data in Discovery Environment to coge_data directory.

CoGe__My_Data_1CEA6688.png

Will see what Expression Analysis does…

CoGe__My_Data_1CEA66F8.png

Some output

CoGe__My_Data_1CEA6A27.png

This created two files and corresponding tracks: read depth and BAM alignment

JBrowse_scaffold5824_3156__8360_1CEA6B71.png

Will crank out other three libraries and soon will work on rough annotation.

Posted by & filed under Ostrea lurida.

In a different experiment compared to when Fidalgo siblings were outplanted at two sites, we also examined Hood Canal (HC) and Oyster Bay (SS/South Sound) grown at Clam Bay (Manchester). Descriptor.

These were the oysters Katherine Silliman spawned in the summer of 2015 and represent seed Jake outplanted years ago.

This was run against the BGI scaffolds >10k.
BSMAP-06-BGIv002_1CC19CB1.png

The results are quite interesting.
RStudio_1CC19CEC.png

The full notebook can be found at https://github.com/sr320/nb-2016/blob/master/O_lurida/BSMAP-06-BGIv001.ipynb.

Posted by & filed under Ostrea lurida.

We carried out whole genome BS-Seq on siblings outplanted out at two sites: Fidalgo Bay (home) and Oyster Bay. Four individuals from each locale were examined.

A running description of the data is available @ https://github.com/RobertsLab/project-olympia.oyster-genomic/wiki/Whole-genome-BSseq-December-2015.

I need to look back to a genome to analyze this. We did some PacBio sequencing a while ago.
– http://nbviewer.jupyter.org/github/sr320/ipython_nb/blob/master/OlyO_PacBio.ipynb

In recap, the fastq file had 47,475 reads: http://owl.fish.washington.edu/halfshell/OlyO_Pat_PacBio_1.fastq

3058 of these reads were >10k bp: http://eagle.fish.washington.edu/cnidarian/OlyO_Pat_PacBio_10k.fa

Those 3058 reads were nicely assembled into 553 contigs: http://eagle.fish.washington.edu/cnidarian/OlyO_Pat_PacBio_10k_contigs.fa


Step forward a bit and all 47475 reads were assembled into the 5362 contigs known as OlyO_Pat_v02.fa http://owl.fish.washington.edu/halfshell/OlyO_Pat_v02.fa

The latter (v02) was used to map the 8 libraries. Roughly getting about 8% mapping
BSMAP-03b-Genomev2-10x_1CB41B65.png

About 15 fold average coverage
BSMAP-03b-Genomev2-10x_1CB41B7A.png

And with a little filtering
BSMAP-03b-Genomev2-10x_1CB41B9E.png

Note that awk script filtered for 10x coverage! this could be altered.

and R have an intriguing relationship
BSMAP-03b-Genomev2-10x_1CB41BC9.png

With BGI Draft Genome

Following the same workflow with the BGIv1 scaffolds >10k bp have about 16% or reads map.
BSMAP-05-BGIv001_1CB41C8D.png

3 fold coverage
BSMAP-05-BGIv001_1CB41CB3.png

again, making sure there is 10x coverage at a given CG loci
we get
RStudio_1CB41F50.png

Much weaker if we allow only 3x coverage at a given CG loci
RStudio_1CB421EC.png

and the bit of R code

setwd("/Volumes/web-1/halfshell/working-directory/16-04-05")

library(methylKit)

file.list ‘mkfmt_2_CGATGT.txt’,
‘mkfmt_3_TTAGGC.txt’,
‘mkfmt_4_TGACCA.txt’,
‘mkfmt_5_ACAGTG.txt’,
‘mkfmt_6_GCCAAT.txt’,
‘mkfmt_7_CAGATC.txt’,
‘mkfmt_8_ACTTGA.txt’
)

myobj=read(file.list,sample.id=list(“1″,”2″,”3″,”4″,”5″,”6″,”7″,”8″),assembly=”Pat10k”,treatment=c(0,0,0,0,1,1,1,1))

meth<-unite(myobj)
head(meth)
nrow(meth)
getCorrelation(meth,plot=F)
hc PCA<-PCASamples(meth)

Posted by & filed under Panopea generosa.

Yesterday I uploaded v0.0.1 of the Geoduck genome to CoGe.

Now I want to start adding tracks. To do this I used CLC to create RNA-seq tracks from our male and female gonad transcriptome data.

As would be expected only a small amount of reads mapped. This is as we are limiting the genome to the 22 scaffolds with length > 100k.

Males
CLC_Genomics_Workbench_8_5_1_1CAD8B6E.png

Females
CLC_Genomics_Workbench_8_5_1_1CAD8BCB.png

One thing to point out (and will have to be followed up on) is that many more Female reads mapped back.

I took the Reads data and exported to BAM.
CLC_Genomics_Workbench_8_5_1_1CAD8C40.png

Then uploaded to CoGe.
I called this Version 1, and interestingly I got some cool options.. so I selected them.

CoGe__My_Data_1CAD8C90.png

This included saving as a Notebook.

CoGe__My_Data_1CAD8CC2.png


This was Finished in less than 5 minutes!
CoGe__My_Data_1CAD8CEB.png

The SNP view.
CoGe__My_Data_1CAD8D42.png

Voila – we have it in a Browser.
JBrowse_scaffold860_1__221360_and_Getting_back_on_track_md_1CAD9095.png

and you can zoom in
JBrowse_scaffold4546_56623__57472_1CAD8E29.png

Here we have a Notebook view
CoGe__My_Data_1CAD8E81.png
It is now public, though not quite sure if there is a url.

Everything is public so please give it a look / twirl.
CoGe__My_Data_1CAD8F10.png

Posted by & filed under Panopea generosa.

We have had the data for a draft genome of Panopea generosa for a bit. Here is a quick look.

All raw data is available @ http://owl.fish.washington.edu/nightingales/P_generosa/

With a first pass assembly here.

There are over 14 million scaffolds at this point with 22 scaffolds greater than 100,000 bp. We are using those to kick the tire of COGE and see if this is good portal for analysis and sharing.

Banners_and_Alerts_and_CoGe__My_Data_and_CLC_Genomics_Workbench_8_5_1_and_Add_New_Post_‹_half-shell_—_WordPress_1CAC76A2.png


There is not much to see now in the genome browser, but should hopefully have more soon.
CoGe__My_Data_1CAC7724.png

Posted by & filed under Miscellaneous.

I was out at Manchester yesterday to help Laura out with getting things going.

tldr- Water is flowing, rising temperature seems to be an issue. This could be attributed to air temp and/or pumps.

When we arrived water temperature was up to 19C after about a week. We decided to drain down system refill, calibrate Durafets, and monitor system over next few days with respect to temperature and pH.

Here is the system draining..


As the system drained we calibrated with NBS buffers (7-4-10). In actuality I think they were only calibrated at 7 and 4. Need to confirm calibration system with Honeywells.

Probes are designated pink, blue, green, and yellow. Two in treatment tanks and two in each of experimental systems. As we placed in 7 buffer they initially read as follows

pink – 6.6

blue – 6.98

green – 6.82

yellow – 6.89

After all were calibrated we went through buffers and just read.

img_3940


2016-01-29 09.51.48


Here are more #s

2016-01-28_09_57_31_jpg_and_2016-01-28_09_57_47_jpg_and_2016-01-28_09_57_57_jpg_1C5BDFC3.png

Tour time (if you listen closely you can hear a narration)


As the system started to refill with ambient water (10c) this is how the pH probes read.

2016-01-28_13_48_31_jpg_1C5BE253.png

This is without any C02 input. We then “sample calibrated” experimental system to read same pH

Camera_Uploads_1C5BE2A3.png

At the end of the day pH was set to 7.5 in treatment tank and we will monitor to see how temperature and pH holds (assuming it can adjust with high flow rates). For more on this day check out Laura’s post.

I will leave you with an inside look at treatment tanks. Note that the first tank in the video (Tank #2) has less water coming in from the head tank as compared to Tank #1.