Tag Archives: RAD

Troubleshooting – Oly RAD-seq

After the failure of the prep-scale PCR for the RAD library construction, Katherin Silliman pointed out a potential problem (too much dNTPs). This was odd because I was following the Meyer Protocol and I used what was indicated.

Oddly, it turns out that Katherine’s version of the Meyer Lab 2bRAD protocol differed from what I had download. To add to the confusion, both protocols have the same file name. Here’s what I’m talking about:


The file on the left is the one I was using and the one on the right is the file Katherine is using (NOTE: The file name’s aren’t exact because they were saved to the same directory and the numbers in the parentheses were appended to the file name automatically)

I’ve updated our copy of the protocol in our GitHub account. However, Katherine informed me that she’s just been pulling up the Meyer Lab page to reference the protocol. So, it’s possible they made a change to the file after I initially downloaded it, but the change wasn’t indicated in the file name.

http://people.oregonstate.edu/~meyere/docs/

However, when discussing with Katherine, she made a good point and said she just scaled up the test-scale PCR. Since the test-scale PCR was successful, she didn’t see a need to make any changes.

Will try this procedure again with the correct protocol; probably by scaling up the test-scale PCR.

PCR – Oly RAD-seq Test-scale PCR

Continuing with the RAD-seq library prep. Following the Meyer Lab 2bRAD protocol.

Prior to generating full-blown libraries, we needed to run a “test-scale” PCR to identify the minimum number of cycles needed to produce the intended product size (166bp).

I ran PCR reactions on a subset (Sample #: 2, 3, & 4) of the 10 samples that I performed adaptor ligations on Friday.

PCR reactions were set up on ice in 0.5mL PCR tubes.

REAGENT SINGLE REACTION (μL) x4.4
Template 8 NA
NanoPure H2O 1 4.4
dNTPs (1mM) 4 17.6
ILL-LIB1 (10μM) 0.4 1.76
ILL-LIB2 (10μM) 0.4 1.76
ILL-HT1 (1μM) 1 4.4
ILL-BC1 (1μM) 1 4.4
5x Q5 Reaction Buffer 4 17.6
Q5 DNA Polymerase 0.2 0.88
TOTAL 20 52.8


Combined 12μL of master mix with 8μL of the ligation reaction from earlier today.

Cycling was performed on a PTC-200 (MJ Research) with a heated lid:

STEP TEMP (C) TIME (s)
Initial Denaturation
  • 98
  • 30
27 cycles
  • 98
  • 60
  • 72
  • 5
  • 20
  • 10

We’re following the “1/4 reduced representation” aspect of the protocol. As such, 5μL of each reaction was pulled immediately after the extension (72C – machine was paused) of cycles 12, 17, 22, & 27 in order to determine the ideal number of cycles to use. Also ran the ligation reactions (labeled “Ligations” on the gel below) of the samples as a pre-PCR comparison. Treated them the same as the PCR reactions: mixed 8μL of the ligation with 12μL of H2O, used 5μL of that mix to load on gel.

These samples were run on a 1x modified TAE 2% agarose gel (w/EtBr).


Results:


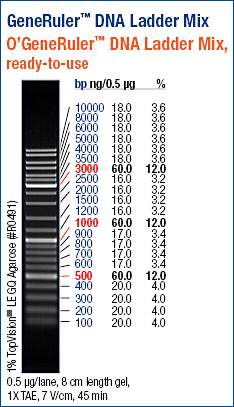
Test-scale PCR gel. Green arrow indicates desired band. The numbers below the headings indicate the sample number.


This looks pretty good. The green arrow on the gel indicates the desired band size (~166bp). Although difficult to see on this gel image, there is a gradient in band intensities across the cycles (band intensity increases as cycle number increases). Looks like we can use 12 cycles for our PCRs.

One other aspect of this gel that is very interesting is the ligations. The three ligation samples all show an intact high molecular weight band! This is very surprising, since the input gDNA from these three samples does not look this.