I’ve migrated my notebook to here:
Author Archives: kubu4
qPCRs – Ronit’s C.gigas ploidy/dessication/heat stress cDNA (1:5 dilution)
IMPORTANT: The cDNA used for the qPCRs described below was a 1:5 dilution of Ronit’s cDNA made 20181017 with the following primers! Diluted cDNA was stored in his -20oC box with his original cDNA.
The following primers were used:
18s
- Cg_18s_F (SR ID: 1408)
-
Cg_18s_R (SR ID: 1409)
EF1 (elongation factor 1)
- EF1_qPCR_5′ (SR ID: 309)
-
EF1_qPCR_3′ (SR ID: 308)
HSC70 (heat shock cognate 70)
- Cg_hsc70_F (SR ID: 1396)
-
Cg_hsc70_R2 (SR ID: 1416)
HSP90 (heat shock protein 90)
- Cg_Hsp90_F (SR ID: 1532)
-
Cg_Hsp90_R (SR ID: 1533)
DNMT1 (DNA methyltransferase 1)
- Cg_DNMT1_F (SR ID: 1511)
-
Cg_DNMT1_R (SR ID: 1510)
Prx6 (peroxiredoxin 6)
- Cg_Prx6_F (SR ID: 1381)
-
Cg_Prx6_R (SR ID: 1382)
Samples were run on Roberts Lab CFX Connect (BioRad). All samples were run in duplicate. See qPCR Report (Results section) for plate layout, cycling params, etc.
qPCR master mix calcs (Google Sheet):
RESULTS
No analysis here. Will analyze data and post in different notebook entry. This entry just contains the qPCR setup, resulting data, and a glimpse of how each primer performed.
Nothing is broken down based on sample ploidy or experimental conditions.
18s
qPCR Report (PDF):
qPCR File (PCRD):
qPCR Data (CSV):
Amplication Plots

Melt Curves

DNMT1
qPCR Report (PDF):
qPCR File (PCRD):
qPCR Data (CSV):
Amplication Plots
Melt Curves
EF1
qPCR Report (PDF):
qPCR File (PCRD):
qPCR Data (CSV):
Amplication Plots – Manual Threshold (Linear)

Amplication Plots – Manual Threshold (Log)

Amplication Plots – Automatic Threshold (Linear)
Amplication Plots – Automatic Threshold (Log)
Melt Curves
HSC70
qPCR Report (PDF):
qPCR File (PCRD):
qPCR Data (CSV):
Amplication Plots
Melt Curves
HSP90
qPCR Report (PDF):
qPCR File (PCRD):
qPCR Data (CSV):
Amplication Plots
Melt Curves

Prx6
qPCR Report (PDF):
qPCR File (PCRD):
qPCR Data (CSV):
Amplication Plots

Melt Curves
Samples Received – Crassostrea virginica (Eastern oyster) tissue from Lotterhos Lab (Northeastern University)
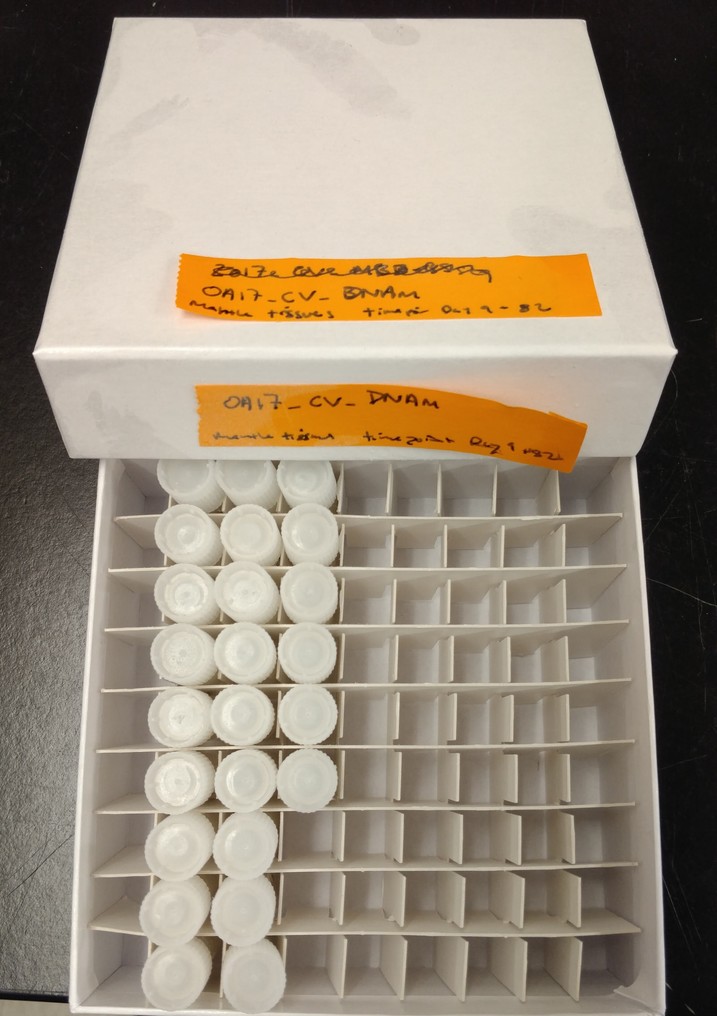
Sample sheet (Google Sheet):
Samples were stored in -80oC:
Reverse Transcription – Ronit’s C.gigas DNased ctenidia RNA
Proceeded with reverse transcription of Ronit’s DNased ctenidia RNA (from 20181016).
Reverse transcription was performed using 100ng of each sample with M-MMLV Reverse Transcriptase from Promega.
Briefly, 100ng of DNased RNA was combined with oligo dT primers and brought up to a final volume of 15uL. Tubes were incubated for 5mins at 70oC in a PTC-200 thermal cycler (MJ Research), using a heated lid. Samples were immediately placed on ice.
A master mix of buffer, dNTPs, water, and M-MMLV reverse transcriptase was made, 10uL of the master mix was added to each sample, and mixed via finger flicking. Samples were incubated for 1hr at 42oC in a PTC-200 thermal cycler (MJ Research), using a heated lid, followed by a 5min incubation at 65oC.
Samples were stored on ice for use later this afternoon by Ronit.
Samples will be stored in Ronit’s -20oC box.
Reverse transcription calcs (Google Sheet):
qPCR – Ronit’s DNAsed C.gigas Ploidy/Dessication RNA with elongation factor primers
After I figured out the appropriate DNA and primers to use to detect gDNA in Crassostrea gigas samples, I checked Ronit’s DNased ctenidia RNA (from 20181016) for residual gDNA.
Elongation factor primers:
- EF1_qPCR_5′ (SRID 309)
- EF1_qPCR_3′ (SRID 310)
BB16 from 20090519 was used as a positive control.
Samples were run on Roberts Lab CFX Connect (BioRad). All samples were run in duplicate. See qPCR Report (Results section) for plate layout, cycling params, etc.
qPCR master mix calcs (Google Sheet):
Results
qPCR Report (PDF):
qPCR File (PCRD):
qPCR Data (CSV):
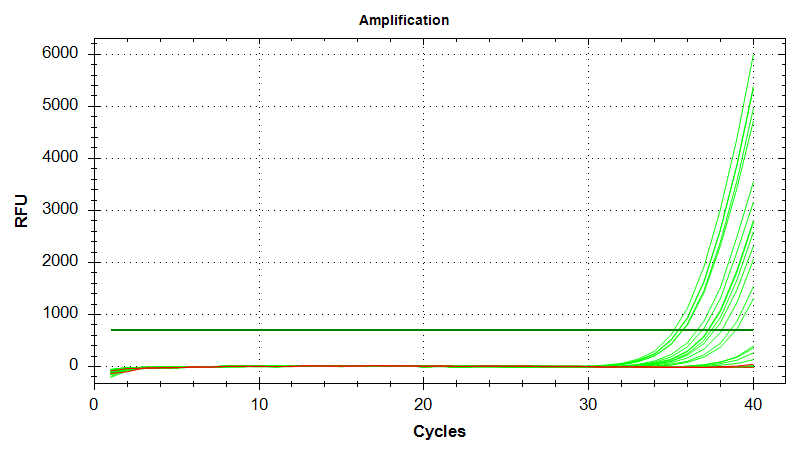
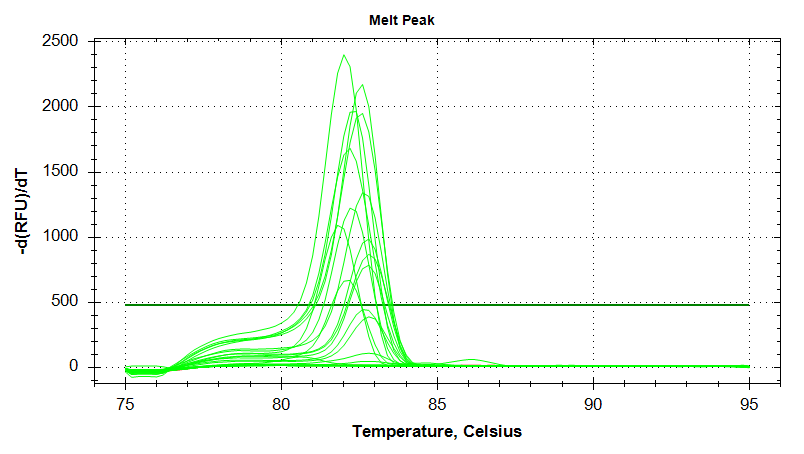
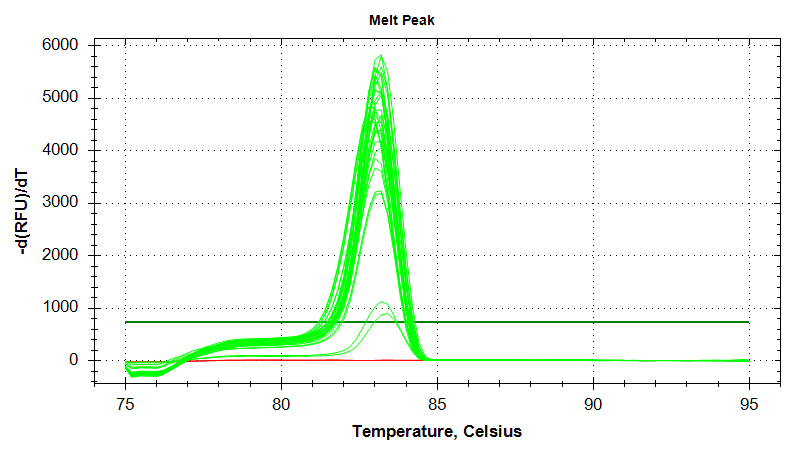
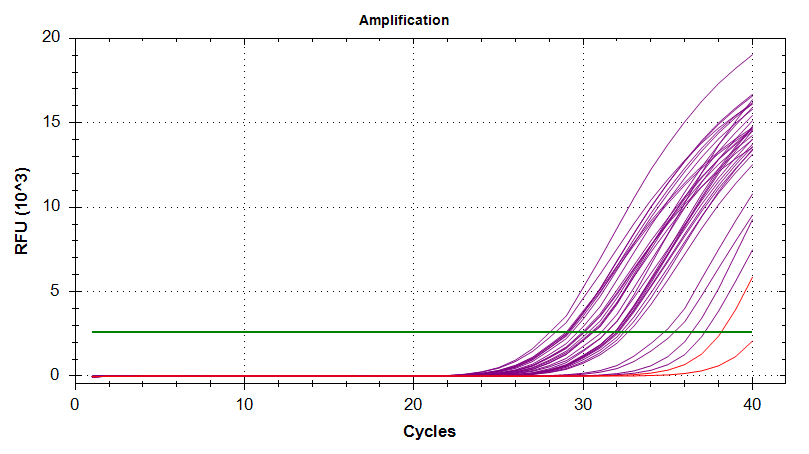
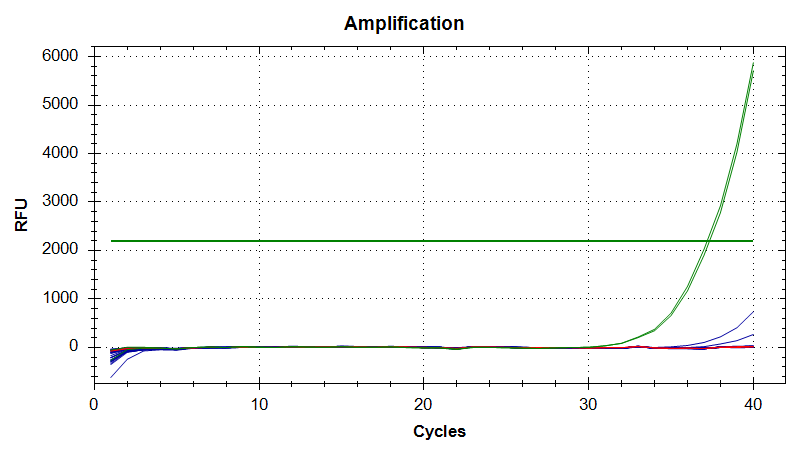
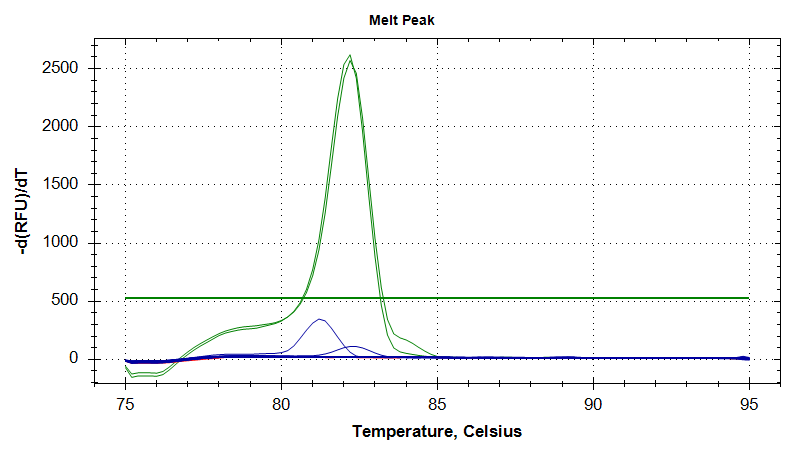
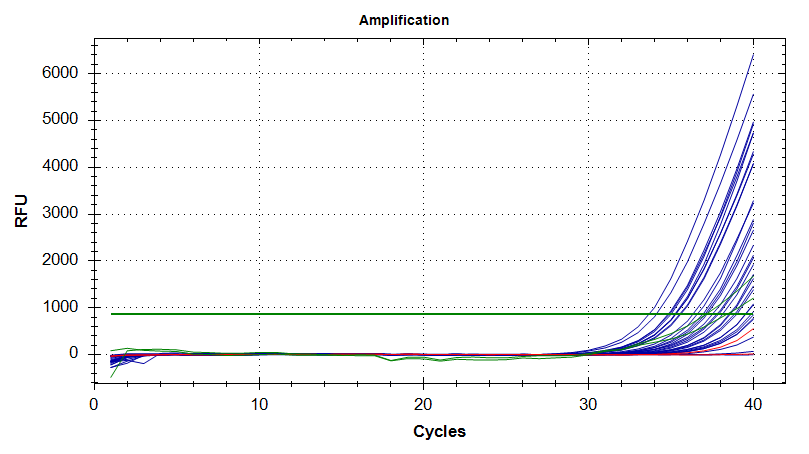
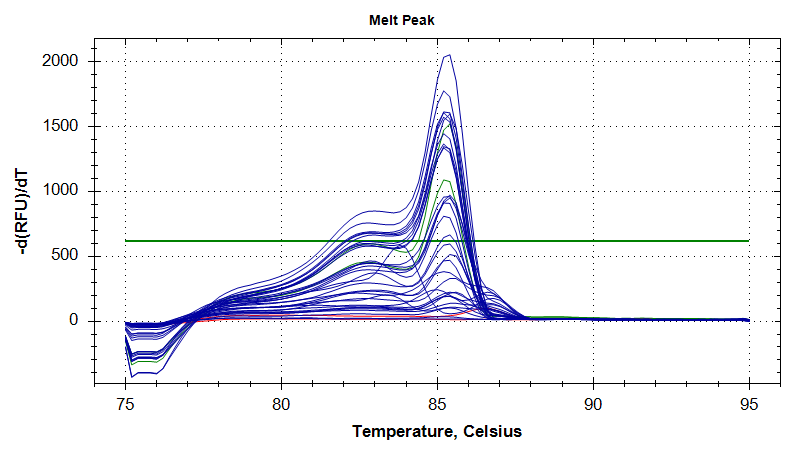
In the plots below, green is the positive control, blue are the samples, and red is the no template control (NTC).
Everything looks great! Nice, clean, gDNA-free RNA! Will proceed with reverse transcription.
Amplification Plots
Melt Curves
qPCR – C.gigas primer and gDNA tests with 18s and EF1 primers
The [qPCR I ran earlier today to check for residual gDNA in Ronit's DNased RNA] turned out terribly, due to a combination of bad primers and, possibly, bad gDNA.
I tracked down some different primers for testing:
- Cg_18s_1644_F (SRID 1168)
- Cg_18s_1750_R (SRID 1169)
- EF1_qPCR_5′ (SRID 309)
- EF1_qPCR_3′ (SRID 310)
In addition to BB15 from 20090519, I decided to test out BB16 from 20090519 as a positive control.
Samples were run on Roberts Lab CFX Connect (BioRad). All samples were run in duplicate. See qPCR Report (Results section) for plate layout, cycling params, etc.
qPCR master mix calcs (Google Sheet):
Results
qPCR Report (PDF):
qPCR File (PCRD):
qPCR Data (CSV):
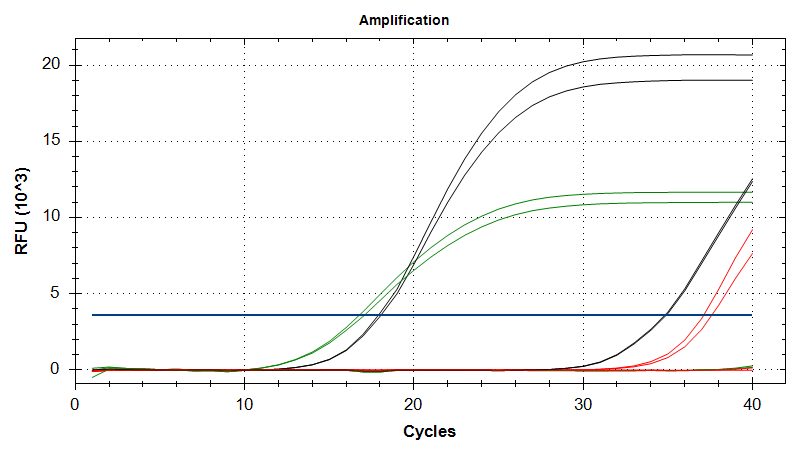
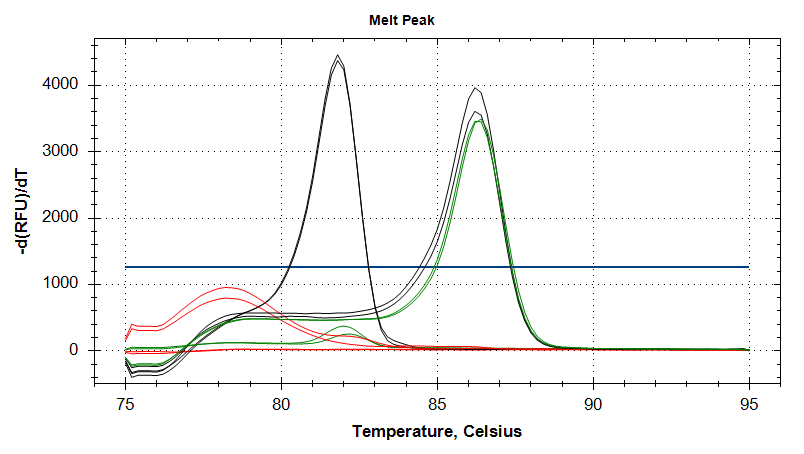
Looks like the elongation factor (EF1) primers and BB16 gDNA as a positive control are the way to go.
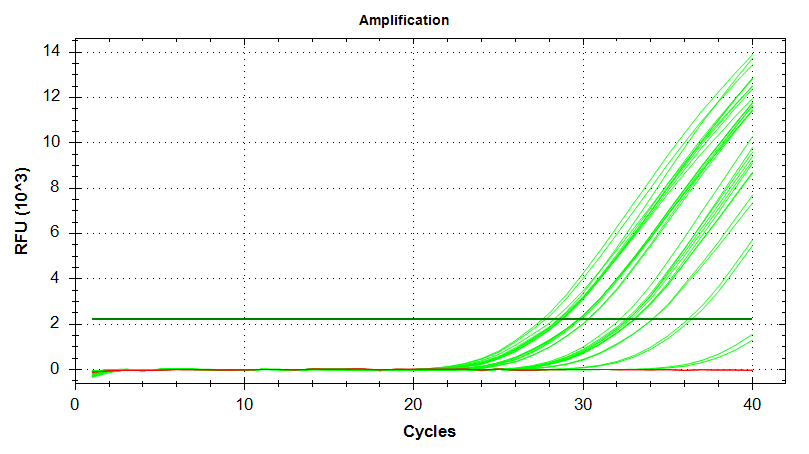
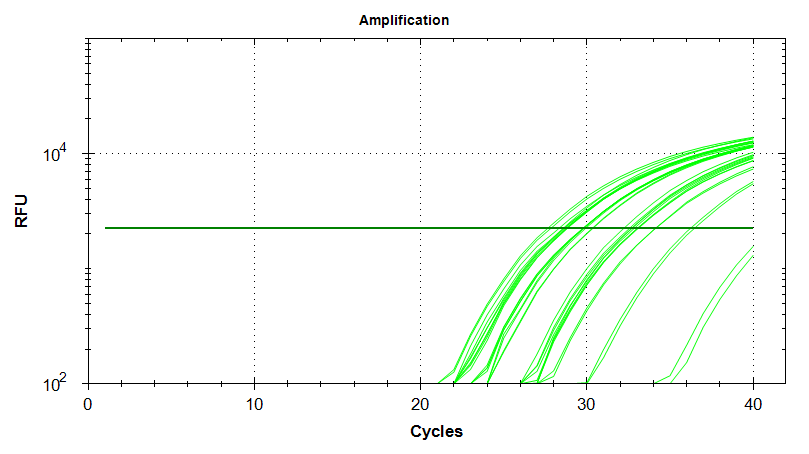
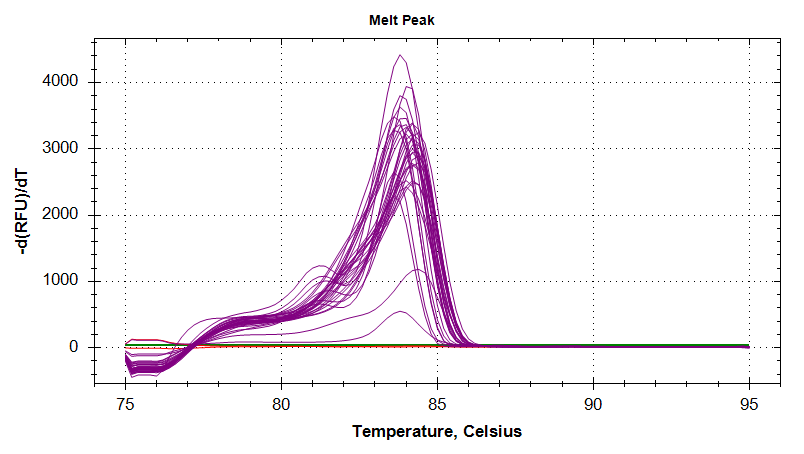
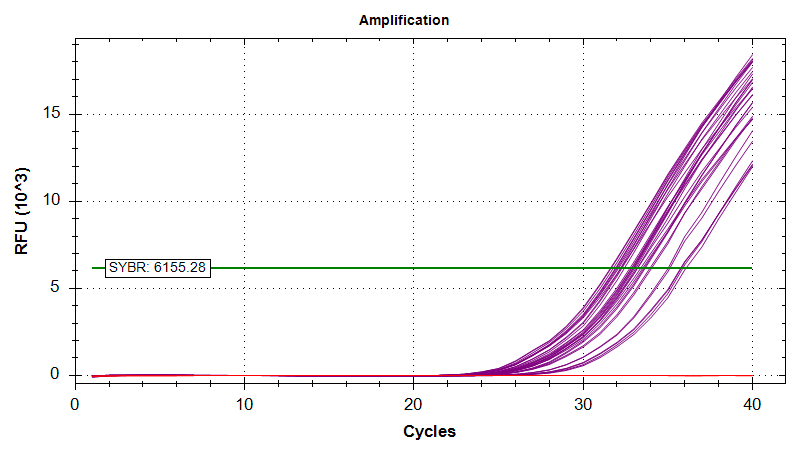
In the plots below, the black lines are BB16, the green lines are BB15, and the red lines are no template controls (NTC).
The amplification plots show that the EF1 primers do not amplify with BB15, but do amplify with BB16 (black lines Cq ~34). The 18s primers amplify with both BB15 & BB16 (Cq ~16 & ~18, respecitively), but produce primer dimers (red lines in amplification and melt curve plots).
Amplification Plots
Melt Curves
qPCR – Ronit’s DNAsed C.gigas Ploidy/Dessication RNA with 18s primers
After DNasing Ronit’s RNA earlier today, I needed to check for any residual gDNA.
Identified some old, old C.gigas 18s primers that should amplify gDNA:
- gigas18s_fw (SRID 157)
- gigas18s_rv (SRID 156)
Used some old C.gigas gDNA (BB15 from 20090519) as a positive control.
Samples were run on Roberts Lab CFX Connect (BioRad). All samples were run in duplicate. See qPCR Report (Results section) for plate layout, cycling params, etc.
qPCR master mix calcs (Google Sheet):
Results
qPCR Report (PDF):
qPCR File (PCRD):
qPCR Data (CSV):
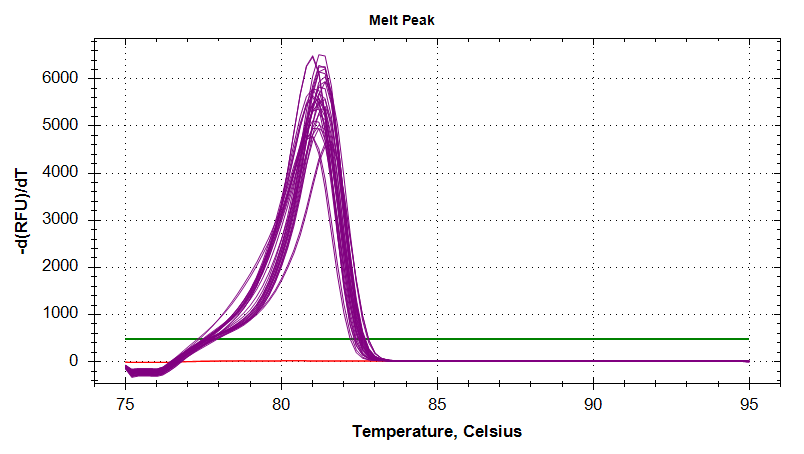
Well, this primer set and/or the gDNA is not good. In the plots below, the positive control gNDA is in green, samples in blue, and no template controls (NTC) are in red.
Poor performance is most easily noticed when looking at the melt curves. They have multiple peaks, suggesting non-specific amplification, even in the positive control.
Additionally, although less evident from just looking at the plots, is the replicates are highly inconsistent. Although it’s possible that might be due to poor technique, it’s very unlikely.
Will have to identify different primers and/or positive control DNA.
Amplification Plots
Melt Curves
DNase Treatment – Ronit’s C.gigas Ploiyd/Dessication Ctenidia RNA
After quantifying Ronit’s RNA earlier today, I DNased them using the Turbo DNA-free Kit (Ambion), according to the manufacturer’s standard protocol.
Used 1000ng of RNA in a 50uL reaction in a 0.5mL thin-walled snap cap tube. Samples were mixed by finger flicking and then incubated 30mins @ 37oC in a PTC-200 thermal cylcer (MJ Research), without a heated lid.
DNase inactivation was performed (0.1 volumes of inactivation reagent; 5uL), pelleted, and supe transferred to new 1.7mL snap cap tube.
Samples were stored on ice in preparation for qPCR to test for residual gDNA.
DNase calculations are here:
Samples will be permanently stored here (Google Sheet):
RNA Quantification – Ronit’s C.gigas Ploidy/Dessication RNA
Last Friday, Ronit quantified 1:10 dilutions of the RNA I isolated on 20181003 and the RNA he finished isolating on 20181011, but two of the samples (D11-C, T10-C) were still too concentrated.
I made 1:20 dilutions (1uL RNA in 19uL 0.1% DEPC-treated H2O) and quantified them using the Roberts Lab Qubit 3.0, with the RNA HS assay. Used 1uL of the diluted RNA.
RESULTS
Qubit data (Google Sheet):
Everything looks good. Added final concentration values (Qubit data x 20, to account for dilution factor) to Ronit’s master sheet (Google Sheet):
Will proceed with DNasing.
Data Received – Chionoecetes bairdi RNAseq & FastQC Analysis
We received Grace’s 100bp PE NovaSeq (Illumian) RNAseq data from the Northwest Genomics Center today.
Data was downloaded via their Aspera browser plugin and rsynced to:
MD5 checksums were generated (md5sum on Ubuntu):
321ec408ba7e0f0be1929ca44871f963  304428_S1_L001_R1_001.fastq.gz
b95c69f755c9c42d9203429119d4234d  304428_S1_L001_R2_001.fastq.gz
a0fd8db312057dedd480231d4d125fd3  304428_S1_L002_R1_001.fastq.gz
c6e70ef7f3c8a866851a1b9453aef36a  304428_S1_L002_R2_001.fastq.gz
FastQC analysis was run, followed by MultiQC.
Output folder (gannet/Atumefaciens):
MultiQC Report (HTML):
Nightingales spreadsheet was updated with file info and FastQC info: