Tag Archives: NanoDrop1000

DNA Quantification – Sea Lice DNA from 20180523

We previously received sea lice (Caligus tape) DNA from Cris Gallardo-Escarate at Universidad de Concepción.

Steven asked that I quantify and assess the DNA quality.

Ran the samples on the Roberts Lab Qubit 3.0 using the dsDNA BR assay (Invitrogen) and 1uL of template DNA.

Ran the samples on the Roberts Lab NanoDrop1000 to get 260/280 values for quality assessment using 2uL of template DNA. NanoDrop1000 was blanked with water, but I don’t know what solvent the DNA is currently resuspended in.


RESULTS

Qubit data (Google Sheet):

SAMPLE CONCENTRATION (ng/uL)
FEMALE 1 23.8
FEMALE 2 9.6

NANODROP DATA

TABLE


ABSORBANCE PLOTS


DNA looks super clean. Not sure what this DNA is intended for so can’t speculate much on what the implications might be for the concentrations on downstream usage.

RNA Cleanup – Tanner Crab RNA

In a continued attempt to figure out what we can do about the tanner crab RNA, Steven tasked me with using an RNeasy Kit to cleanup some existing RNA.

Here’re the samples grace provided:


All of the RNA had some sort of undissolved/insoluble material present. Here’s an example (this is the worts of the bunch – others did not have such large/dense pellets):


Samples were cleaned up using the [RNeasy Plus Mini Kit (Qiagen)]. Added 350uL of Buffer RLT Plus (no beta-mercaptoethanol added) to each sample, vortexed, and then processed according to the manufacturer’s protocol (skipped gDNA Eliminator spin column step).

Samples were eluted with 30uL of nuclease-free water.

Samples were quantified using the Roberts Lab Qubit 3.0 with the RNA High Sensitivity asssay (Invitrogen). Used 5uL of sample for measurements.

Samples were also assessed with the Roberts Lab NandoDrop1000.

Samples were recovered from the pedestal after measurement.

RNA was given to Grace for storage at -80C.


RESULTS

Qubit measurements (Google Sheet):
20180731_qubit_RNA_crab_cleanup


NanoDrop Table:


All concentrations were too low for detection via NanoDrop.

Qubit quantification indicate yields ranging from ~25ng to ~192.5ng.

Will share info with Grace and let her compare these numbers to her original concentrations to see if there’s any differences.

Regardless, based on my earlier RNA isolation today, these samples should now be much cleaner and we should be able to trust the Qubit quantifications.

RNA Isolation – Tanner Crab Hemolymph Using RNeasy Plus Mini Kit

Tanner crab RNA has proved a bit troublesome. As such, Steven asked me to try isolating some RNA using the RNeasy Plus Mini Kit (Qiagen) to see how things would turn out.

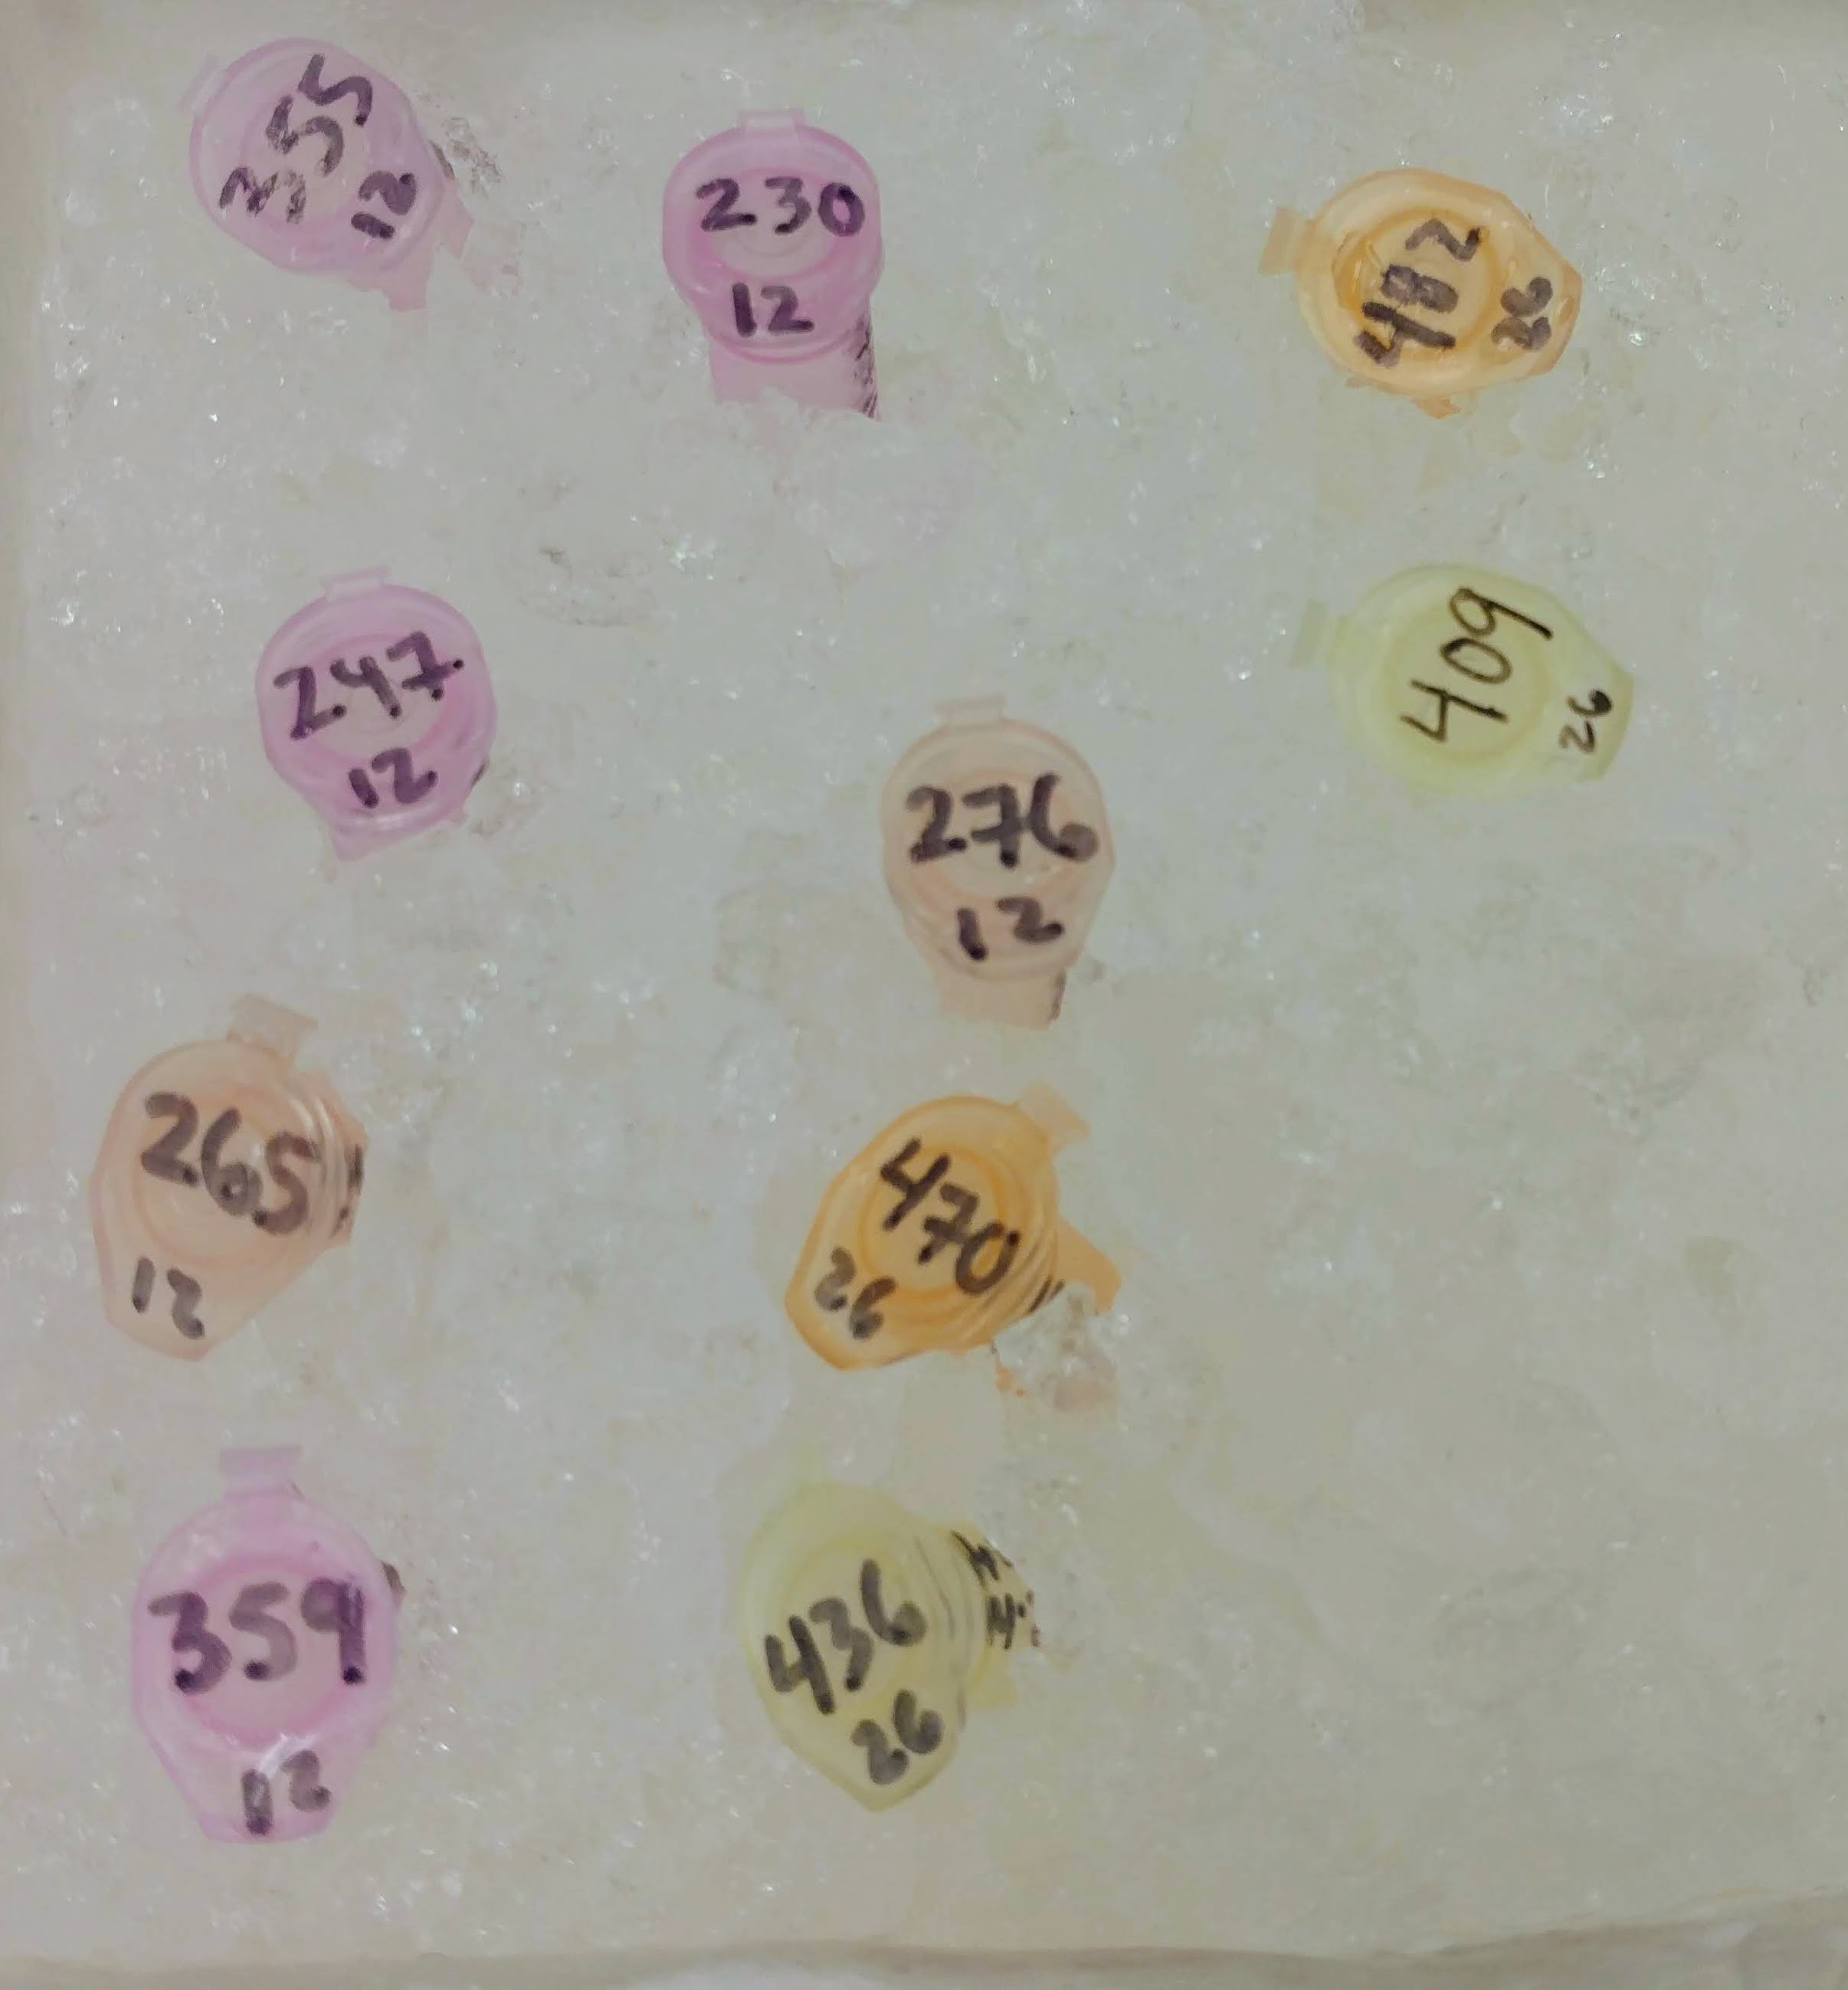
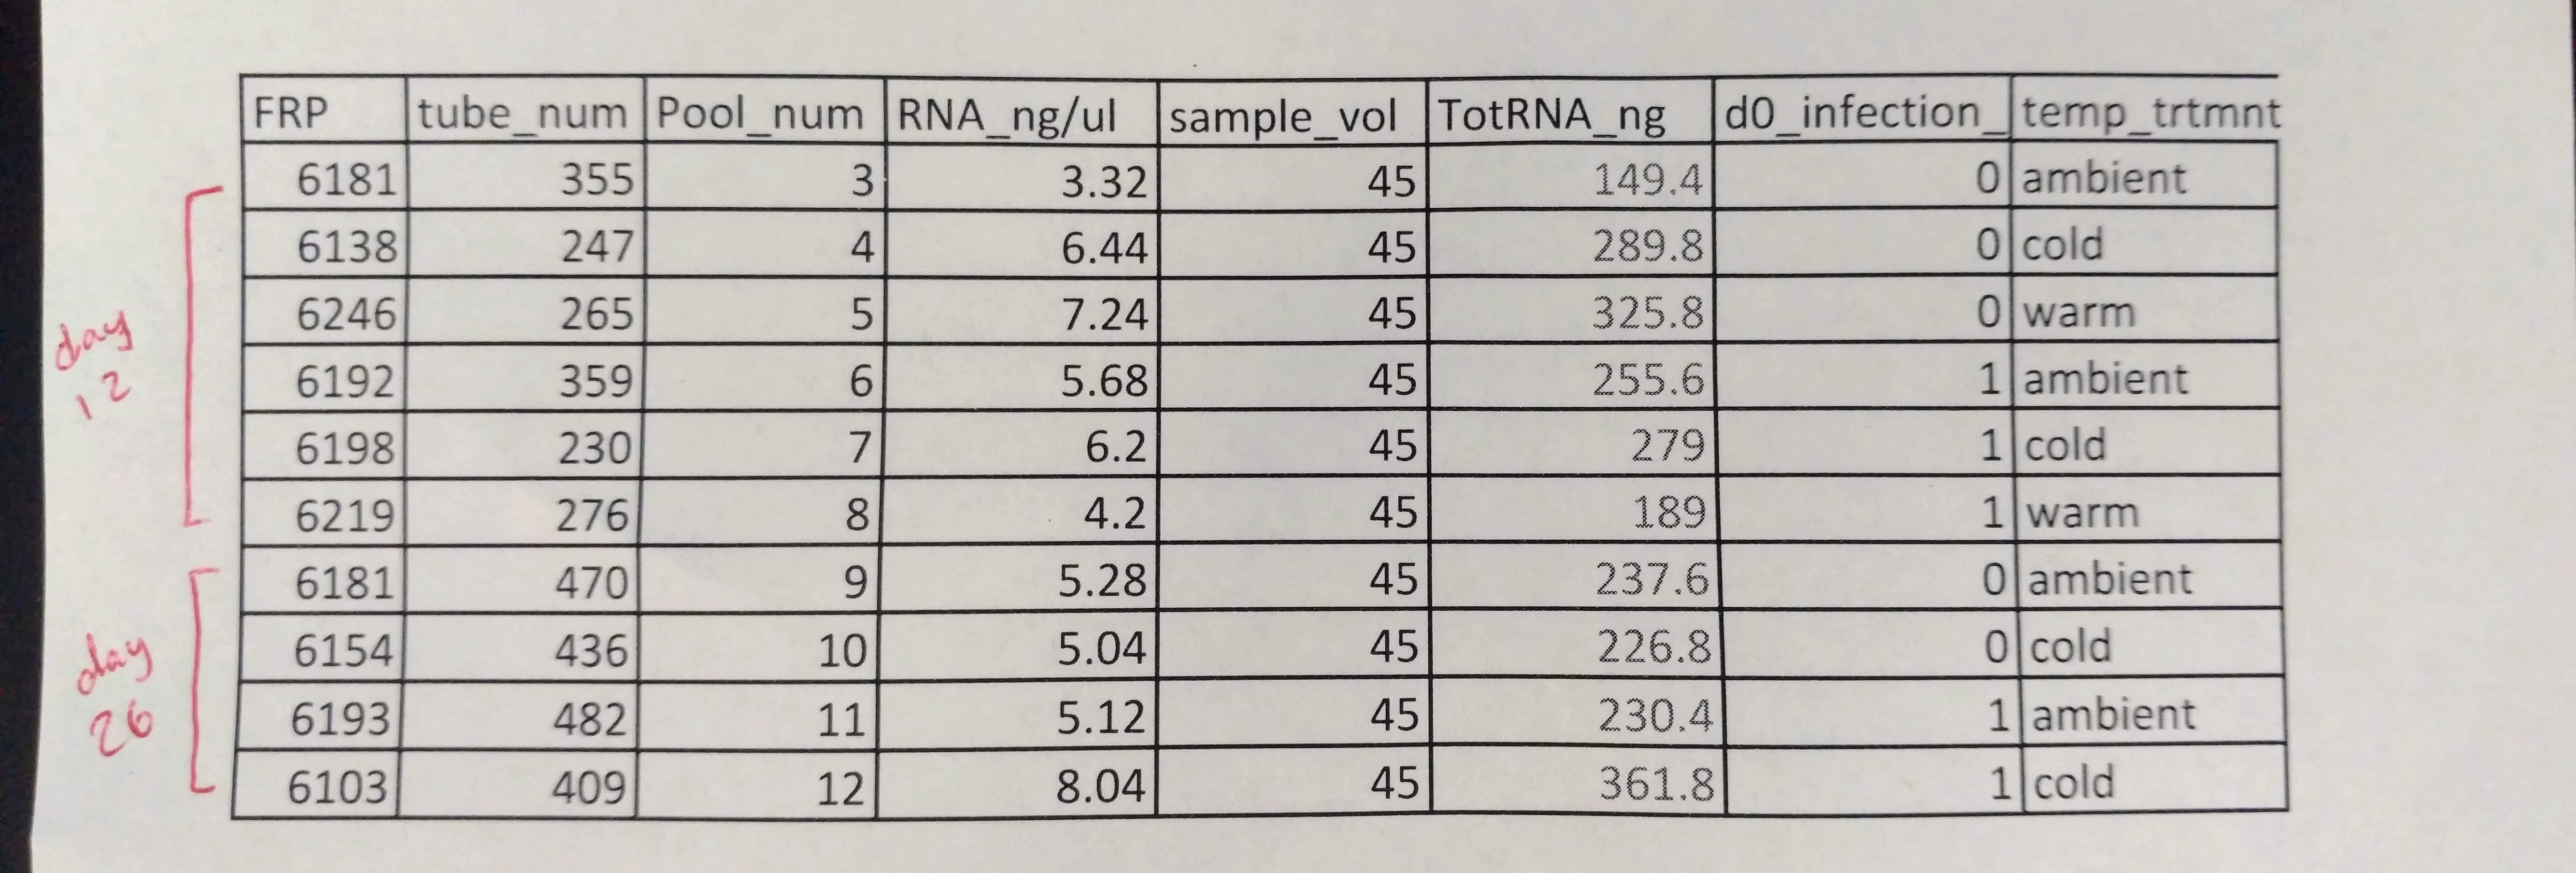
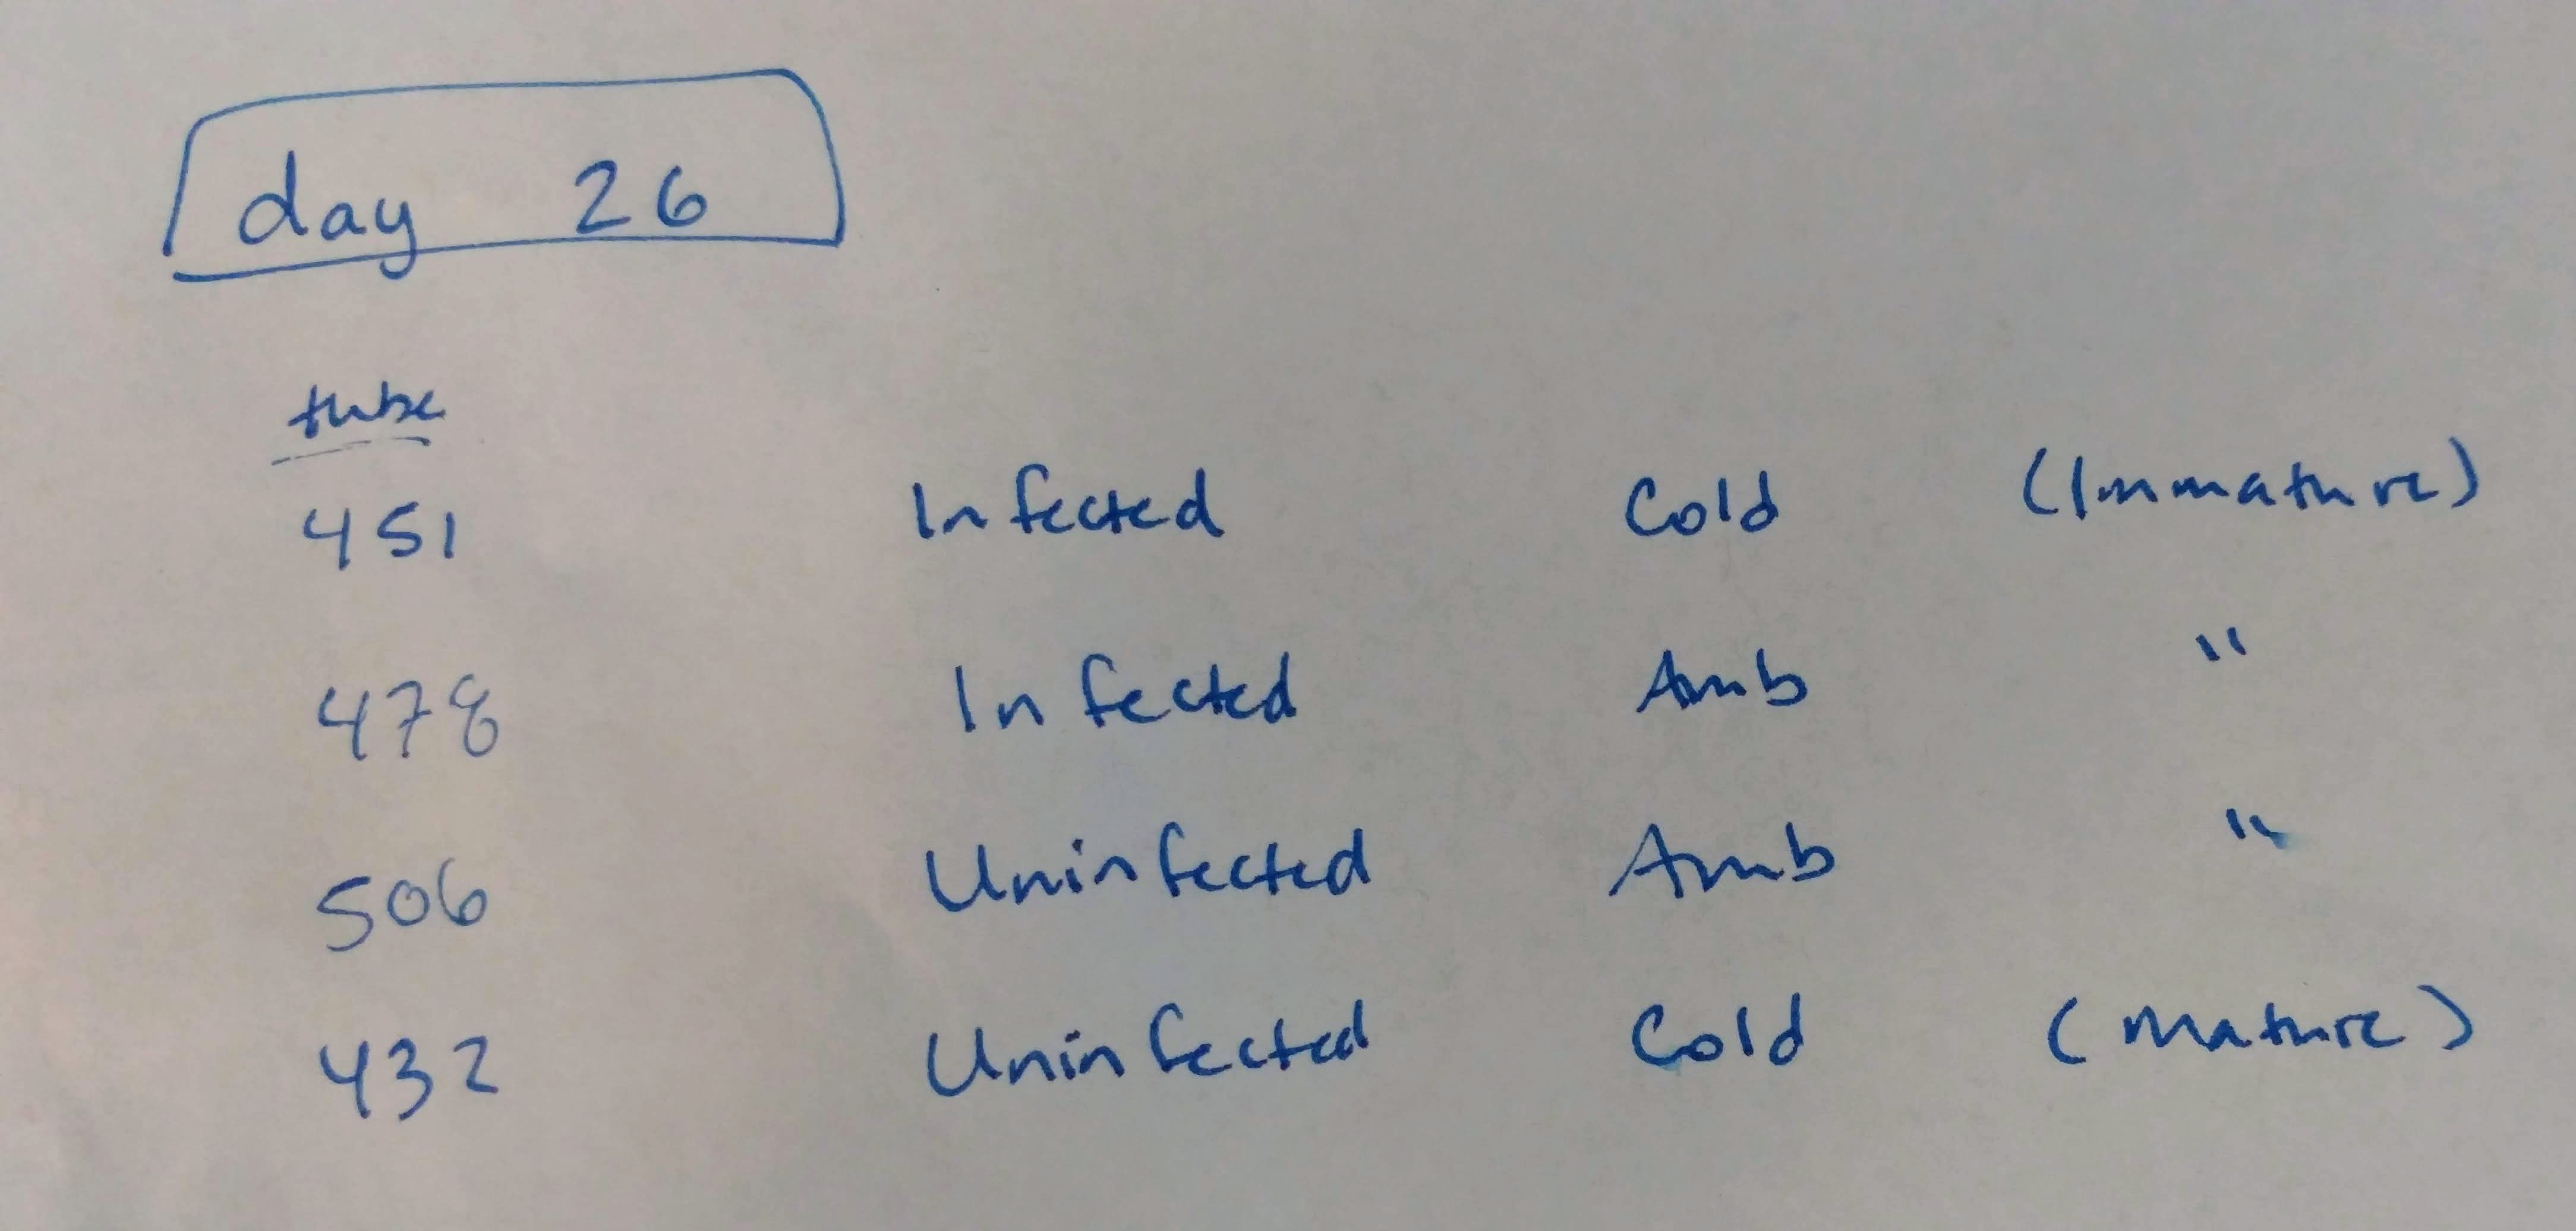
Grace provided me with the following samples:


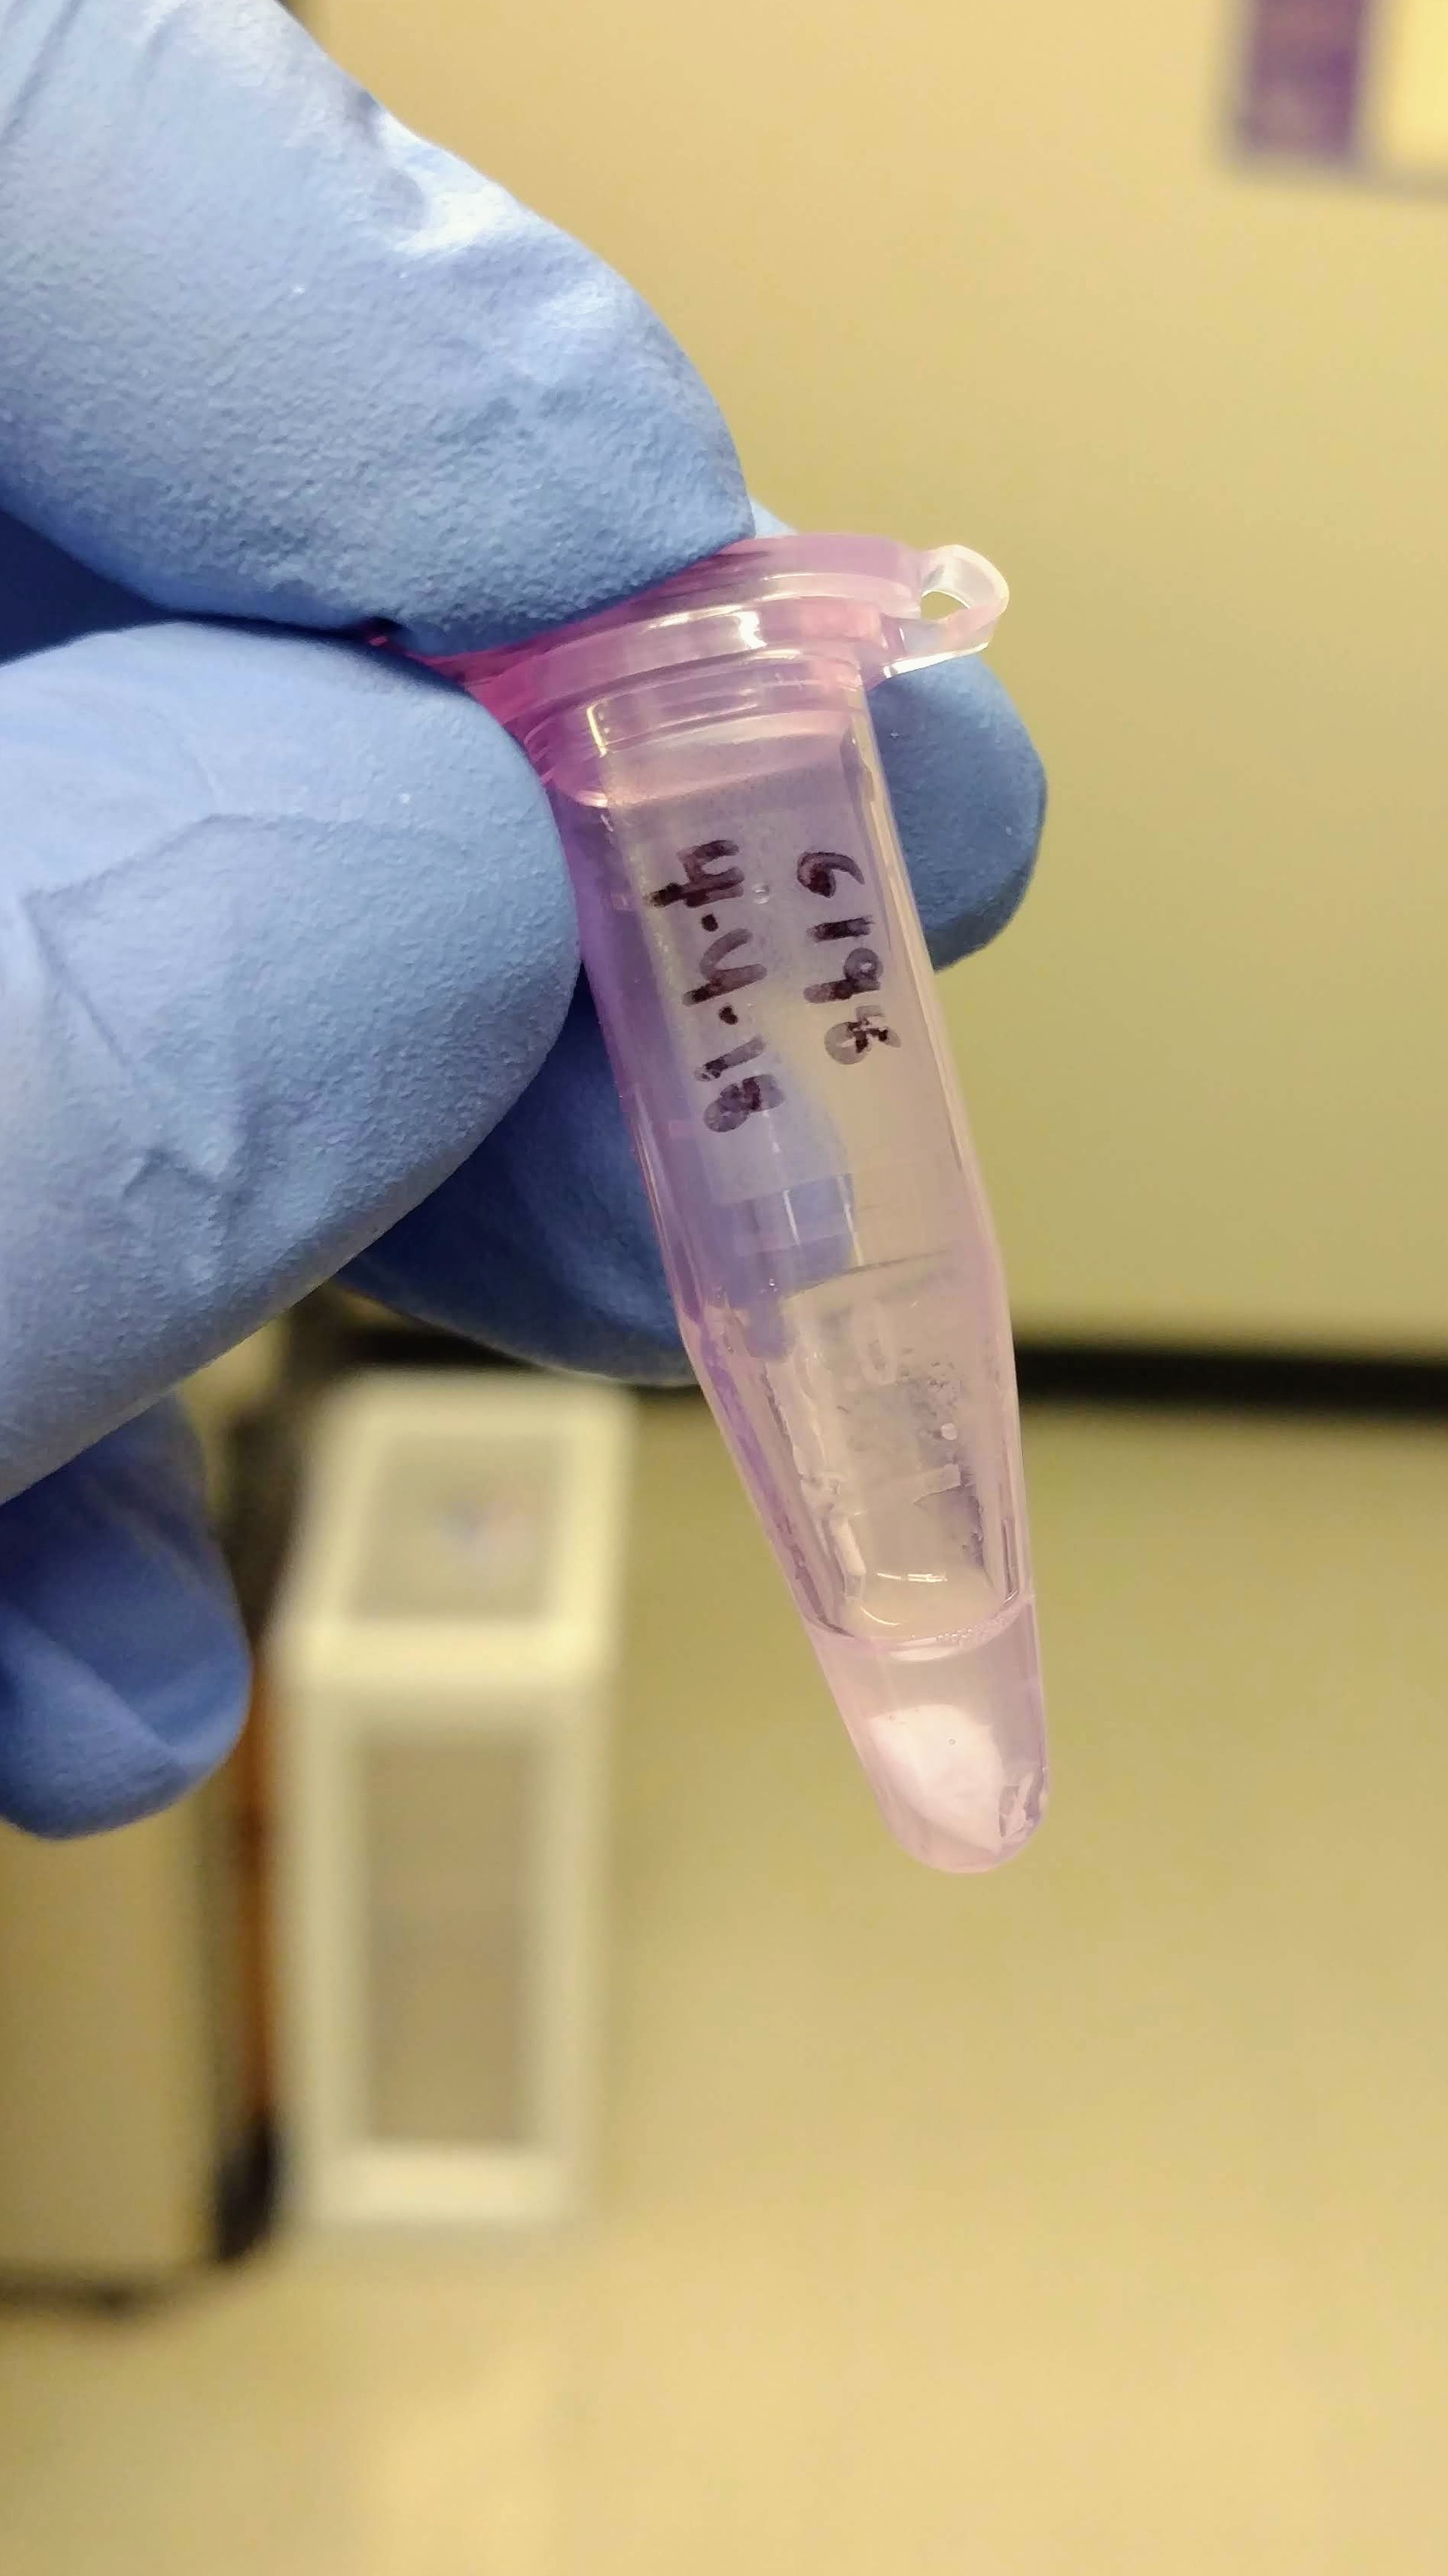
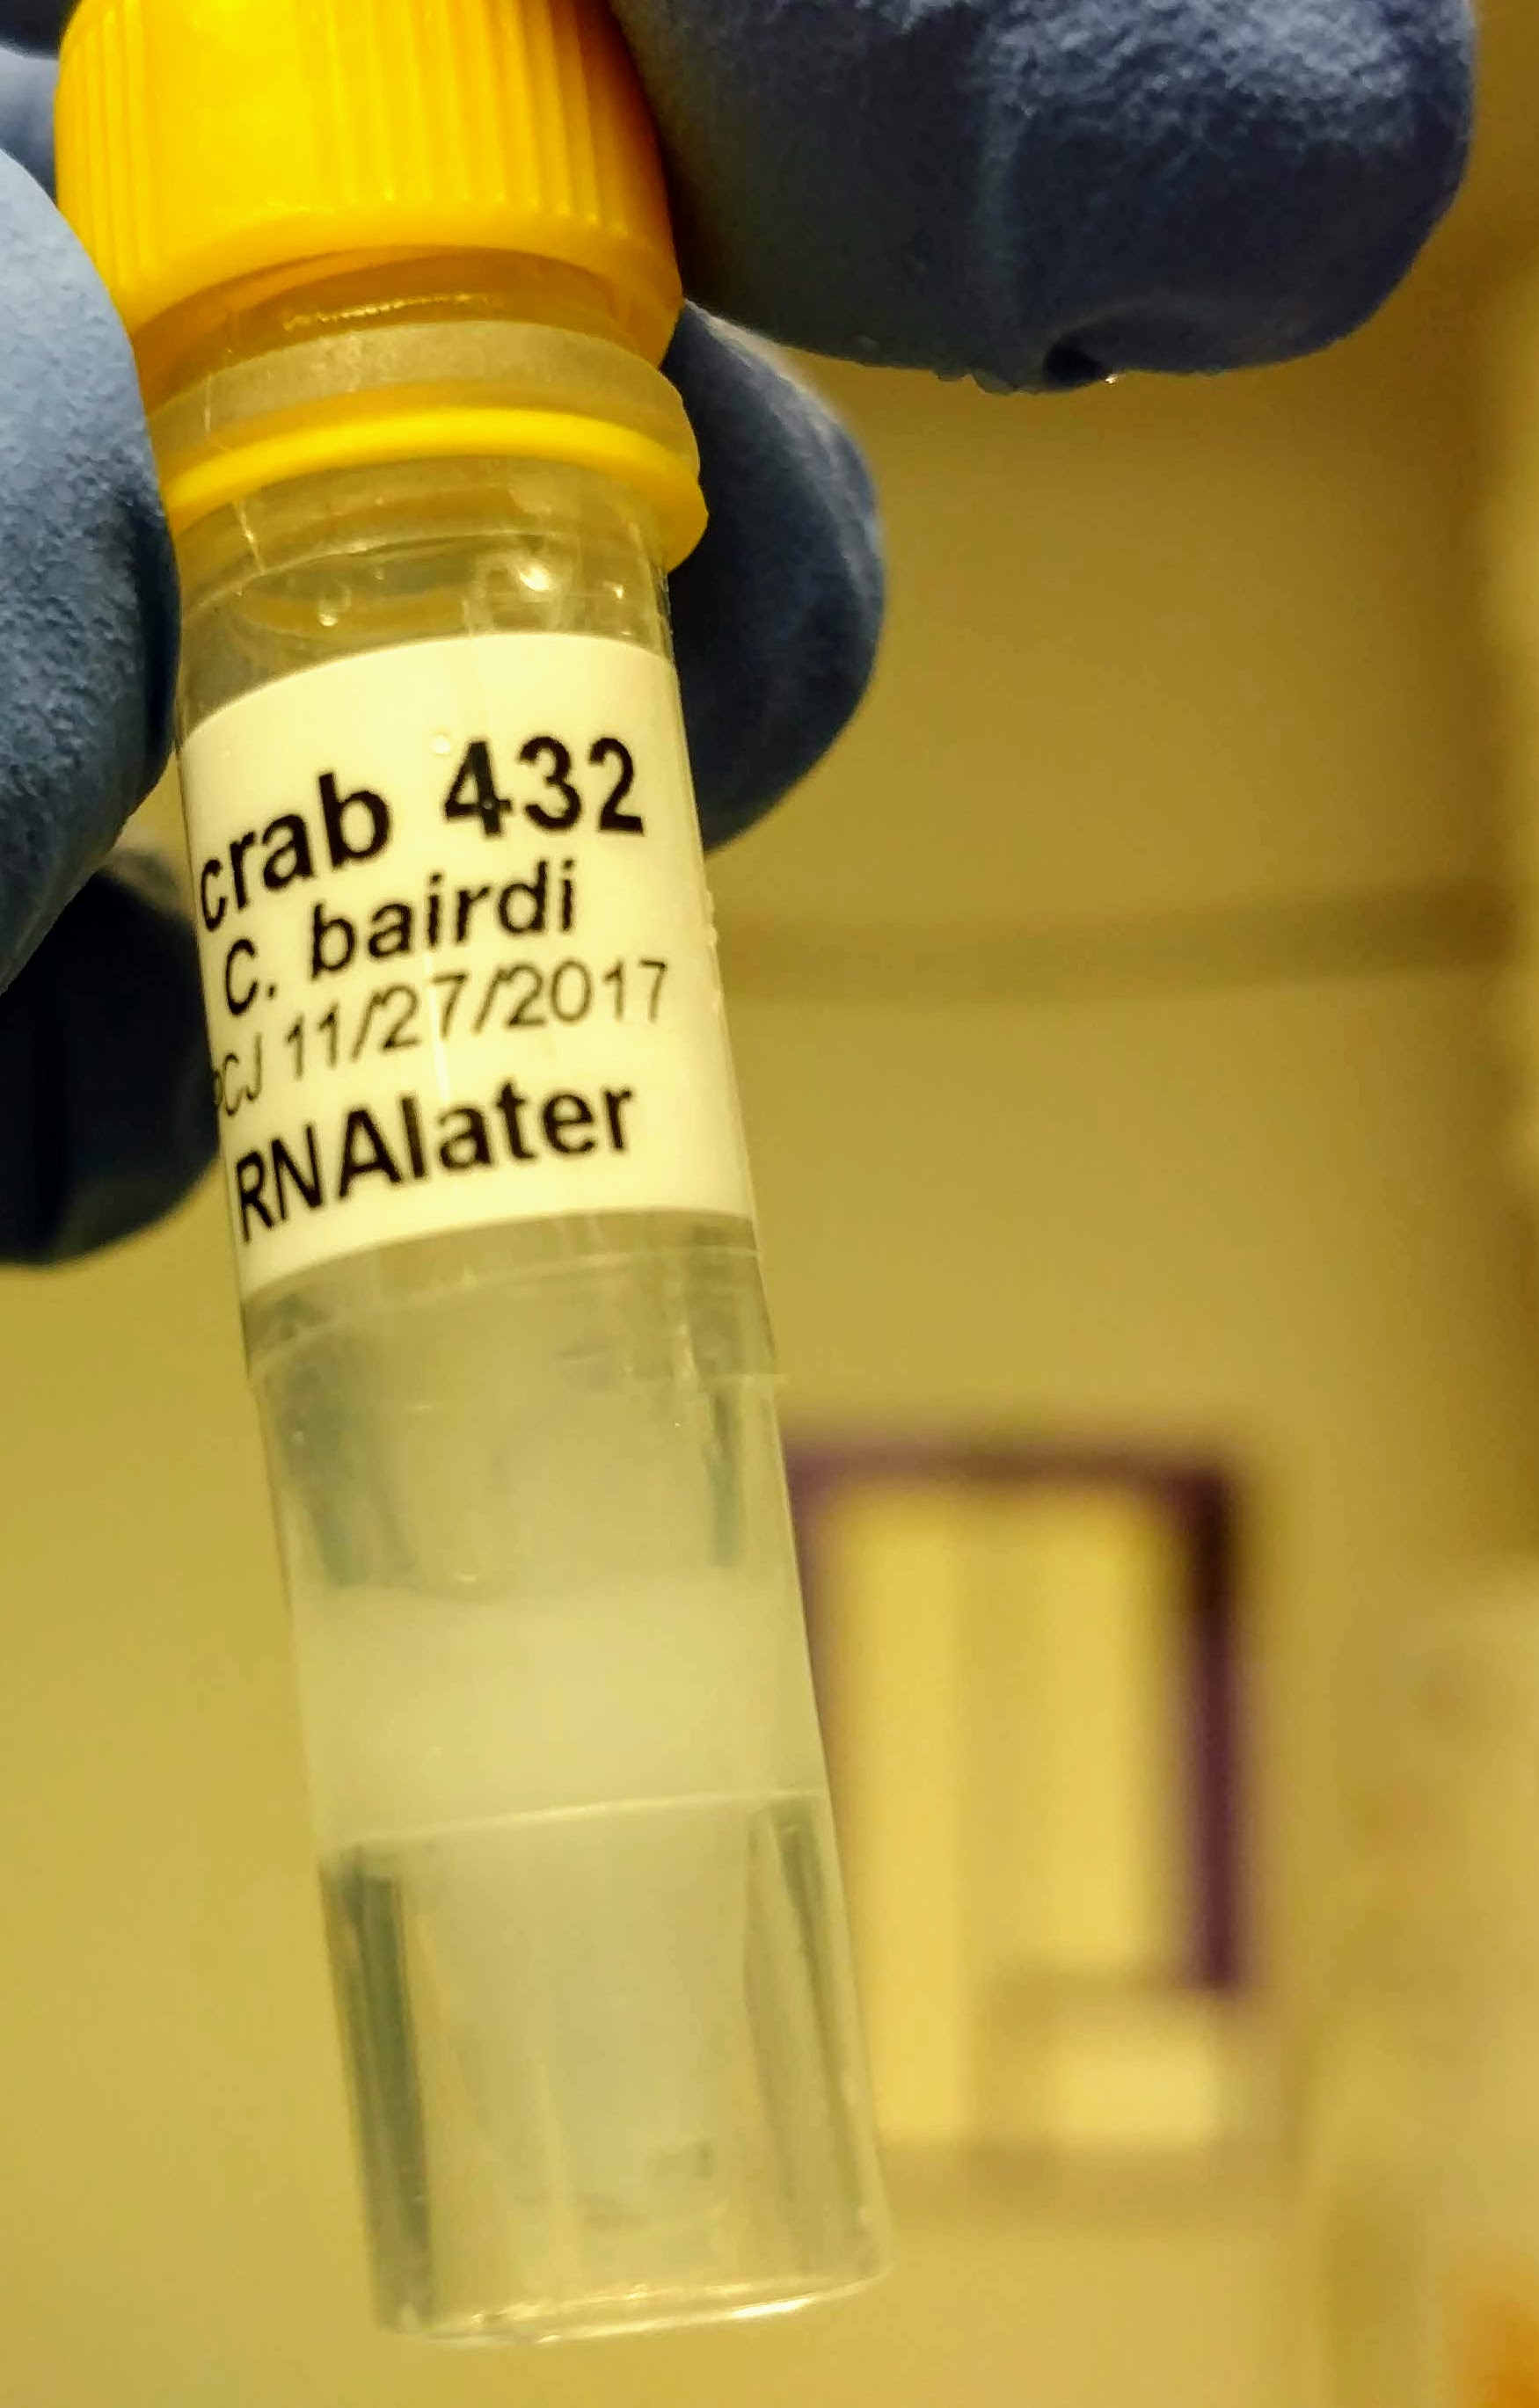
Crab hemolymph had been collected (100uL?) and preserved with 1mL (?) of RNAlater. Grace pelleted the samples, removed the supernatant, and stored the pelleted material at -80C. Here’s what that looked like:


RNA was isolated according to the manufacturer’s protocol – following guideline for samples with < 1 x 10⁶ cells.

One interesting thing that happened is a precipitate formed after adding the initial buffer to the sample:

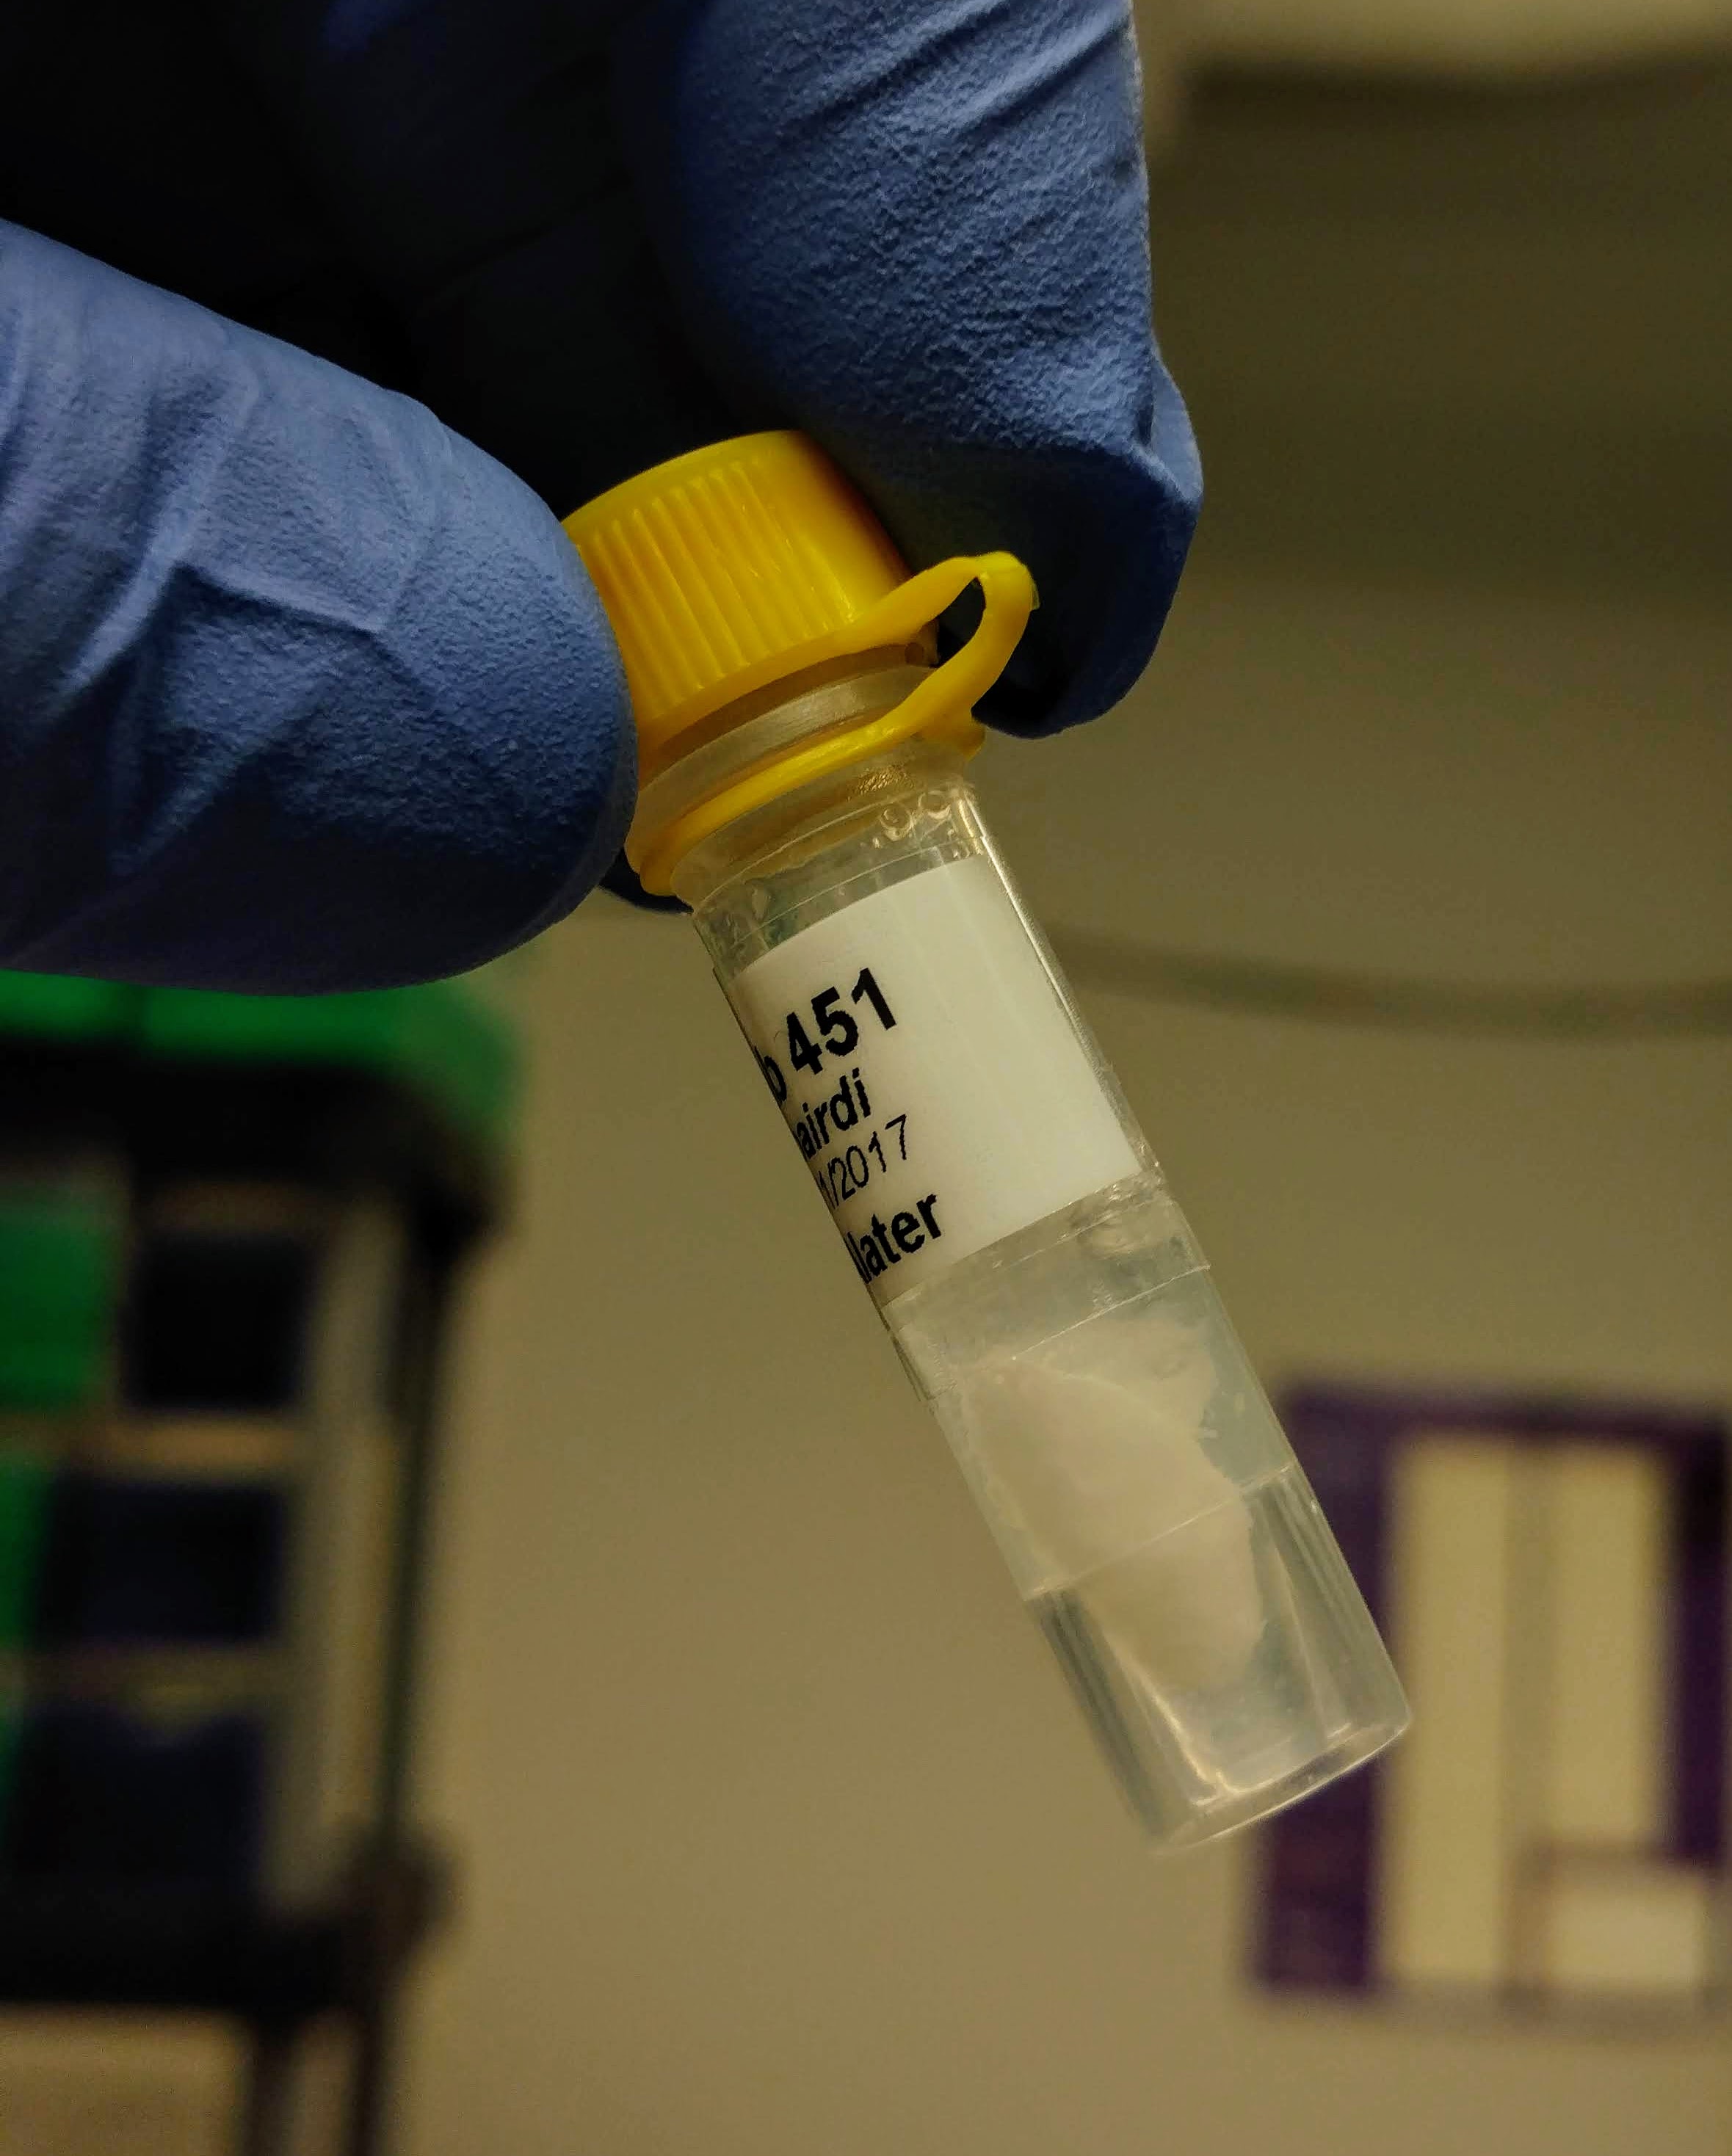
A solid precipitate formed in each of the tubes that could not be dispersed – it actually looked like a small piece of paper was now present in each tube.

Samples were spun and the supernatant was utilized (this was the normal progression of the protocol, regardless of this precipitate forming).

Samples were eluted with 30uL of nuclease-free water.

Samples were quantified using the Roberts Lab Qubit 3.0 with the RNA High Sensitivity asssay (Invitrogen). Used 5uL of sample for measurements.

Samples were also assessed with the Roberts Lab NandoDrop1000. Samples were recovered from the pedestal after measurement.

RNA was given to Grace for storage at -80C.


RESULTS

Qubit measurements (Google Sheet):
20180731_qubit_RNA_crab_isos


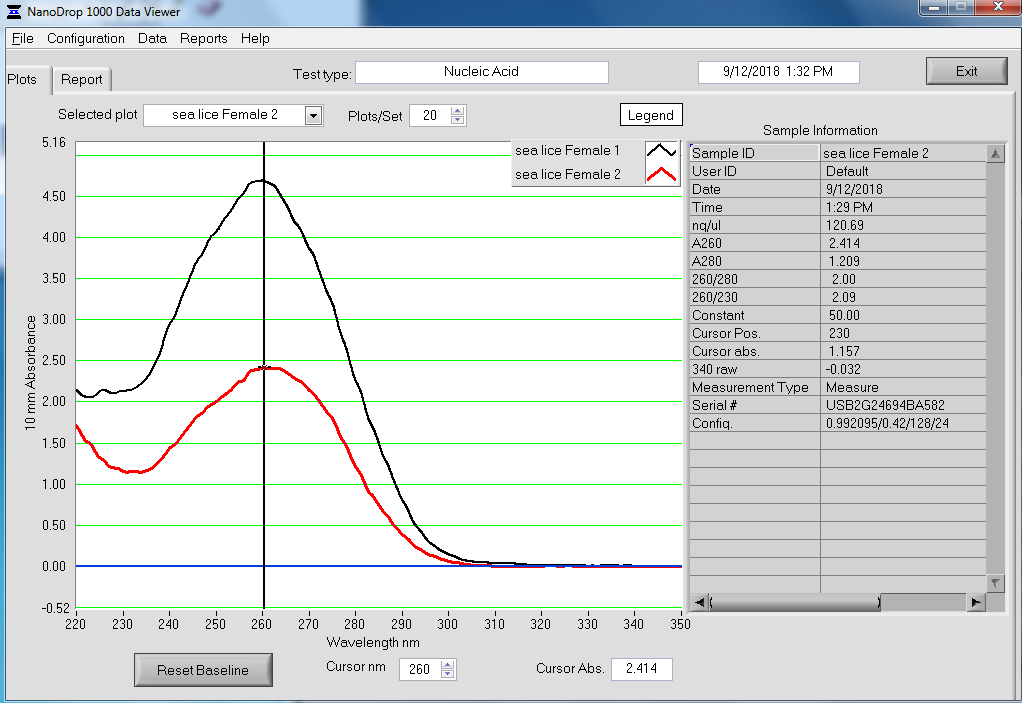
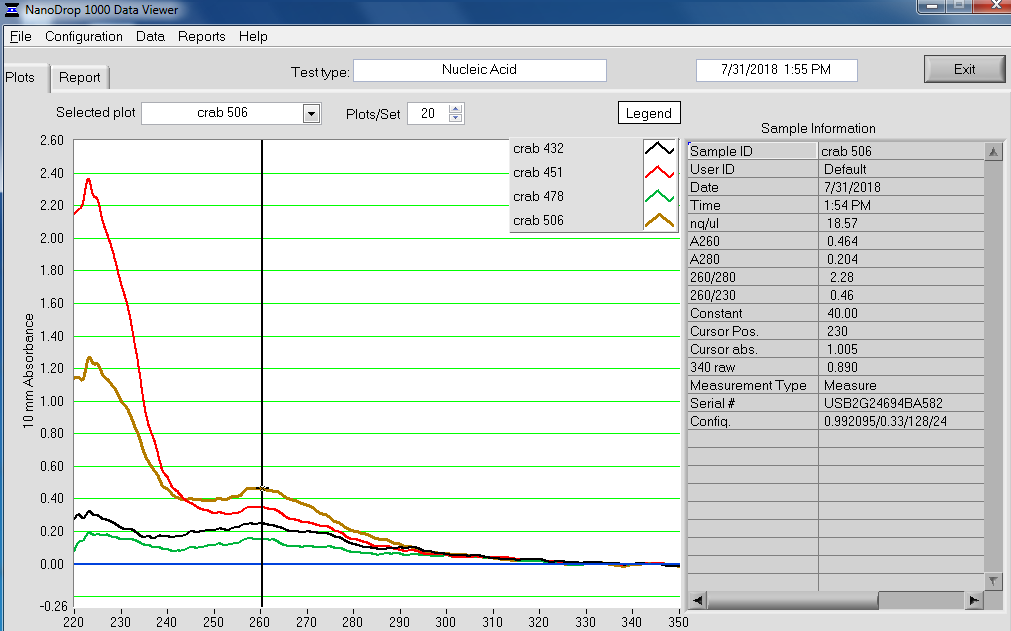
NanoDrop Spec Curves:
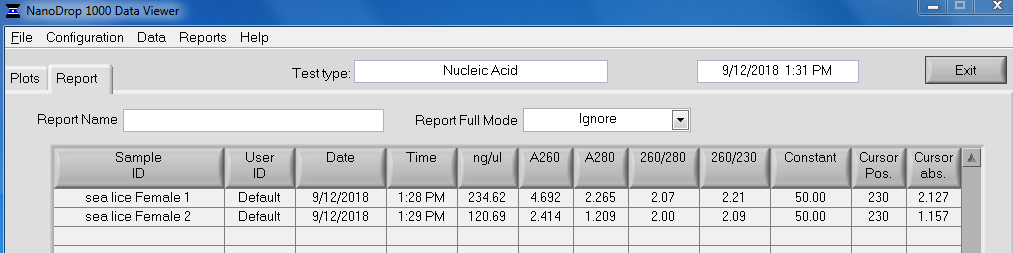
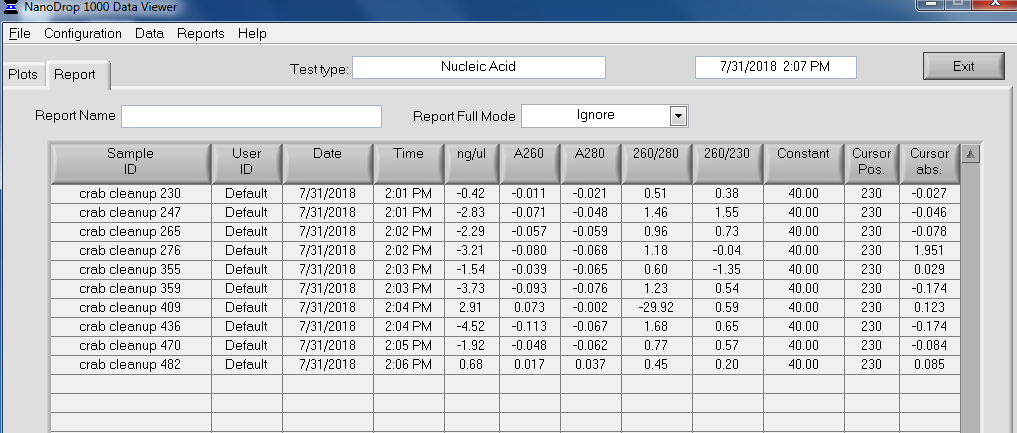
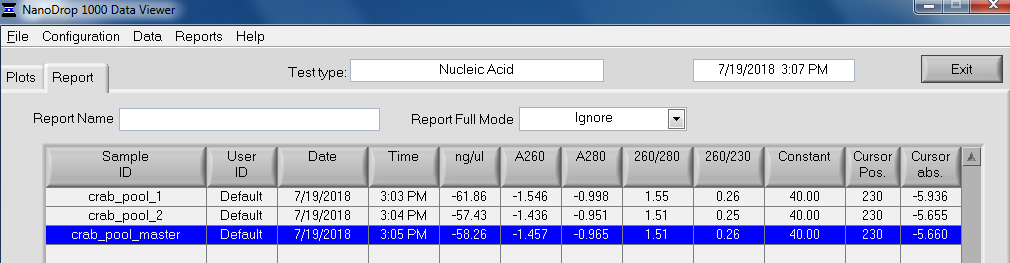

NanoDrop Table:


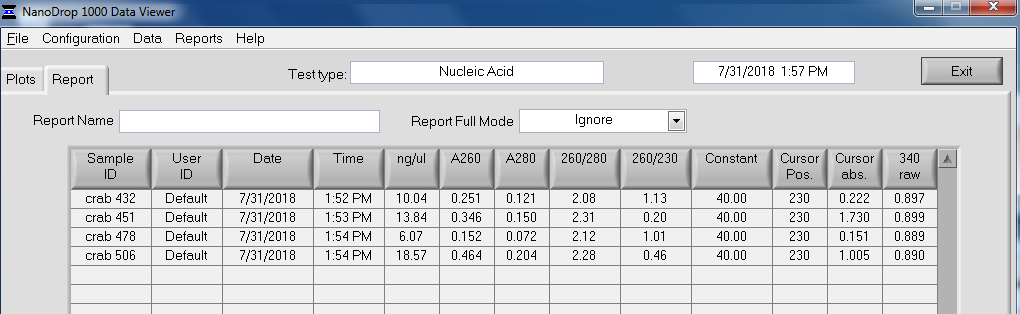
Overall, the isolation looks pretty good. The purity looks good (NanoDrop 260/280 ratios) and the absorbance peak at 260nm is exactly where we would want/expect it to be.

The yields (according to the Qubit) are OK. They range from ~37ng – 350ng.

The important part is that this method produced clean RNA, which means the quantification is believable. I think Grace’s earlier RNA isolations using RNAzol RT had too much contamination carried over, leading to incorrect quantification measurements.

Going forward, I think we need to use some sort of isolation kit, however, we will be testing out good, old TriReagent as well.

RNA Cleanup – Tanner Crab RNA Pools

Grace had previously pooled a set of crab RNA in preparation for RNAseq. Yesterday, we/she concentrated the samples and then quantified them. Unfortunately, Qubit results were not good (concentrations were far below the expected 20ng/uL) and the NanoDrop1000 results yielded awful looking curves.

In an attempt to figure out what was wrong, I decided to use the RNeasy Plus Mini Kit (Qiagen) on the three pools. I did this due to the poor spec curves seen in the NanoDrop1000 measurements. Additionally, all of the RNA pools had undissolved/insoluble bits floating around in them. My thinking was that excess contaminants/salts could be interfering with the Qubit assay. Removing these could/should enlighten us as to what the issue might be.

Followed the manufacturer’s protocol for RNeasy MiniElute Cleanup Kit (as the RNeasy Plus Mini Kit uses the same reagents/columns for RNA purification) for samples with <100uL.

Samples were quantified on the RobertsLab NanoDrop1000 (ThermoFisher) and the Qubit 3.0 (ThermoFisher) using the RNA high sensitivity (HS) Kit. Used 1uL of each sample.

Results:

Qubit (Google Sheet): 20180719_qubit_RNA_crab_pools

NanoDrop:

The NanoDrop did not detect any RNA in the samples.

The Qubit did not detect any RNA in Crab Pool 1. The other two samples had similar concentrations (~7ng/uL). This would mean a total of ~84ng of RNA was present in each of those two samples.

All pools were expected to have well over 1000ng of RNA.

Will have to think about what should be done, but I would lean towards attempting to run some “test” samples through the RNeasy Cleanup kit to see if that would help get us more accurate Qubit readings? I don’t know, though…

DNA Isolation – Olympia Oyster Outer Mantle gDNA

Isolated additional gDNA for the genome sequencing. To try to improve the quality (260/280 & 260/230 ratios) of the gDNA, I added a chloroform step after the initial tissue homogenization.

Used 123mg of Ostrea lurida outer mantle collected by Brent & Steven on 20150812.

  • Homogenized in 500μL of DNAzol.
  • Added additional 500μL of DNAzol.
  • Centrifuged 12,000g, 10mins, @ RT.
  • Split supernatant equally into two tubes.
  • Added 500μL of chloroform and mixed moderately fast by hand.
  • Centrifuged 12,000g, 10mins, RT.
  • Combined aqueous phases from both tubes in a clean tube.
  • Added 500μL of 100% EtOH and mixed by inversion.
  • Spooled precipitated gDNA and transferred to clean tube.
  • Performed 3 washes w/70% EtOH.
  • Dried pellet 3mins.
  • Resuspended in 200μL of Buffer EB (Qiagen).
  • Centrifuged 10,000g, 5mins, RT to pellet insoluble material.
  • Transferred supe to clean tube.

DNA was quantified using two methods: NanoDrop1000 & Qubit 3.0 (ThermoFisher).

For the Qubit, the samples were quantified using the Qubit dsDNA BR reagents (Invitrogen) according to the manufacturer’s protocol and used 1μL of sample for measurement.

Results:

Qubit Data (Google Sheet): 20151125_qubit_gDNA_geoduck_oly_quants

METHOD CONCENTRATION (ng/μL) TOTAL (μg)
Qubit 137 27.4
NanoDrop1000 295 59.0


Yield is solid. We should finally have sufficient quantities of gDNA to allow for BGI to proceed with the rest of the genome sequencing! Will run sample on gel to evaluate integrity and then send off to BGI.

The NanoDrop & Qubit numbers still aren’t close (as expected).

The addition of the chloroform step definitely helped improve the 260/280 OD ratio (see below). However, the addition of that step had no noticeable impact on the 260/230 OD ratios, which is a bit disappointing.


NanoDrop Absorbance Values & Plots


DNA Isolation – Geoduck Ctenidia gDNA

Isolated additional gDNA for the genome sequencing. In an attempt to obtain better yields, I used ctenidia (instead of adductor muscle). Additionally, to try to improve the quality (260/280 & 260/230 ratios) of the gDNA, I added a chloroform step after the initial tissue homogenization.

Used 190mg of Panopea generosa ctenidia collected by Brent & Steven on 20150811.

  • Homogenized in 500μL of DNAzol.
  • Added additional 500μL of DNAzol.
  • Centrifuged 12,000g, 10mins, @ RT.
  • Split supernatant equally into two tubes.
  • Added 500μL of chloroform and mixed moderately fast by hand.
  • Centrifuged 12,000g, 10mins, RT.
  • Combined aqueous phases from both tubes in a clean tube.
  • Added 500μL of 100% EtOH and mixed by inversion.
  • Spooled precipitated gDNA and transferred to clean tube.
  • Performed 3 washes w/70% EtOH.
  • Dried pellet 3mins.
  • Resuspended in 200μL of Buffer EB (Qiagen).
  • Centrifuged 10,000g, 5mins, RT to pellet insoluble material.
  • Transferred supe to clean tube.

DNA was quantified using two methods: NanoDrop1000 & Qubit 3.0 (ThermoFisher).

For the Qubit, the samples were quantified using the Qubit dsDNA BR reagents (Invitrogen) according to the manufacturer’s protocol and used 1μL of sample for measurement.

Results:

Qubit Data (Google Sheet): 20151125_qubit_gDNA_geoduck_oly_quants

METHOD CONCENTRATION (ng/μL) TOTAL (μg)
Qubit 105 21.0
NanoDrop1000 173 34.6


Yield is definitely much, much better than adductor muscle! Should’ve switched to a different tissue a long time ago! We should finally have sufficient quantities of gDNA to allow for BGI to proceed with the rest of the genome sequencing! Will run sample on gel to evaluate integrity and then send off to BGI.

The NanoDrop & Qubit numbers still aren’t close (as expected).

The addition of the chloroform step definitely helped improve the 260/280 OD ratio (see below). However, the addition of that step had no noticeable impact on the 260/230 OD ratios, which is a bit disappointing.


NanoDrop Absorbance Values & Plots


Phenol-Chloroform DNA Cleanup – Geoduck gDNA

The gDNA I extracted on 20151104 didn’t look great on the NanoDrop so I decided to perform a phenol-chloroform cleanup to see if I could improve the NanoDrop1000 absorbance spectrum and, in turn, the quality of the gDNA.

  • Added an equal volume (500μL) of phenol:chloroform:isoamyl alcohol (25:24:1) to the DNA
  • Mixed by hand – moderate shaking
  • Centrifuged 2mins, 10,000g, RT
  • Transferred aqueous phase to clean tube and discarded interphase & organic phase
  • Added an equal volume (280μL) of chlforoform:isoamyl alcohol (24:1)
  • Mixed by hand – moderate shaking
  • Centrifuged 2mins, 10,000g, RT
  • Transferred aqueous phase (210μL) to clean tube
  • Added 0.1vols (21μL) of 3M sodium acetate (pH = 5.2)
  • Added 2vols (420μL) of 100% EtOH
  • Mixed by inversion
  • Incubated @ -20C, 1hr (probably not necessary since gDNA clearly precipitated out as soon as I mixed the sample)
  • Pelleted DNA by centrifuging 15mins, 12,000g, RT
  • Discarded supe
  • Washed pellet with 1000μL cold (-20C) 70% EtOH
  • Centrifuged 5mins, 12,000g, RT
  • Discarded supe
  • Repeated was steps three more times
  • Resuspended pellet in 100μL of Buffer EB (Qiagen)

DNA was quantified using two methods: NanoDrop1000 & QuantIT dsDNA BR Kit

For the Quant-IT kit, the samples were quantified using the QuantIT dsDNA BR Kit (Invitrogen) according to the manufacturer’s protocol.

Standards were run in triplicate, samples were run in duplicate.

96-well black (opaque) plate was used.

Fluorescence was measured on the Seeb Lab’s Victor 1420 plate reader (Perkin Elmer).

Results:

METHOD CONCENTRATION (ng/μL) VOLUME (μL) YIELD (ng)
NanoDrop1000 371.83 100 37,183
Quant-IT 100.83 100 10,082


The NanoDrop1000 overestimates the concentration of the sample by 3.7x!

Regardless, the yield isn’t all that great (using yield from Quant-IT), which has generally been the case for all of the geoduck gDNA isolations I’ve performed. It would probably be prudent to try isolating gDNA from a different tissue to see if yields improve…

Will evaluate gDNA quality on a gel.

Fluorescence (Google Sheet): 20151124_geoduck_oly_gDNA_quants


NanoDrop1000 Measurements and Plots

The clean up procedure didn’t really seem to help with the geoduck sample, as we’re still seeing a significant amount of absorbance from 230 – 250nm.

Phenol-Chloroform DNA Cleanup – Olympia Oyster gDNA

The gDNA I extracted on 20151104 didn’t look great on the NanoDrop so I decided to perform a phenol-chloroform cleanup to see if I could improve the NanoDrop1000 absorbance spectrum and, in turn, the quality of the gDNA.

  • Added an equal volume (500μL) of phenol:chloroform:isoamyl alcohol (25:24:1) to the DNA
  • Mixed by hand – moderate shaking
  • Centrifuged 2mins, 10,000g, RT
  • Transferred aqueous phase to clean tube and discarded interphase & organic phase
  • Added an equal volume (380μL) of chlforoform:isoamyl alcohol (24:1)
  • Mixed by hand – moderate shaking
  • Centrifuged 2mins, 10,000g, RT
  • Transferred aqueous phase (320μL) to clean tube
  • Added 0.1vols (32μL) of 3M sodium acetate (pH = 5.2)
  • Added 2vols (640μL) of 100% EtOH
  • Mixed by inversion
  • Incubated @ -20C, 1hr (probably not necessary since gDNA clearly precipitated out as soon as I mixed the sample)
  • Pelleted DNA by centrifuging 15mins, 12,000g, RT
  • Discarded supe
  • Washed pellet with 1000μL cold (-20C) 70% EtOH
  • Centrifuged 5mins, 12,000g, RT
  • Discarded supe
  • Repeated was steps three more times
  • Resuspended pellet in 100μL of Buffer EB (Qiagen)

DNA was quantified using two methods: NanoDrop1000 & QuantIT dsDNA BR Kit

For the Quant-IT kit, the samples were quantified using the QuantIT dsDNA BR Kit (Invitrogen) according to the manufacturer’s protocol.

Standards were run in triplicate, samples were run in duplicate.

96-well black (opaque) plate was used.

Fluorescence was measured on the Seeb Lab’s Victor 1420 plate reader (Perkin Elmer).

Results:


METHOD CONCENTRATION (ng/μL) VOLUME (μL) YIELD (ng)
NanoDrop1000 547.15 200 109,430
Quant-IT 74.26 200 14,851


The NanoDrop1000 overestimates the concentration of the sample by 7.4x! That’s really insane!

Regardless, this is a solid yield (using yield from Quant-IT) and, when combined with the other Ostrea lurida gDNA that I isolated today, should push the total amount of gDNA submitted to BGI over the required threshold.

Will evaluate gDNA quality on a gel.

Fluorescence (Google Sheet): 20151124_geoduck_oly_gDNA_quants


NanoDrop1000 Measurements and Plots

The clean up seems to have worked well, as the absorbance spectrum is much improved and nearly mirrors that of the Oly gDNA isolated with the Mollusc Kit.

DNA Isolation – Geoduck Adductor Muscle gDNA

Since we still don’t have sufficient gDNA for the full scope of the genome sequencing, I isolated more gDNA.

Isolated gDNA from 257mg adductor muscle tissue collected by Steven & Brent on 20150811.

Tissue was thoroughly minced with a clean razor blade and then processed with the E.Z.N.A. Mollusc Kit (Omega BioTek) with the following changes:

  • Doubled solution volumes for steps before sample was loaded on columns
  • Sample was split equally in two tubes prior to addition of 100% EtOH
  • All mixing was done by shaking – no vortexing! Done this way to, hopefully, maintain gDNA integrity
  • Elution volume = 50μL
  • Elution was repeated using the initial elution to maximize recovery while maintaining low sample volume.
  • The two preps were pooled – final volume = 79μL

DNA was quantified using two methods: NanoDrop1000 & QuantIT dsDNA BR Kit

For the Quant-IT kit, the samples were quantified using the QuantIT dsDNA BR Kit (Invitrogen) according to the manufacturer’s protocol.

Standards were run in triplicate, samples were run in duplicate.

96-well black (opaque) plate was used.

Fluorescence was measured on the Seeb Lab’s Victor 1420 plate reader (Perkin Elmer).

Results:

METHOD CONCENTRATION (ng/μL) VOLUME (μL) YIELD (ng)
NanoDrop1000 54.93 79 4,339
Quant-IT 34.52 79 2,727


The NanoDrop1000 overestimates the concentration of the sample by 1.6x!

Regardless, the yield isn’t all that great, which has generally been the case for all of the geoduck gDNA isolations I’ve performed. It would probably be prudent to try isolating gDNA from a different tissue to see if yields improve…

Will evaluate gDNA quality on a gel.

Fluorescence (Google Sheet): 20151124_geoduck_oly_gDNA_quants


NanoDrop1000 Measurements and Plots

DNA Isolation – Olympia Oyster Outer Mantle gDNA

Since we still don’t have sufficient gDNA for the full scope of the Olympia oyster genome sequencing, I isolated more gDNA.

Isolated gDNA from 118mg outer mantle tissue collected by Steven & Brent on 20150812.

Tissue was thoroughly minced with a clean razor blade and then processed with the E.Z.N.A. Mollusc Kit (Omega BioTek) with the following changes:

  • Doubled solution volumes for steps before sample was loaded on columns
  • Sample was split equally in two tubes prior to addition of 100% EtOH
  • All mixing was done by shaking – no vortexing! Done this way to, hopefully, maintain gDNA integrity
  • Elution volume = 50μL
  • Elution was repeated using the initial elution to maximize recovery while maintaining low sample volume.
  • The two preps were pooled – final volume = 79μL

DNA was quantified using two methods: NanoDrop1000 & QuantIT dsDNA BR Kit

For the Quant-IT kit, the samples were quantified using the QuantIT dsDNA BR Kit (Invitrogen) according to the manufacturer’s protocol.

Standards were run in triplicate, samples were run in duplicate.

96-well black (opaque) plate was used.

Fluorescence was measured on the Seeb Lab’s Victor 1420 plate reader (Perkin Elmer).

Results:

METHOD CONCENTRATION (ng/μL) VOLUME (μL) YIELD (ng)
NanoDrop1000 552.53 79 43,650
Quant-IT 219.07 79 17,307


The NanoDrop1000 overestimates the concentration of the sample by 2.5x!

Regardless, this is a solid yield and, when combined with the other Ostrea lurida gDNA that I cleaned up today, should push the total amount of gDNA submitted to BGI over the required threshold.

Will evaluate gDNA quality on a gel.

Fluorescence (Google Sheet): 20151124_geoduck_oly_gDNA_quants


NanoDrop1000 Measurements and Plots