IMPORTANT: The cDNA used for the qPCRs described below was a 1:5 dilution of Ronit’s cDNA made 20181017 with the following primers! Diluted cDNA was stored in his -20oC box with his original cDNA.
The following primers were used:
18s
- Cg_18s_F (SR ID: 1408)
-
Cg_18s_R (SR ID: 1409)
EF1 (elongation factor 1)
- EF1_qPCR_5′ (SR ID: 309)
-
EF1_qPCR_3′ (SR ID: 308)
HSC70 (heat shock cognate 70)
- Cg_hsc70_F (SR ID: 1396)
-
Cg_hsc70_R2 (SR ID: 1416)
HSP90 (heat shock protein 90)
- Cg_Hsp90_F (SR ID: 1532)
-
Cg_Hsp90_R (SR ID: 1533)
DNMT1 (DNA methyltransferase 1)
- Cg_DNMT1_F (SR ID: 1511)
-
Cg_DNMT1_R (SR ID: 1510)
Prx6 (peroxiredoxin 6)
- Cg_Prx6_F (SR ID: 1381)
-
Cg_Prx6_R (SR ID: 1382)
Samples were run on Roberts Lab CFX Connect (BioRad). All samples were run in duplicate. See qPCR Report (Results section) for plate layout, cycling params, etc.
qPCR master mix calcs (Google Sheet):
RESULTS
No analysis here. Will analyze data and post in different notebook entry. This entry just contains the qPCR setup, resulting data, and a glimpse of how each primer performed.
Nothing is broken down based on sample ploidy or experimental conditions.
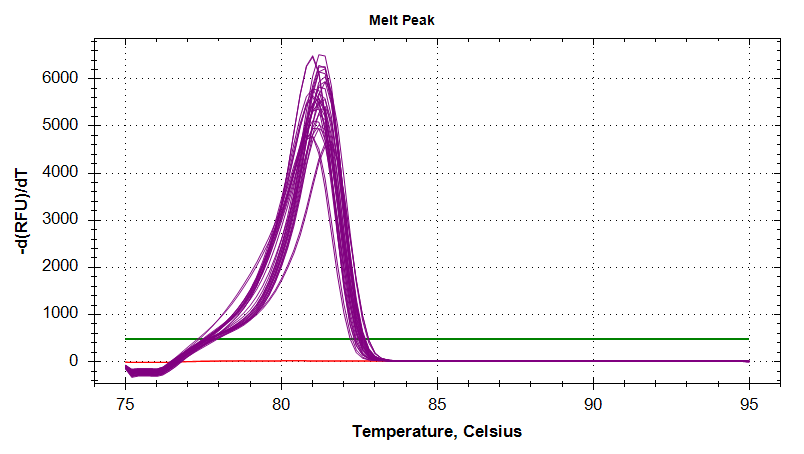
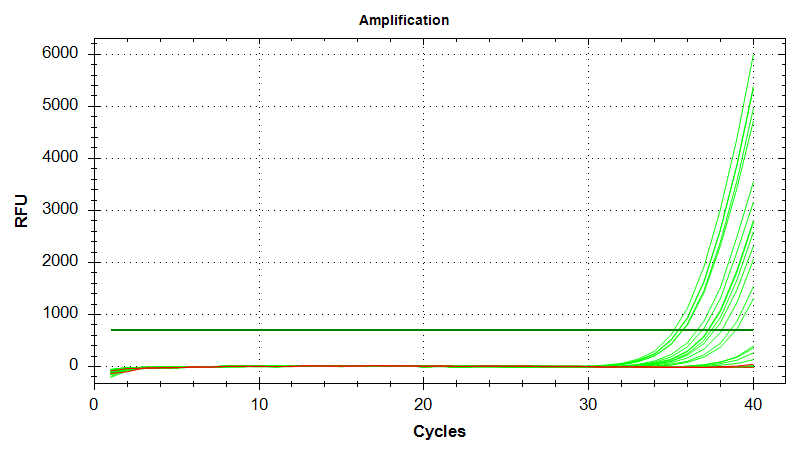
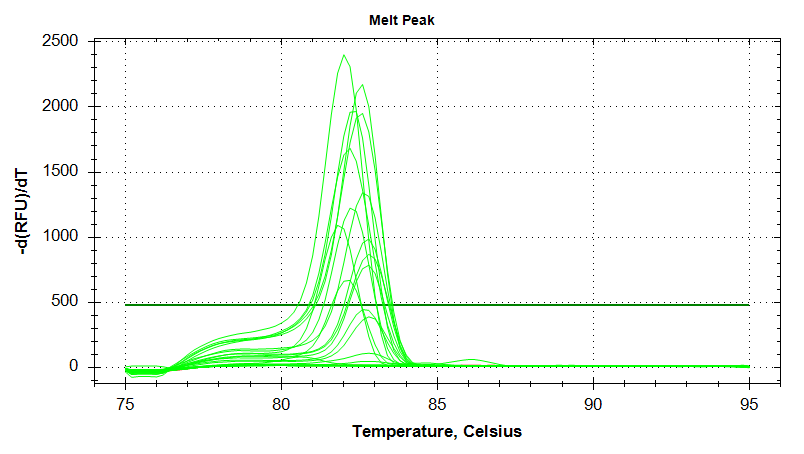
18s
qPCR Report (PDF):
qPCR File (PCRD):
qPCR Data (CSV):
Amplication Plots

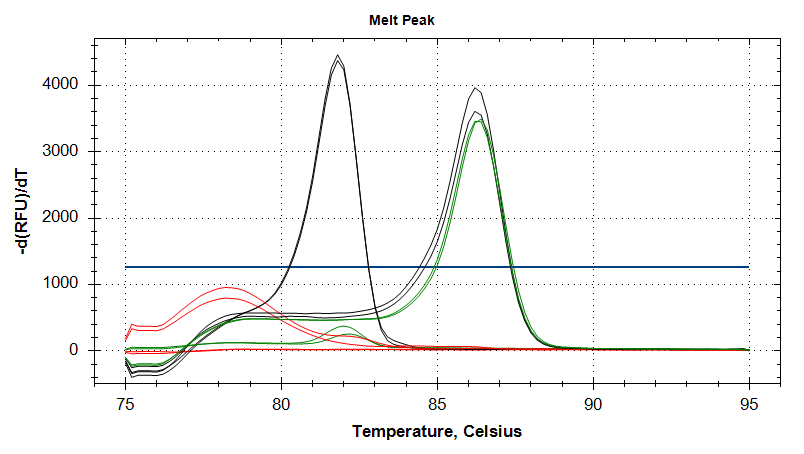
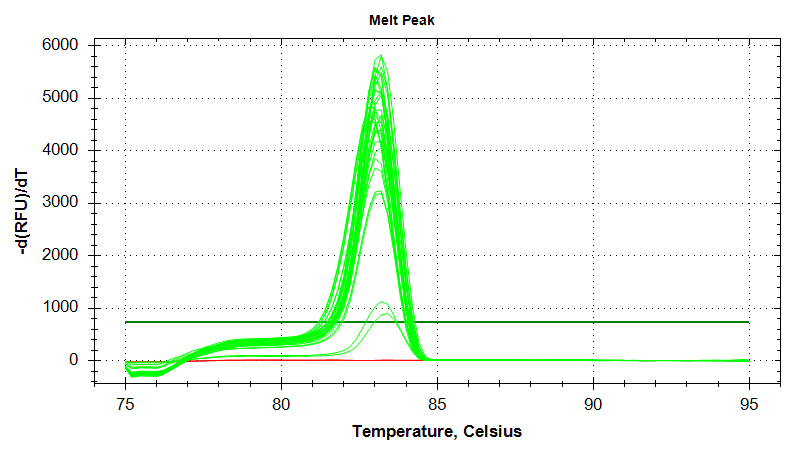
Melt Curves

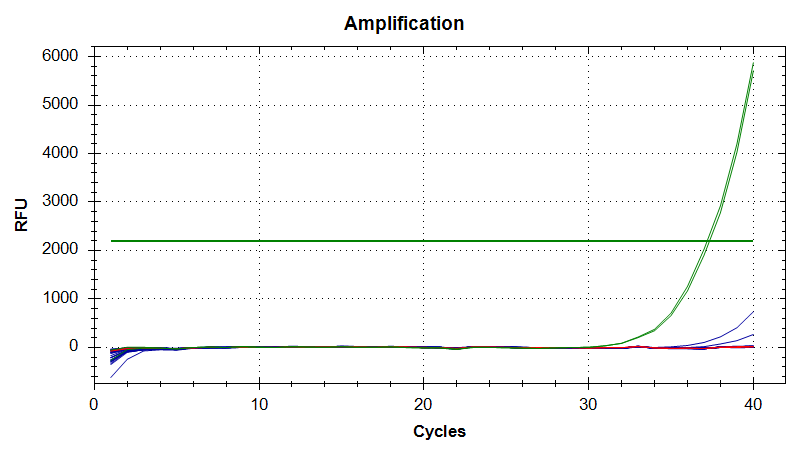
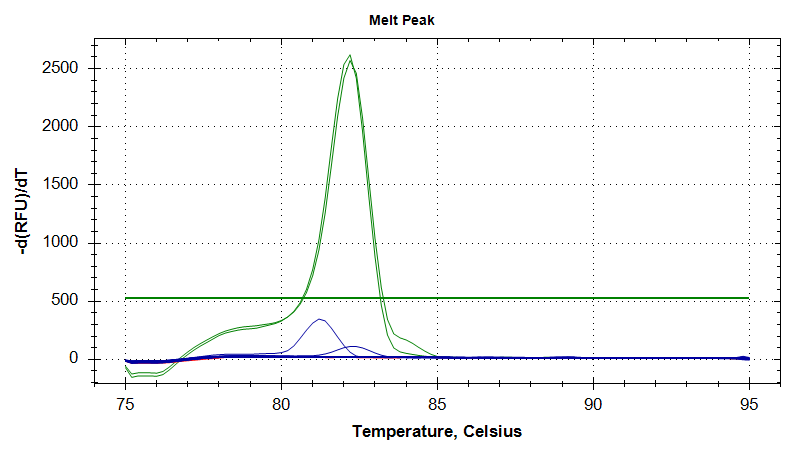
DNMT1
qPCR Report (PDF):
qPCR File (PCRD):
qPCR Data (CSV):
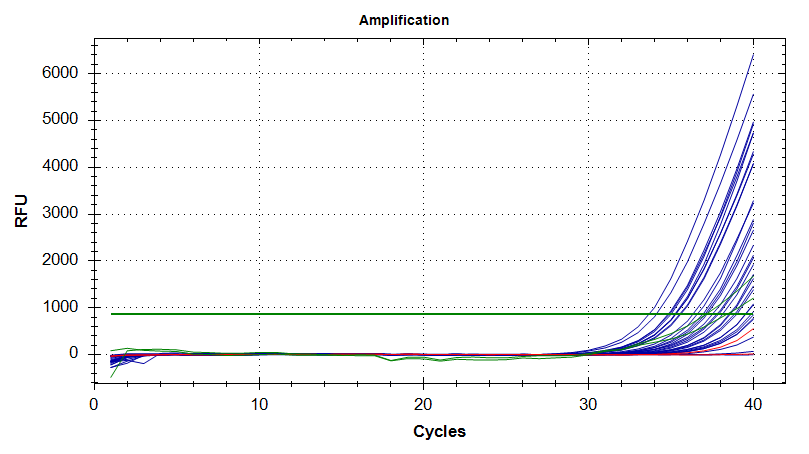
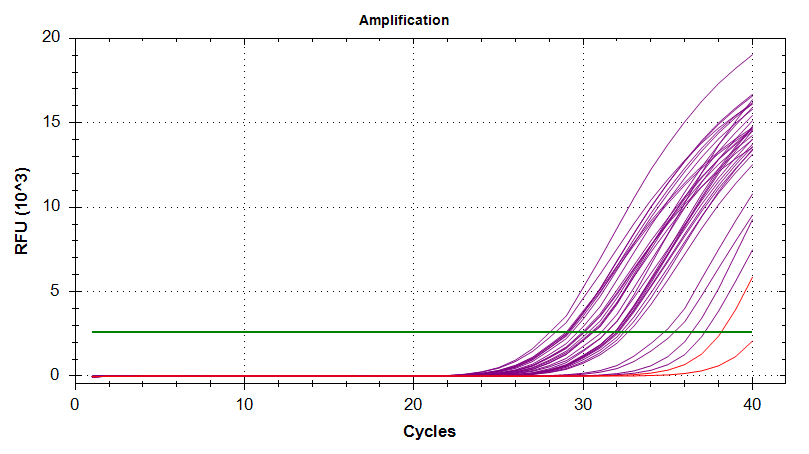
Amplication Plots
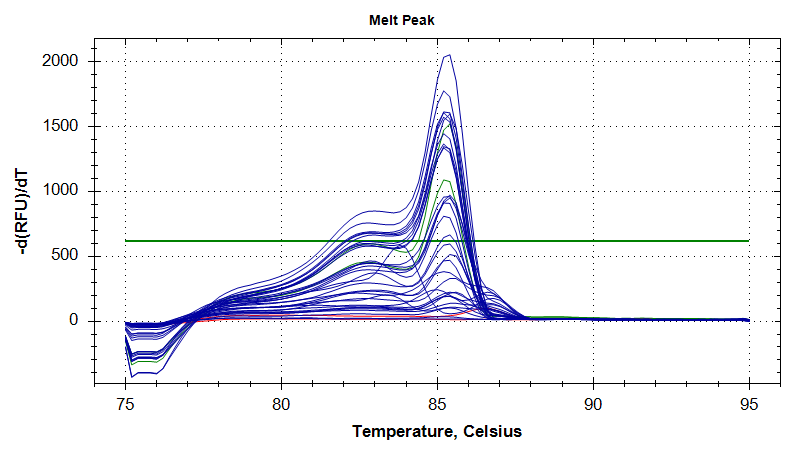
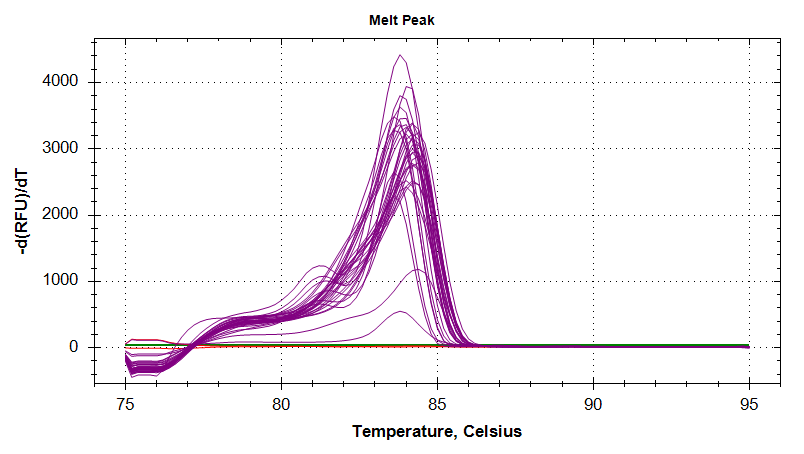
Melt Curves
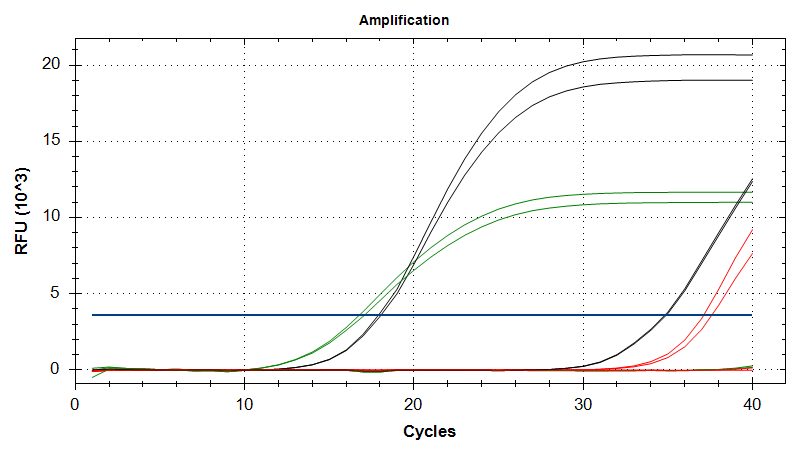
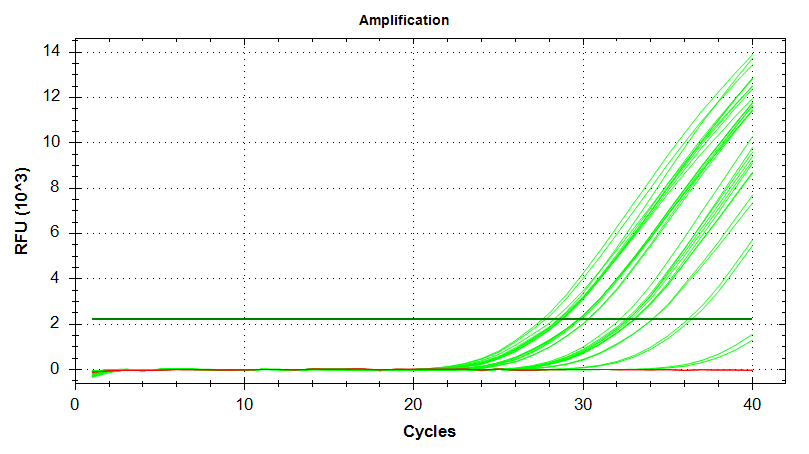
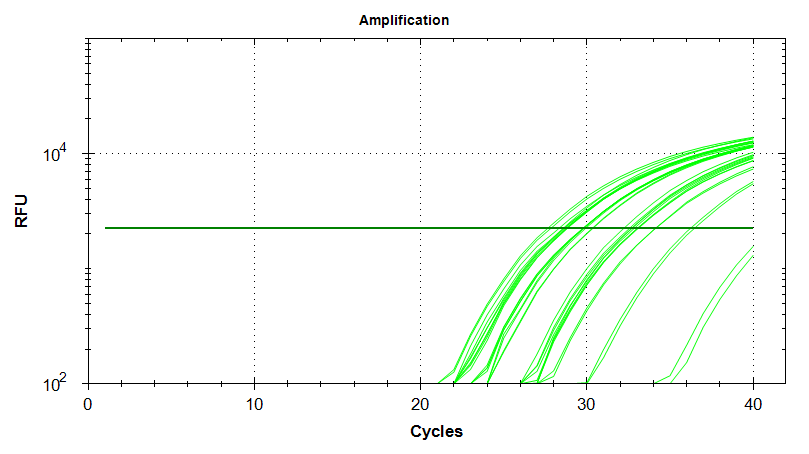
EF1
qPCR Report (PDF):
qPCR File (PCRD):
qPCR Data (CSV):
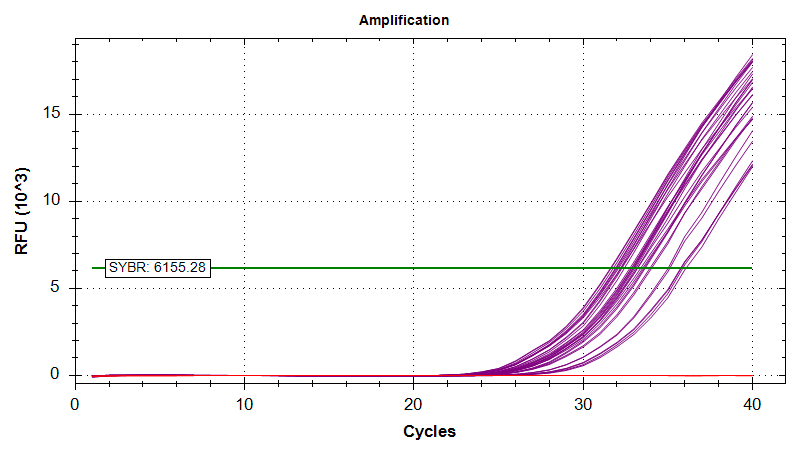
Amplication Plots – Manual Threshold (Linear)

Amplication Plots – Manual Threshold (Log)

Amplication Plots – Automatic Threshold (Linear)
Amplication Plots – Automatic Threshold (Log)
Melt Curves
HSC70
qPCR Report (PDF):
qPCR File (PCRD):
qPCR Data (CSV):
Amplication Plots
Melt Curves
HSP90
qPCR Report (PDF):
qPCR File (PCRD):
qPCR Data (CSV):
Amplication Plots
Melt Curves

Prx6
qPCR Report (PDF):
qPCR File (PCRD):
qPCR Data (CSV):
Amplication Plots

Melt Curves