Tag Archives: BB15

qPCR – C.gigas primer and gDNA tests with 18s and EF1 primers

The [qPCR I ran earlier today to check for residual gDNA in Ronit's DNased RNA] turned out terribly, due to a combination of bad primers and, possibly, bad gDNA.

I tracked down some different primers for testing:

  • Cg_18s_1644_F (SRID 1168)
  • Cg_18s_1750_R (SRID 1169)
  • EF1_qPCR_5′ (SRID 309)
  • EF1_qPCR_3′ (SRID 310)

In addition to BB15 from 20090519, I decided to test out BB16 from 20090519 as a positive control.

Samples were run on Roberts Lab CFX Connect (BioRad). All samples were run in duplicate. See qPCR Report (Results section) for plate layout, cycling params, etc.

qPCR master mix calcs (Google Sheet):


Results

qPCR Report (PDF):

qPCR File (PCRD):

qPCR Data (CSV):

Looks like the elongation factor (EF1) primers and BB16 gDNA as a positive control are the way to go.

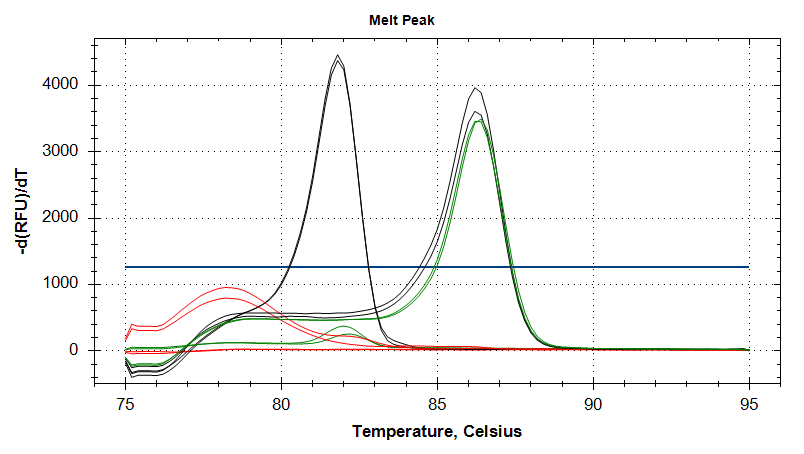
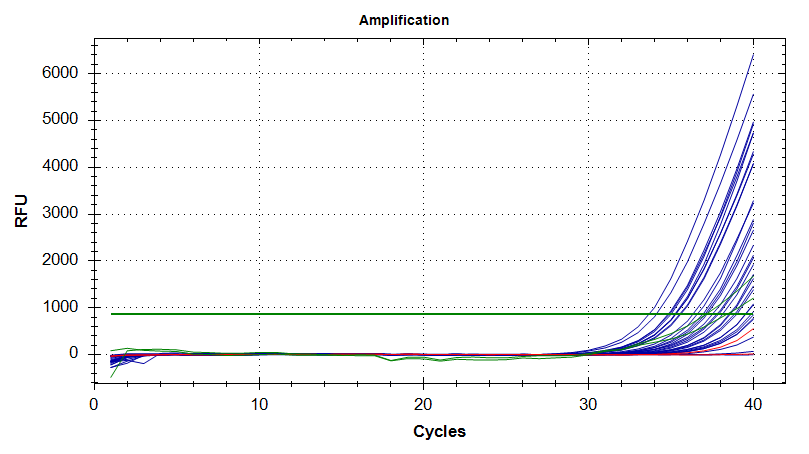
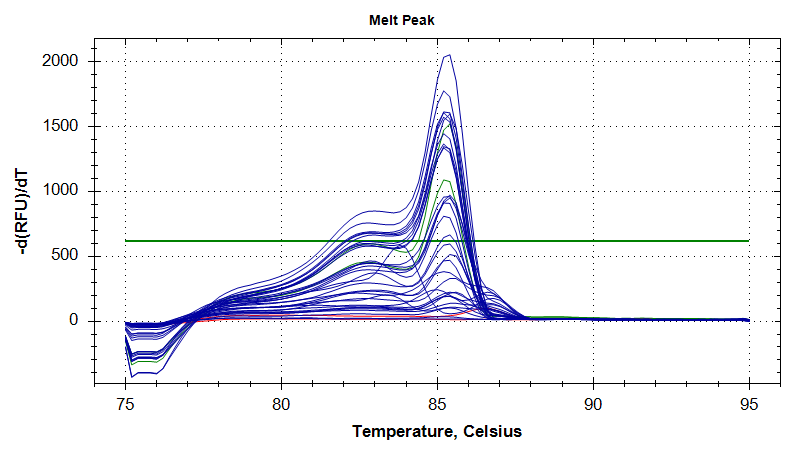
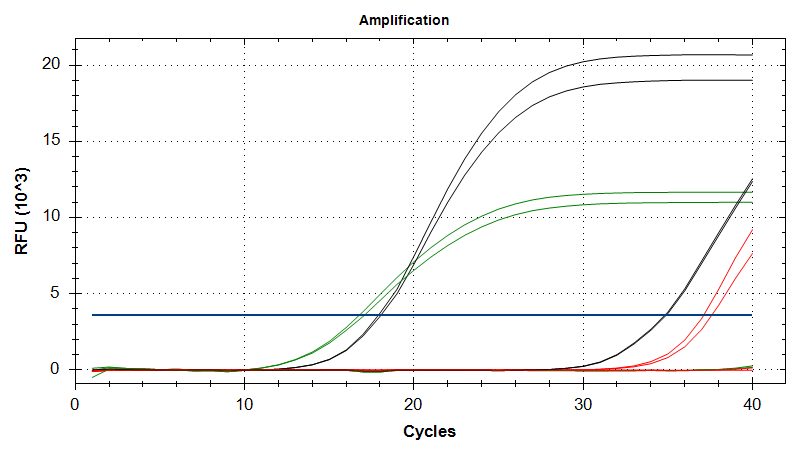
In the plots below, the black lines are BB16, the green lines are BB15, and the red lines are no template controls (NTC).

The amplification plots show that the EF1 primers do not amplify with BB15, but do amplify with BB16 (black lines Cq ~34). The 18s primers amplify with both BB15 & BB16 (Cq ~16 & ~18, respecitively), but produce primer dimers (red lines in amplification and melt curve plots).


Amplification Plots


Melt Curves

qPCR – Ronit’s DNAsed C.gigas Ploidy/Dessication RNA with 18s primers

After DNasing Ronit’s RNA earlier today, I needed to check for any residual gDNA.

Identified some old, old C.gigas 18s primers that should amplify gDNA:

  • gigas18s_fw (SRID 157)
  • gigas18s_rv (SRID 156)

Used some old C.gigas gDNA (BB15 from 20090519) as a positive control.

Samples were run on Roberts Lab CFX Connect (BioRad). All samples were run in duplicate. See qPCR Report (Results section) for plate layout, cycling params, etc.

qPCR master mix calcs (Google Sheet):


Results

qPCR Report (PDF):

qPCR File (PCRD):

qPCR Data (CSV):

Well, this primer set and/or the gDNA is not good. In the plots below, the positive control gNDA is in green, samples in blue, and no template controls (NTC) are in red.

Poor performance is most easily noticed when looking at the melt curves. They have multiple peaks, suggesting non-specific amplification, even in the positive control.

Additionally, although less evident from just looking at the plots, is the replicates are highly inconsistent. Although it’s possible that might be due to poor technique, it’s very unlikely.

Will have to identify different primers and/or positive control DNA.


Amplification Plots


Melt Curves