Tag Archives: Ostrea lurida

SRA Submission – Olymia oyster Whole Genome BS-seq Data

Submitted our whole genome bisulfite sequencing data to NCBI Sequence Read Archive (SRA).

Relevant SRA info is below.

Have updated nightingales Google Sheet with SRA info.

SAMPLE SRA (Study) BioProject BioSample
1NF11 SRP163248 PRJNA494552 SAMN10172233
1NF15 SRP163248 PRJNA494552 SAMN10172234
1NF16 SRP163248 PRJNA494552 SAMN10172235
1NF17 SRP163248 PRJNA494552 SAMN10172236
2NF5 SRP163248 PRJNA494552 SAMN10172237
2NF6 SRP163248 PRJNA494552 SAMN10172238
2NF7 SRP163248 PRJNA494552 SAMN10172239
2NF8 SRP163248 PRJNA494552 SAMN10172240

Transcriptome Alignment & Bedgraph – Olympia oyster transcriptome with Olurida_v080 genome assembly

Yesterday, I produced a bedgraph file of our Olympia oyster RNAseq data coverage using our Olurida_v081 genome.

I decided that I wanted to use the Olurida_v080 version instead (or, in addtion to?), as the Olurida_v080 version has not been size restricted (the Olurida v081 version is only contigs >1000bp). I feel like we could miss some important regions, so wanted to run this analysis using all of the genome data we currently have available. Additionally, this will be consistent with my previous Bismark (DNA methylation analysis).

Used HISAT2 on our HPC Mox node to align our RNAseq reads to our Olurida_v080 genome assembly:

SBATCH script file:

NOTE: For brevity sake, I have not listed all of the input RNAseq files below. Please see the full script, which is linked above.


#!/bin/bash
## Job Name
#SBATCH --job-name=20180926_oly_hisat2
## Allocation Definition 
#SBATCH --account=srlab
#SBATCH --partition=srlab
## Resources
## Nodes
#SBATCH --nodes=1
## Walltime (days-hours:minutes:seconds format)
#SBATCH --time=5-00:00:00
## Memory per node
#SBATCH --mem=500G
##turn on e-mail notification
#SBATCH --mail-type=ALL
#SBATCH --mail-user=samwhite@uw.edu
## Specify the working directory for this job
#SBATCH --workdir=/gscratch/scrubbed/samwhite/20180926_oly_RNAseq_genome_hisat2_bedgraph

# Load Python Mox module for Python module availability

module load intel-python3_2017

# Document programs in PATH (primarily for program version ID)

date >> system_path.log
echo "" >> system_path.log
echo "System PATH for $SLURM_JOB_ID" >> system_path.log
echo "" >> system_path.log
printf "%0.s-" {1..10} >> system_path.log
echo ${PATH} | tr : \\n >> system_path.log


# Set genome assembly path
oly_genome_path=/gscratch/srlab/sam/data/O_lurida/oly_genome_assemblies

# Set sorted transcriptome assembly bam file
oly_transcriptome_bam=20180926_Olurida_v080.sorted.bam

# Set hisat2 basename
hisat2_basename=Olurida_v080

# Set program paths
## hisat2
hisat2=/gscratch/srlab/programs/hisat2-2.1.0

## bedtools
bedtools=/gscratch/srlab/programs/bedtools-2.27.1/bin

## samtools
stools=/gscratch/srlab/programs/samtools-1.9/samtools

# Build hisat2 genome index
${hisat2}/hisat2-build \
-f ${oly_genome_path}/Olurida_v080.fa \
Olurida_v080 \
-p 28

# Align reads to oly genome assembly
${hisat2}/hisat2 \
--threads 28 \
-x "${hisat2_basename}" \
-q \
-1 \
-2 \
-S 20180926_"${hisat2_basename}".sam

# Convert SAM file to BAM
"${stools}" view \
--threads 28 \
-b 20180926_"${hisat2_basename}".sam > 20180926_"${hisat2_basename}".bam

# Sort BAM
"${stools}" sort \
--threads 28 \
20180926_"${hisat2_basename}".bam \
-o 20180926_"${hisat2_basename}".sorted.bam

# Index for use in IGV
##-@ specifies thread count; --thread option not available in samtools index
"${stools}" index \
-@ 28 \
20180926_"${hisat2_basename}".sorted.bam


# Create bedgraph
## Reports depth at each position (-bg in bedgraph format) and report regions with zero coverage (-a).
## Screens for portions of reads coming from exons (-split).
## Add genome browser track line to header of bedgraph file.
${bedtools}/genomeCoverageBed \
-ibam ${oly_transcriptome_bam} \
-bga \
-split \
-trackline \
> 20180926_oly_RNAseq.bedgraph

The script performs the following functions:

  • Genome indexing
  • RNAseq alignment to genome
  • Convert SAM to BAM
  • Sort and index BAM
  • Determine RNAseq coverage

RESULTS

Output folder:

Bedgraph file (1.9GB):

Loaded in to IGV to verify things looked OK:

Bedgraph – Olympia oyster transcriptome with Olurida_v081 genome assembly

I took the sorted BAM file from yesterday’s corrected RNAseq genome alignment and converted it to a bedgraph using BEDTools genomeCoverageBed tool.

Analysis took place on our HPC Mox node.

SBATCH script file:


#!/bin/bash
## Job Name
#SBATCH --job-name=20180926_oly_bedgraphs
## Allocation Definition 
#SBATCH --account=srlab
#SBATCH --partition=srlab
## Resources
## Nodes
#SBATCH --nodes=1
## Walltime (days-hours:minutes:seconds format)
#SBATCH --time=5-00:00:00
## Memory per node
#SBATCH --mem=500G
##turn on e-mail notification
#SBATCH --mail-type=ALL
#SBATCH --mail-user=samwhite@uw.edu
## Specify the working directory for this job
#SBATCH --workdir=/gscratch/scrubbed/samwhite/20180926_oly_RNAseq_bedgraphs

# Load Python Mox module for Python module availability

module load intel-python3_2017

# Document programs in PATH (primarily for program version ID)

date >> system_path.log
echo "" >> system_path.log
echo "System PATH for $SLURM_JOB_ID" >> system_path.log
echo "" >> system_path.log
printf "%0.s-" {1..10} >> system_path.log
echo ${PATH} | tr : \\n >> system_path.log

# Set sorted transcriptome assembly bam file
oly_transcriptome_bam=/gscratch/scrubbed/samwhite/20180925_oly_RNAseq_genome_hisat2/20180925_Olurida_v081.sorted.bam


# Set program paths
bedtools=/gscratch/srlab/programs/bedtools-2.27.1/bin
samtools=/gscratch/srlab/programs/samtools-1.9/samtools


# Create bedgraph
## Reports depth at each position (-bg in bedgraph format) and report regions with zero coverage (-a).
## Screens for portions of reads coming from exons (-split).
## Add genome browser track line to header of bedgraph file.
${bedtools}/genomeCoverageBed \
-ibam ${oly_transcriptome_bam} \
-bga \
-split \
-trackline \
> 20180926_oly_RNAseq.bedgraph

RESULTS

Output folder:

Bedgraph file (1.2GB):

Loaded in to IGV to verify things looked OK:

Transcriptome Alignment – Olympia oyster RNAseq reads aligned to genome with HISAT2

Yesterday’s attempt at producing a bedgraph was a failure and a prodcuct of a major brain fart. The worst part is that I was questioning what I was doing the entire time, but still went through with the process! Yeesh!

The problem was that I tried to take our Trinity-assembled transcriptome and somehow align that to our genome. This can’t work because each of those assemblies don’t know the coordinates used by the other. So, as was the case, you end up with a bedgraph that shows zero coverage for all genome contigs.

Anyway, here’s the correct procedure!

Used HISAT2 on our HPC Mox node to align our RNAseq reads to our Olurida_v081 genome assembly:

SBATCH script files:

PERFORM GENOME INDEXING & ALIGNMENT
20180925_oly_RNAseq_genome_hisat2.sh

SORT & INDEX ALIGNMENT OUTPUT
20180925_oly_RNAseq_genome_sort_bam.sh


RESULTS

Output folder:

Sorted BAM file (58GB):

Will get the sorted BAM file converted to a bedgraph showing genome coverage for use in IGV.

Bedgraph – Olympia oyster transcriptome (FAIL)

Progress on generating bedgraphs from our Olympia oyster transcriptome continues.

Transcriptome assembly with Trinity completed 20180919.

Then, aligned the assembled transcriptome to our genome using Bowtie2.

Finally, I used BEDTools to convert the BAM to BED to bedgraph.

This required an initial indexing of our Olympia oyster genome FastA using samtools faidx tool.

SBATCH script file:


#!/bin/bash
## Job Name
#SBATCH --job-name=20180924_oly_bedgraphs
## Allocation Definition 
#SBATCH --account=srlab
#SBATCH --partition=srlab
## Resources
## Nodes
#SBATCH --nodes=1
## Walltime (days-hours:minutes:seconds format)
#SBATCH --time=5-00:00:00
## Memory per node
#SBATCH --mem=500G
##turn on e-mail notification
#SBATCH --mail-type=ALL
#SBATCH --mail-user=samwhite@uw.edu
## Specify the working directory for this job
#SBATCH --workdir=/gscratch/scrubbed/samwhite/20180924_oly_RNAseq_bedgraphs

# Load Python Mox module for Python module availability

module load intel-python3_2017

# Document programs in PATH (primarily for program version ID)

date >> system_path.log
echo "" >> system_path.log
echo "System PATH for $SLURM_JOB_ID" >> system_path.log
echo "" >> system_path.log
printf "%0.s-" {1..10} >> system_path.log
echo ${PATH} | tr : \\n >> system_path.log


# Set genome assembly FastA
oly_genome_fasta=/gscratch/srlab/sam/data/O_lurida/oly_genome_assemblies/Olurida_v081.fa

# Set indexed genome assembly file
oly_genome_indexed=/gscratch/srlab/sam/data/O_lurida/oly_genome_assemblies/Olurida_v081.fa.fai

# Set sorted transcriptome assembly bam file
oly_transcriptome=/gscratch/scrubbed/samwhite/20180919_oly_transcriptome_bowtie2/20180919_Olurida_v081.sorted.bam


# Set program paths
bedtools=/gscratch/srlab/programs/bedtools-2.27.1/bin
samtools=/gscratch/srlab/programs/samtools-1.9/samtools

# Index genome FastA
${samtools} faidx ${oly_genome_fasta}

# Format indexed genome for bedtools
## Requires only two columns: namelength
awk -v OFS='\t' {'print $1,$2'} ${oly_genome_indexed} > Olurida_v081.fa.fai.genome

# Create bed file
${bedtools}/bamToBed \
-i ${oly_transcriptome} \
> 20180924_oly_RNAseq.bam.bed


# Create bedgraph
## Reports depth at each position (-bg in bedgraph format) and report regions with zero coverage (-a).
## Screens for portions of reads coming from exons (-split).
## Add genome browser track line to header of bedgraph file.
${bedtools}/genomeCoverageBed \
-i ${PWD}/20180924_oly_RNAseq.bed \
-g Olurida_v081.fa.fai.genome \
-bga \
-split \
-trackline \
> 20180924_oly_RNAseq.bed

Alignment was done using the following version of the Olympia oyster genome assembly:


RESULTS:

Output folder:

Indexed and formatted genome file:

Bedgraph file (for IGV):


This doesn’t appear to have worked properly. Here’s a view of the bedgraph file:


track type=bedGraph
Contig0 0   116746  0
Contig1 0   87411   0
Contig2 0   139250  0
Contig3 0   141657  0
Contig4 0   95692   0
Contig5 0   130522  0
Contig6 0   94893   0
Contig7 0   109667  0
Contig8 0   95943   0

I’d expect multiple entries for each contig (ideally), indicating start/stop positions for where transcripts align within a given contig. However, this appears to simply be a list of all the genome contigs and their lengths (Start=0, Stop=n).

I would expect to see something li

I’ll look into this further and see where this pipeline goes wrong.

Transcriptome Alignment – Olympia oyster Trinity transcriptome aligned to genome with Bowtie2

Progress on generating bedgraphs from our Olympia oyster transcriptome continues.

Transcriptome assembly with Trinity completed 20180919.

Next up, align transcriptome to Olympia oyster genome.

Alignment and creation of BAM files was done using Bowtie2 on our HPC Mox node.

SBATCH script file:

Alignment was done using the following version of the Olympia oyster genome assembly:


RESULTS:

Output folder:

Sorted BAM file:

Sorted & indexed BAM file (for IGV):

Will get the sorted BAM file converted to a bedgraph for use in IGV.

Transcriptome Assembly – Olympia oyster RNAseq Data with Trinity

Used all of our current oly RNAseq data to assemble a transcriptome using Trinity.

Trinity was run our our Mox HPC node.

Reads were trimmed using the built-in version of Trimmomatic with the default settings.

SBATCH script:

Despite the naming conventions, this job was submitted to the Mox scheduler on 201800912 and finished on 20180913.

After job completion, the entire folder was gzipped, using an interactive node (the following method of gzipping is SUPER fast, btw):

tar -c 20180827_trinity_oly_RNAseq | pigz > 20180827_trinity_oly_RNAseq.tar.gz

RESULTS:

Output folder:

Trinity assembly (FastA):

Next up, I’ll follow up on this GitHub issue and get some bedgraphs generated.

DNA Methylation Analysis – Olympia Oyster Whole Genome BSseq Bismark Pipeline MethylKit Comparison

I previously ran two variations on the Bismark analysis for our Olympia oyster whole genome bisulfite sequencing data:

I followed this up using the MethylKit R package to identify differentially modified loci (DML), based on differing amounts of coverage (1x, 3x, 5x, & 10x) and percent methylation differences between the two groups of oysters (25%, 50%, & 75%).

See the project wiki for experimental design info).

Both sets of analyses were documented in R Projects:

Default Bismark settings:
“Relaxed” Bismark settings

RESULTS

BedGraphs (1x coverage, 25% diff in methylation):

Default Bismark settings:
“Relaxed” Bismark settings:

The BedGraph outputs from the least stringent coverage/percent difference in methylation for both Bismark pipelines yield suprisingly low numbers of DML.

They yield 22 and 21 DML, respectively. Of course, more stringent BedGraphs have fewer DML, but may be more believable due to having a more robust set of data.

Interestingly, the two analyses reveal that a single contig contains the majority of DML, all within a 1000bp range.

Will continue to examine this data by examining Bismark BedGraphs in IGV, and running some additional MethylKit analysis looking at differentially modified regions(DMRs) to see what we can gleen from this.

DNA Methylation Analysis – Olympia Oyster Whole Genome BSseq Bismark Pipeline Comparison

Ran Bismark using our high performance computing (HPC) node, Mox, with two different bowtie2 settings:

  1. Default settings

  2. –score_min L,0,-0.6

The second setting is a bit less stringent than the default settings and should result in a higher percentage of reads mapping. However, not entirely sure what the actual implications will be (if any) for interpreting the resulting data.

Input data was previously trimmed per Bismark’s recommendation for Illumina TruSeq libraries (TrimGalore! 5′ 10bp):

List of input files and Bismark configurations can be seen in the SLURM scripts:


RESULTS

Output folders:

DNA Methylation Analysis – Olympia oyster BSseq MethylKit Analysis

NOTE: IMPORTANT CAVEATS – READ POST BEFORE USING DATA.
I’m posting this for posterity and to provide an overview of what (and whatnot) to do. Plus, this has a good R script for using MethylKit that can be used for subsequent analyses.

The goal of this analysis was to compare the methylation profiles of Olympia oysters originating from a common population (Fidalgo Bay) that were raised in two different locations (Fidalgo Bay & Oyster Bay).

An overview of the experiment can be viewed here:

I previously ran all of Olympia oyster DNA methylation sequencing data through the Bismark pipeline, and then processed them using the MethylKit R library.

First mistake (Bismark):

  • Trimmed FastQ files “incorrectly”.

Bismark provides an excellent user guide and provides a handy table on how to decide on trimming parameters, but I mistakenly trimmed these according to the recommendations for a different library preparation technique. I trimmed based on the Zymo Pico-Methyl Kit (which was used for the other group of data that I processed simultaneously), instead of the TruSeq library prep.

So, “incorrectly” isn’t necessarily the proper term here. The analysis can still be used, however, it’s likely that the excessive trimming results in reducing sequencing coverage, and, in turn, making the downstream analysis result in a highly conservative output. Thus, the data isn’t wrong or bad, it is just very limited.

And, this leads to the second mistake (Bismark):

  • Bowtie alignment score too strict

There’s a bit of a weird “battle” between Bismark and bowtie2. Bismark uses bowtie2 for generating alignments, but bowtie2’s default cutoff score overrides Bismark’s. So, to adjust the score value, you have to explicitly add the scoring parameters to your Bismark parameters during the alignment step. I did not do this.

Again, it’s not wrong, per se, but leads to a significantly limited set of data in the final analysis.

The data were analyzed based on a minimum of:

  • 3x coverage

  • 25% difference in methylation


RESULTS:

Methylkit analysis (R project; GitHub):

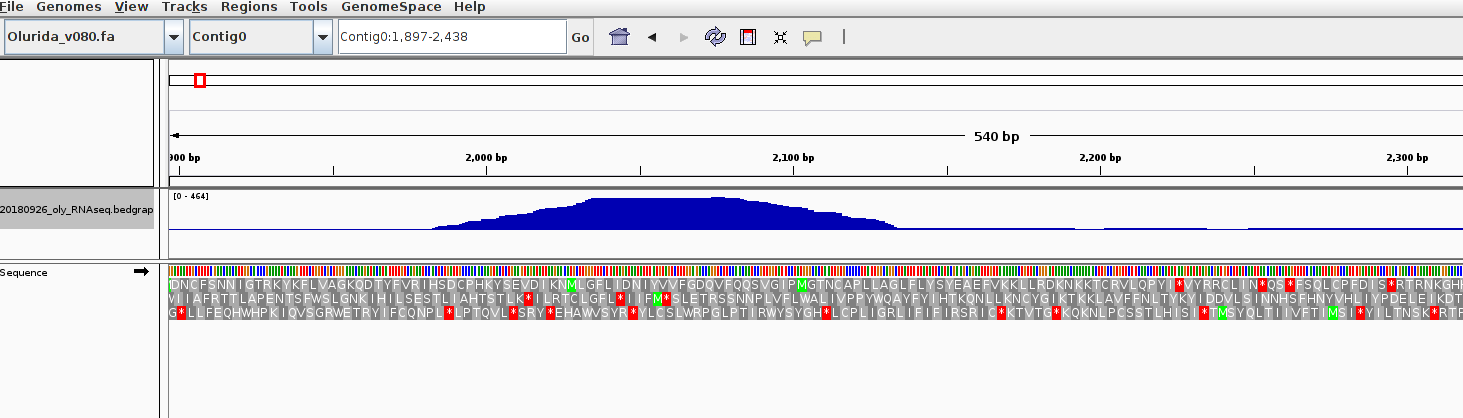
BedGraph file (BED):

The analysis resulted in a total of seven (yes, 7) differentially methylated loci (DML) between the two groups. It was this result that made Steven and me revisit the initial Bismark analysis. He has done this previously (but differently) and gotten significantly greater numbers of DML.

Knowing all of this, I will re-trim the data and adjust Bismark alignment score thresholds and then re-analyze with MethylKit.

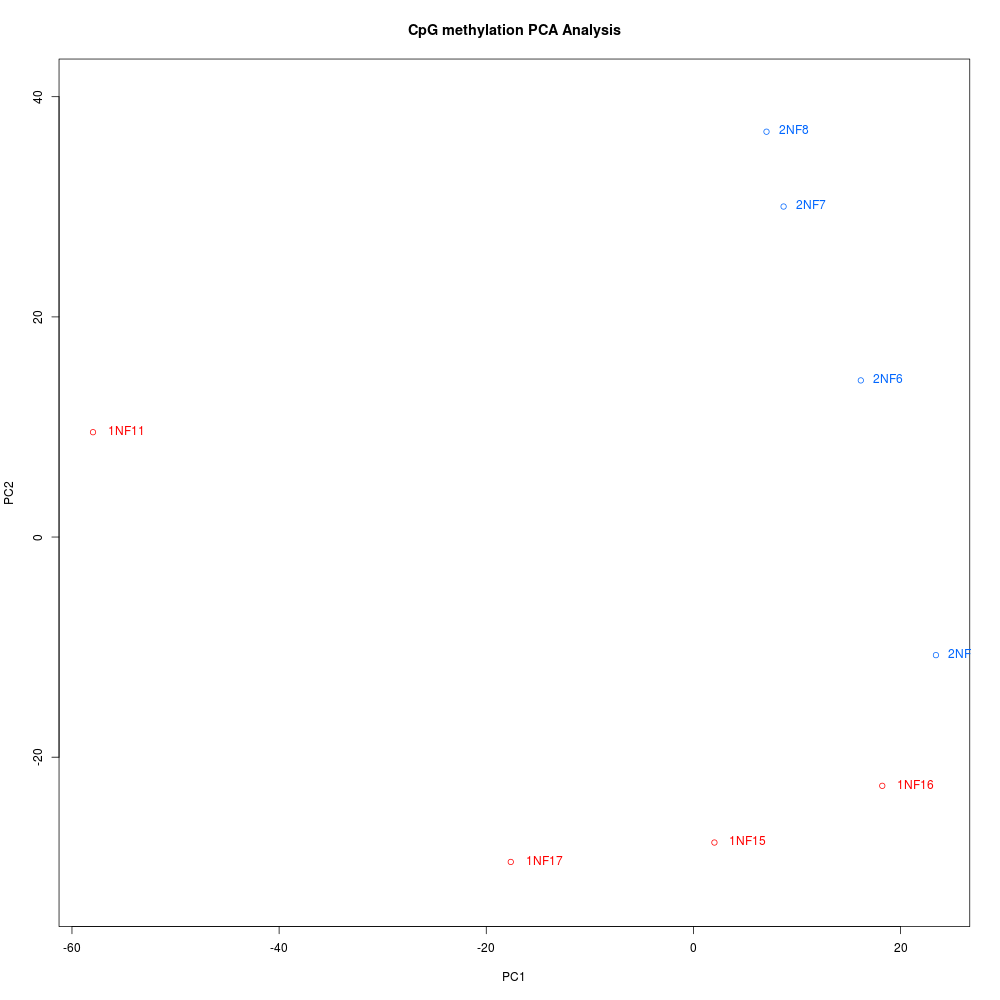
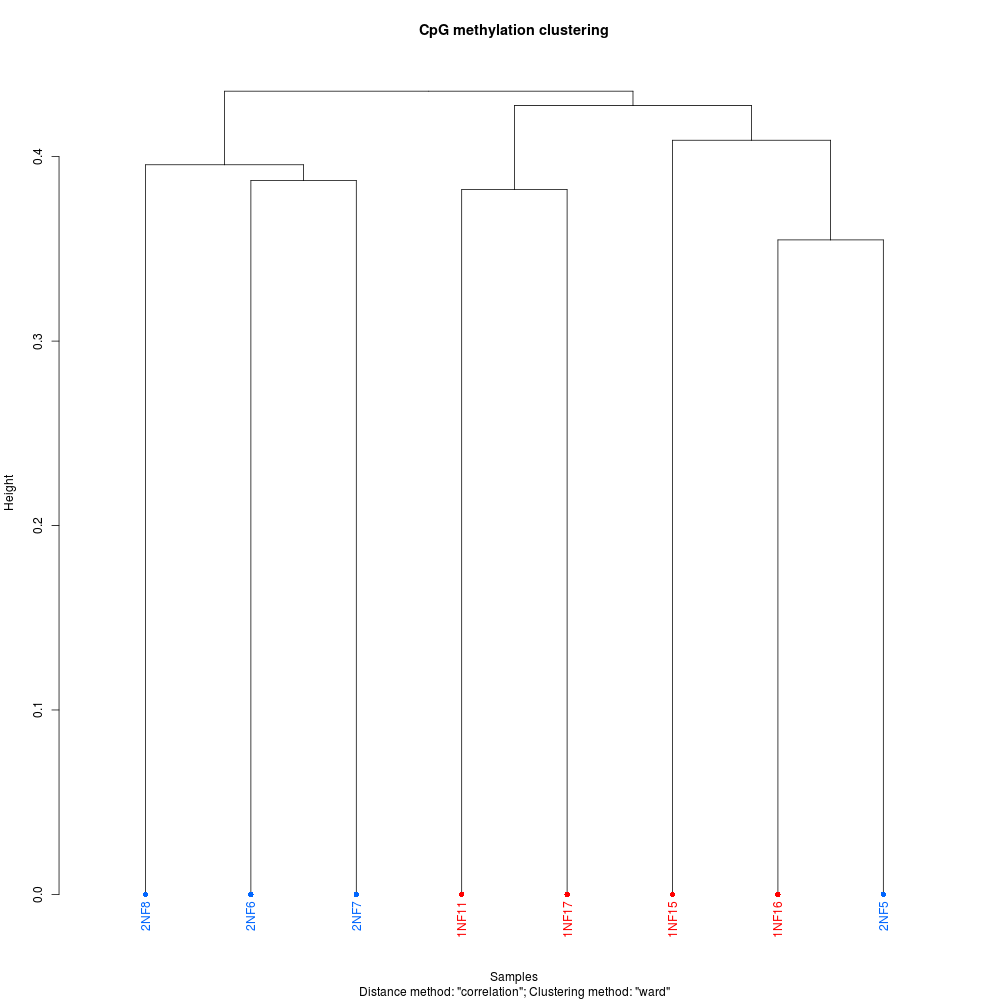
Regardless here’re some plots to add some visual flair to this notebook entry (these, and more, are available in the GitHub repo):

CLUSTERING DENDROGRAM


PCA PLOT