NOTE: IMPORTANT CAVEATS – READ POST BEFORE USING DATA.
I’m posting this for posterity and to provide an overview of what (and whatnot) to do. Plus, this has a good R script for using MethylKit that can be used for subsequent analyses.
The goal of this analysis was to compare the methylation profiles of Olympia oysters originating from a common population (Fidalgo Bay) that were raised in two different locations (Fidalgo Bay & Oyster Bay).
An overview of the experiment can be viewed here:
I previously ran all of Olympia oyster DNA methylation sequencing data through the Bismark pipeline, and then processed them using the MethylKit R library.
First mistake (Bismark):
- Trimmed FastQ files “incorrectly”.
Bismark provides an excellent user guide and provides a handy table on how to decide on trimming parameters, but I mistakenly trimmed these according to the recommendations for a different library preparation technique. I trimmed based on the Zymo Pico-Methyl Kit (which was used for the other group of data that I processed simultaneously), instead of the TruSeq library prep.
So, “incorrectly” isn’t necessarily the proper term here. The analysis can still be used, however, it’s likely that the excessive trimming results in reducing sequencing coverage, and, in turn, making the downstream analysis result in a highly conservative output. Thus, the data isn’t wrong or bad, it is just very limited.
And, this leads to the second mistake (Bismark):
- Bowtie alignment score too strict
There’s a bit of a weird “battle” between Bismark and bowtie2. Bismark uses bowtie2 for generating alignments, but bowtie2’s default cutoff score overrides Bismark’s. So, to adjust the score value, you have to explicitly add the scoring parameters to your Bismark parameters during the alignment step. I did not do this.
Again, it’s not wrong, per se, but leads to a significantly limited set of data in the final analysis.
The data were analyzed based on a minimum of:
- 3x coverage
-
25% difference in methylation
RESULTS:
Methylkit analysis (R project; GitHub):
BedGraph file (BED):
The analysis resulted in a total of seven (yes, 7) differentially methylated loci (DML) between the two groups. It was this result that made Steven and me revisit the initial Bismark analysis. He has done this previously (but differently) and gotten significantly greater numbers of DML.
Knowing all of this, I will re-trim the data and adjust Bismark alignment score thresholds and then re-analyze with MethylKit.
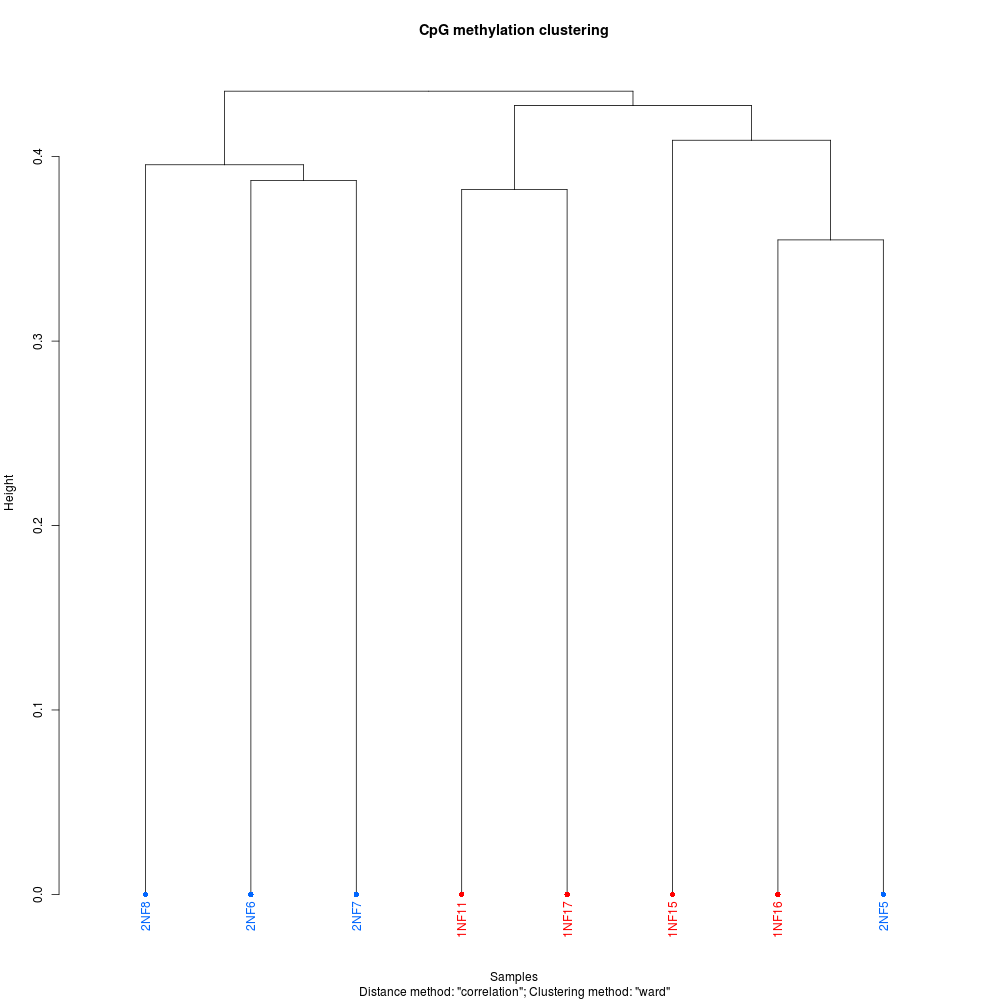
Regardless here’re some plots to add some visual flair to this notebook entry (these, and more, are available in the GitHub repo):
CLUSTERING DENDROGRAM

PCA PLOT
