Tag Archives: DNased RNA

Reverse Transcription – Ronit’s C.gigas DNased ctenidia RNA

Proceeded with reverse transcription of Ronit’s DNased ctenidia RNA (from 20181016).

Reverse transcription was performed using 100ng of each sample with M-MMLV Reverse Transcriptase from Promega.

Briefly, 100ng of DNased RNA was combined with oligo dT primers and brought up to a final volume of 15uL. Tubes were incubated for 5mins at 70oC in a PTC-200 thermal cycler (MJ Research), using a heated lid. Samples were immediately placed on ice.

A master mix of buffer, dNTPs, water, and M-MMLV reverse transcriptase was made, 10uL of the master mix was added to each sample, and mixed via finger flicking. Samples were incubated for 1hr at 42oC in a PTC-200 thermal cycler (MJ Research), using a heated lid, followed by a 5min incubation at 65oC.

Samples were stored on ice for use later this afternoon by Ronit.

Samples will be stored in Ronit’s -20oC box.

Reverse transcription calcs (Google Sheet):

qPCR – Ronit’s DNAsed C.gigas Ploidy/Dessication RNA with elongation factor primers

After I figured out the appropriate DNA and primers to use to detect gDNA in Crassostrea gigas samples, I checked Ronit’s DNased ctenidia RNA (from 20181016) for residual gDNA.

Elongation factor primers:

  • EF1_qPCR_5′ (SRID 309)
  • EF1_qPCR_3′ (SRID 310)

BB16 from 20090519 was used as a positive control.

Samples were run on Roberts Lab CFX Connect (BioRad). All samples were run in duplicate. See qPCR Report (Results section) for plate layout, cycling params, etc.

qPCR master mix calcs (Google Sheet):


Results

qPCR Report (PDF):

qPCR File (PCRD):

qPCR Data (CSV):

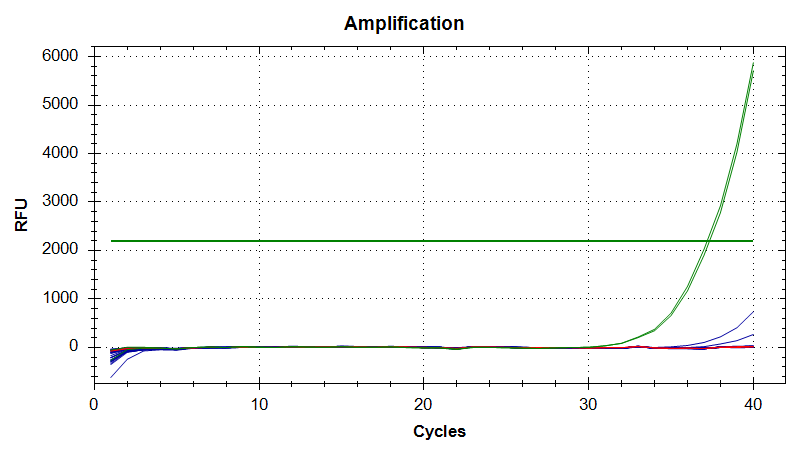
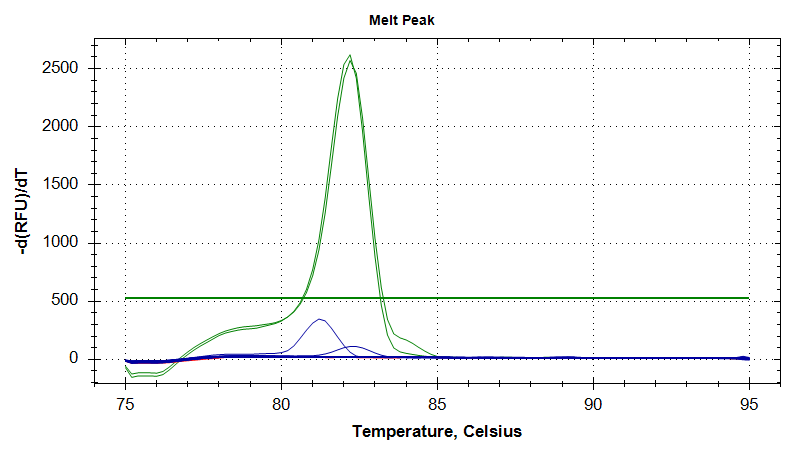
In the plots below, green is the positive control, blue are the samples, and red is the no template control (NTC).

Everything looks great! Nice, clean, gDNA-free RNA! Will proceed with reverse transcription.


Amplification Plots


Melt Curves

qPCR – Ronit’s DNAsed C.gigas Ploidy/Dessication RNA with 18s primers

After DNasing Ronit’s RNA earlier today, I needed to check for any residual gDNA.

Identified some old, old C.gigas 18s primers that should amplify gDNA:

  • gigas18s_fw (SRID 157)
  • gigas18s_rv (SRID 156)

Used some old C.gigas gDNA (BB15 from 20090519) as a positive control.

Samples were run on Roberts Lab CFX Connect (BioRad). All samples were run in duplicate. See qPCR Report (Results section) for plate layout, cycling params, etc.

qPCR master mix calcs (Google Sheet):


Results

qPCR Report (PDF):

qPCR File (PCRD):

qPCR Data (CSV):

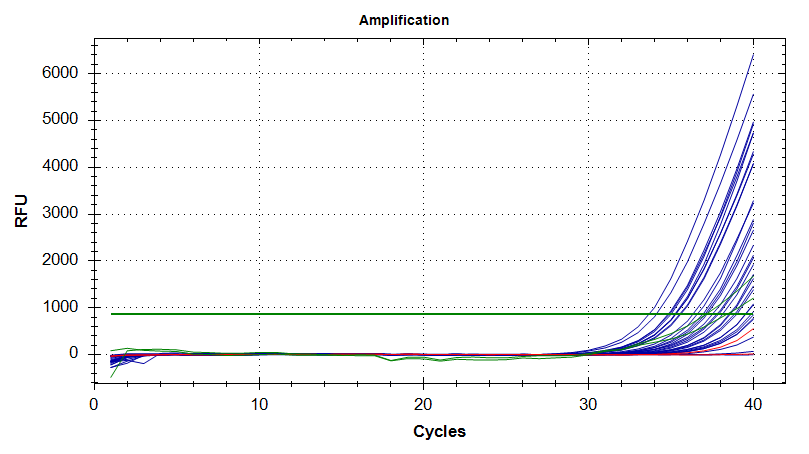
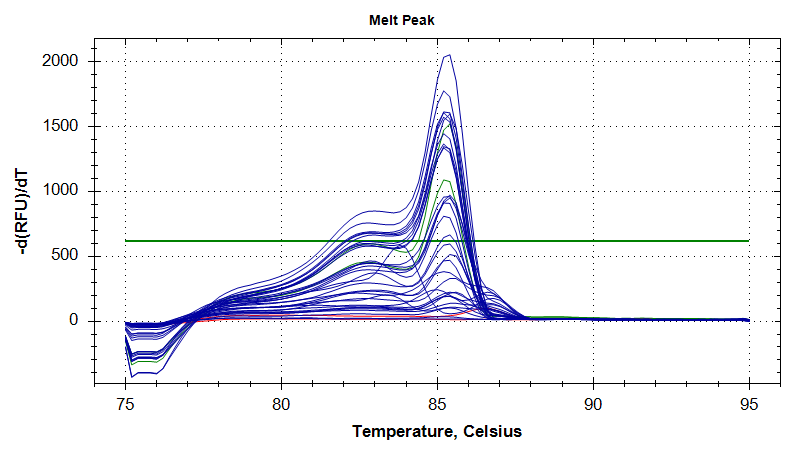
Well, this primer set and/or the gDNA is not good. In the plots below, the positive control gNDA is in green, samples in blue, and no template controls (NTC) are in red.

Poor performance is most easily noticed when looking at the melt curves. They have multiple peaks, suggesting non-specific amplification, even in the positive control.

Additionally, although less evident from just looking at the plots, is the replicates are highly inconsistent. Although it’s possible that might be due to poor technique, it’s very unlikely.

Will have to identify different primers and/or positive control DNA.


Amplification Plots


Melt Curves

Reverse Transcription – O.lurida DNased RNA 1hr post-mechanical stress

Performed reverse transcription on the Olympia oyster DNased RNA from the 1hr post-mechanical stress samples from Jake’s project. To accommodate the large numbers of anticipated genes to be targeted in subsequent qPCRs, I prepared 100μL reactions (normally, 25μL reactions are prepared) using 250ng of each DNased RNA. A 1:10 dilution of the oligo dT primers (Promega) was prepared to improve pipetting accuracy. All incubations were performed in a thermal cycler without using a heated lid.

DNased RNA was combined with NanoPure H2O and oligo dT primers in 24 wells of a PCR plate, heated @ 70C for 10mins and immediately placed on ice. After 5mins, the plate was spun 2000g @ RT for 2mins and returned to ice.

25.25μL of a master mix containing 5x M-MLV Buffer (Promega), dNTPs (10mM each; Promega), and M-MLV Reverse Transcriptase (50U/rxn; Promega) was distributed to each well and mixed via pipetting. The plate was heated @ 42C for 1hr, 95C for 3mins. The plate was spun 2000g @ RT for 2mins and then stored @ -20C.

Plate layout and all calculations can be found here (Google Sheet): 20150806_Jake_oly_mech_stress_cDNA_calcs

qPCR – Jake’s O.lurida ctenidia 1hr post-mechanical stress DNased RNA

Ran qPCR on DNased RNA from earlier today to assess whether there was any residual gDNA after the DNase treatment with Oly_Actin_F/R primers (SR IDs: 1505, 1504).

Used 1μL from all templates.

All samples were run in duplicate.

Positive control was HL1 O.lurida DNA isolated by Jake on 20150323.

Cycling params:

  • 95C – 2.5mins
  • 40 cycles of:
    • 95C – 10s
    • 60C – 20s
  • Melt curve

Master mix calcs are here: 201500806_qPCR_Oly_DNased_RNA

qPCR Plate Layout: 20150806_qPCR_plate_Jake_Oly_DNased_RNA

Results:

qPCR Data File (Opticon): 20150806_165044.tad
qPCR Report (Google Spreadsheet): 20150806_qPCR_Report_Jake_Oly_DNased_RNA

Positive control comes up around cycle ~21.

No amplification in the no template controls.

Two wells of the DNased RNA samples exhibit amplification (E3, F6), however the corresponding respective replicate does not. Will proceed with reverse transcription.


Amplification Plots

Positive Controls


Melt Curves

Positive Controls (HL1)

DNased RNA Samples

Follow the green and red lines with the vertical bars. The different colors reflect that those are two different samples. Additionally, their respective replicates do not exhibit amplification.

RNA Quantification – O.lurida 1hr post-mechanical heat stress DNased RNA

DNased RNA from 07272015 was quantified using the Roberts Lab NanoDrop1000.


Results:

The 260/280 ratios don’t look great, but that is most likely due to the DNase treatment. The DNase that’s added to each sample isn’t actually removed, so that additional protein will skew the 260/280 ratios. Will proceed with qPCR to check for any residual gDNA in these samples.


Reverse Transcription – O.lurida DNased RNA Controls and 1hr Heat Shock

Performed reverse transcription on the Olympia oyster DNased RNA from the control samples and the 1hr heat shock samples of Jake’s project. To accommodate the large numbers of anticipated genes to be targeted in subsequent qPCRs, I prepared 100μL reactions (normally, 25μL reactions are prepared) using 250ng of each DNased RNA. A 1:10 dilution of the oligo dT primers (Promega) was prepared to improve pipetting accuracy. All incubations were performed in a thermal cycler without using a heated lid.

DNased RNA was combined with NanoPure H2O and oligo dT primers in 48 wells of a PCR plate, heated @ 70C for 10mins and immediately placed on ice. After 5mins, the plate was spun 2000g @ RT for 2mins and returned to ice.

25.25μL of a master mix containing 5x M-MLV Buffer (Promega), dNTPs (10mM each; Promega), and M-MLV Reverse Transcriptase (50U/rxn; Promega) was distributed to each well and mixed via pipetting. The plate was heated @ 42C for 1hr, 95C for 3mins. The plate was spun 2000g @ RT for 2mins and then stored @ -20C.

Plate layout and all calculations can be found here (Google Sheet): 20150616_Jake_Oly_cDNA_Calcs

Sample Submission – Geoduck Gonad for RNA-seq

Prepared two pools of geoduck RNA for RNA-seq (Illumina HiSeq2500, 100bp, PE) with GENEWIZ, Inc.

I pooled a set of female and a set of male RNAs that had been selected by Steven based on the Bioanalyzer results from Friday.

The female RNA pool used 210ng of each sample, with the exception being sample #08. This sample used 630ng. The reason for this was due to the fact that there weren’t any other female samples to use from this developmental time point. The two other developmental time points each had three samples contributing to the pool. So, three times the quantity of the other individual samples was used to help equalize the time point contribution to the pooled sample. Additionally, 630ng used the entirety of sample #08.

The male RNA pool used 315ng of each sample. This number differs from the 210ng used for the female RNAs so that the two pools would end up with the same total quantity of RNA. However, now that I’ve typed this, this doesn’t matter since the libraries will be equalized before being run on the Illumina HiSeq2500. Oh well. As long as each sample in each pool contributed to the total amount of RNA, then it’s all good.

The two pools were shipped O/N on dry ice.

  • Geo_pool_M
  • Geo_pool_F

Calculations (Google Sheet): 20150601_Geoduck_GENEWIZ_calcs

Bioanalyzer – Geoduck Gonad RNA Quality Assessment

Before proceeding with transcriptomics for this project, we need to assess the integrity of the RNA via Bioanalyzer.

RNA that was previously isolated on 20150508, 20150505, 20150427, and 20150424 (those notebook entries have been updated to report this consolidation and have a link to this notebook entry) were consolidated into single samples (if there had been multiple isolations of the same sample) and spec’d on the Roberts Lab NanoDrop1000:

Google Sheet: 20150528_geoduck_histo_RNA_ODs

NOTE: Screwed up consolidation of Geoduck Block 03 sample (added one of the 04 dupes to the tube, so discarded 03).

RNA was stored in Shellfish RNA Box #5.

RNA was submitted to to Jesse Tsai at University of Washington Department of Environmental and Occupational Health Science Functional Genomics Laboratory for running on the Agilent Bioanalyzer 2100, using either the RNA Pico or RNA Nano chips, depending on RNA concentration (Pico for lower concentrations and Nano for higher concentrations – left decision up to Jesse).


Results:

Bioanalzyer 2100 Pico Data File (XAD): SamWhite_Eukaryote Total RNA Pico_2015-05-28_12-50-00.xad
Bioanalzyer 2100 Nano Data File (XAD): SamWhite_Eukaryote Total RNA Nano_2015-05-28_13-22-53.xad


Pico Gel Representation


Pico Electropherogram


Nano Gel Representation


Nano Electropherogram


Jesse alerted me to the fact that they did not have any ladder to use on the Nano chip, as someone had used the remainder, but failed to order more. I OK’d him to go ahead with the Nano chip despite lacking ladder, as we primarily needed to assess RNA integrity.


Bad Samples:

  • Geo 04 – No RNA detected
  • Geo 65, 67, 68 – These three samples show complete degradation of the RNA (i.e. no ribosomal band present, significant smearing on the gel representation).

All other samples look solid. Will discuss with Steven and Brent on how they want to proceed.

Full list of samples for this project (including the Block 03 sample not included in this analysis; see above). Grace’s notebook will have details on what the numbering indicates (e.g. developmental stage).

  • block 02
  • block 03 (no RNA)
  • block 04 (no RNA)
  • block 07
  • block 08
  • block 09
  • block 34
  • block 35
  • block 38
  • block 41
  • block 42
  • block 46
  • block 51
  • block 65 (degraded RNA)
  • block 67 (degraded RNA)
  • block 68 (degraded RNA)
  • block 69
  • block 70

Reverse Transcription – Subset of Jake’s O.lurida DNased RNA

Currently don’t have sufficient reagents to perform reverse transcription on the entire set of DNased RNA (control and 1hr.heat-shocked O.lurida ctenidia samples). To enable Jake to start testing out some of his primers while we wait for reagents to come in, Steven suggested I generate some cDNA for him to use.

Used the following DNased RNA:

  • HC1
  • NC1
  • SC1
  • HT1 1
  • NT1 1
  • ST1 1

Reverse Transcription Calcs: 20150522_Jake_Oly_cDNA_Calcs

Briefly:

  • Reactions run in 0.5mL snap cap tubes
  • 250ng of DNased RNA used in each reaction
  • Combined DNased RNA with oligo dT primers and water; incubated 70C 5mins; immediately placed on ice
  • Added 6.75μL of buffer/dNTP/enzyme master mix to each sample; incubated 42C for 1hr; 95C for 3mins

Samples will be given to Jake and stored @ -20C.