Tag Archives: bioanalyzer

Bioanalyzer – Tanner Crab RNA Isolated with RNeasy Plus Mini Kit

Ran the four Tanner crab RNA samples that I isolated yesterday on the Seeb Lab Bioanalyzer 2100 (Agilent) using the RNA Pico 6000 Kit.

Samples were run following kit protocol:

  • Chip priming station in Position C with syringe clip at top position

  • RNA denatured at 70C for 2mins and stored on ice.

  • RNA ladder aliquot was from 20160826 by Hollie Putnam.


RESULTS

Bioanalyzer data file (XAD):

ELECTROPHEROGRAMS:


GEL REPRESENATATIONS


These results look great to me. Clear, defined peaks/bands, representing ribosomal RNA.

Oddly, one sample (crab_506) appears to be shifted, relative to the other three, despite exhibiting the same peak/banding pattern. Not sure what would cause something like this; contaminants?

Regardless, we finally have clean RNA and have a usable Bioanalyzer profile to use for reference for crab RNA.

NOTE: The lanes marked with red on the gel representation image indicate that a ribosomal integrity number (RIN) could not be calculated. This is to be expected! The RIN is based on the expectation of two rRNA bands. The anomaly is sample crab_451 – a RIN was actually determined for that sample!

Will likely move forward with additional RNA isolations using the RNeasy Plus Kit (Qiagen).

Library Construction – Geoduck Water Filter Metagenome with Nextera DNA Flex Kit (Illumina)

Made Illumina libraries with goeduck metagenome water filter DNA I previously isolated on:

We used a free Nextera DNA Flex Kit (Illumina) that we won in a contest held by Illumina!

Followed the manufacturer’s protocol for input DNA quantities <10ng with the following changes/notes:

  • PCR steps performed in 200uL thin-walled PCR tubes.

  • Magnetic separations were performed in 1.7mL snap cap tubes.

  • Thermalcycler: PTC-200 (MJ Research)

  • Magnet: DynaMag 2 (Invitrogen)

See the Library Calcs sheet (link below) for original sample names and subsequent library sample names.

IMPORTANT!

The sheet also contains the indexes used for each library. This info will be necessary for sequencing facility.

Library Calcs (Google Sheet):

Links to the Illumina manuals are below:

After library construction was completed, individual libraries were quantified on the Roberts Lab Qubit 3.0 (Invitrogen) with the Qubit 1x dsDNA HS Assay Kit.

2uL of each sample was used for each assay.

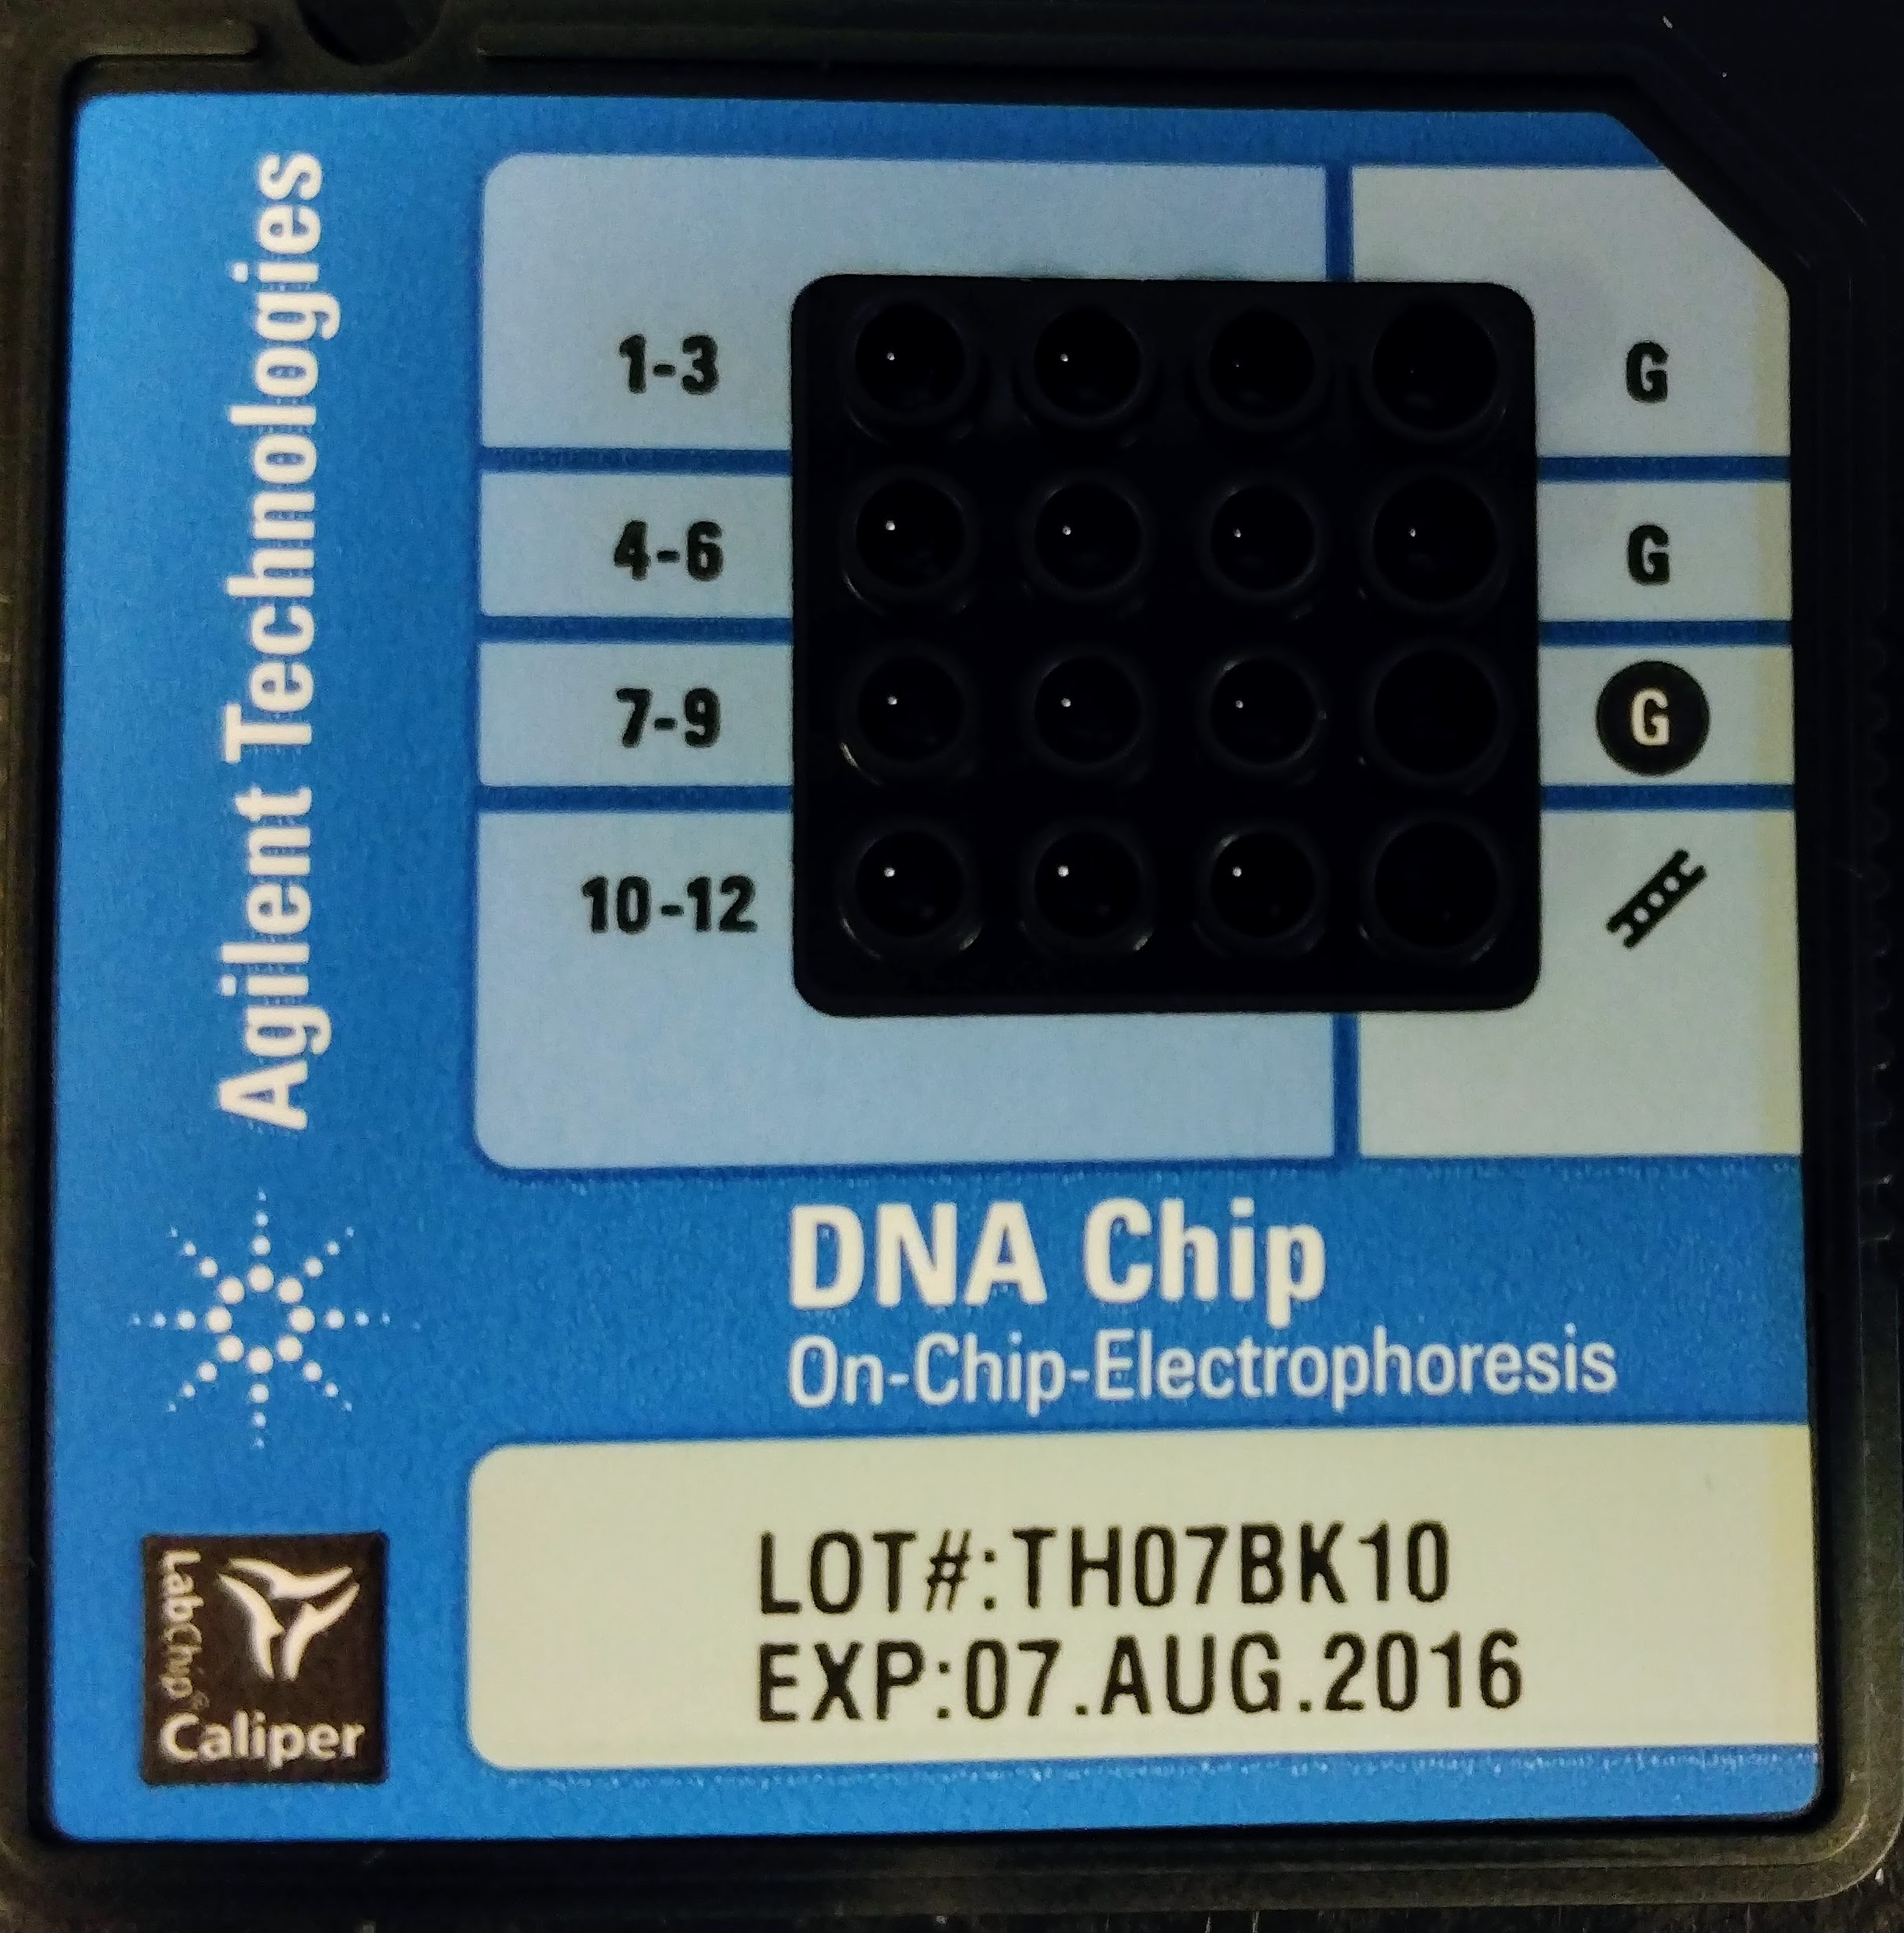
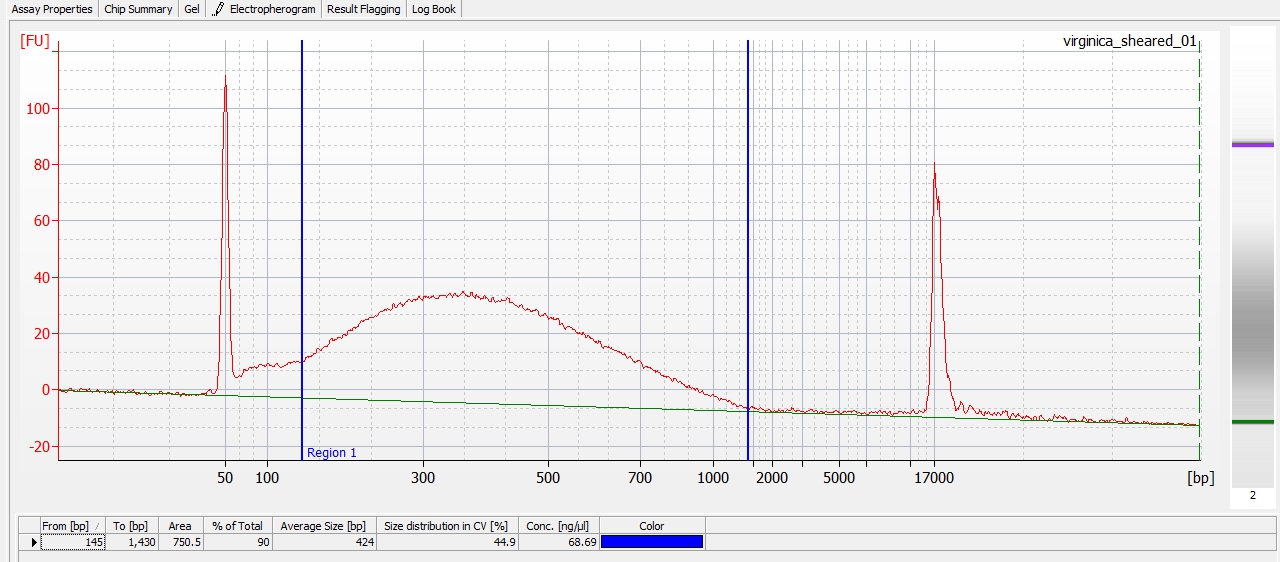
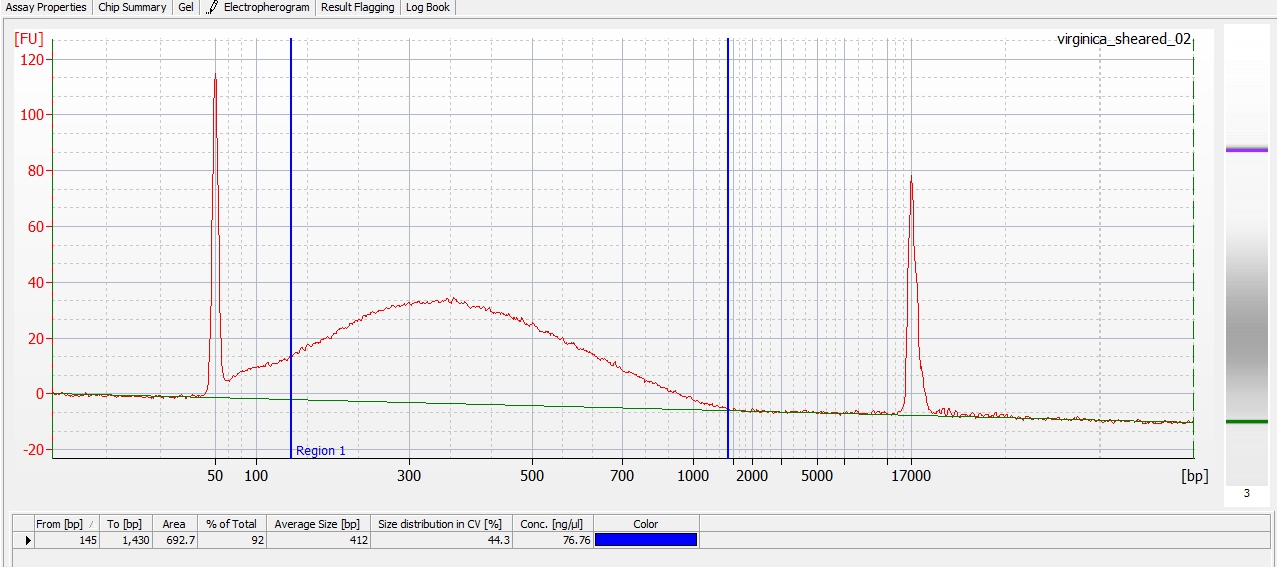
Library quality was assessed using the Seeb Lab 2100 Bioanalyzer (Agilent) with a High Sensitivity DNA Kit, using 1uL of each sample.

Libraries were stored in the small -20C in FTR213:


Results:

Qubit Raw Data (Google Sheet):

Bioanalyzer File (XAD):

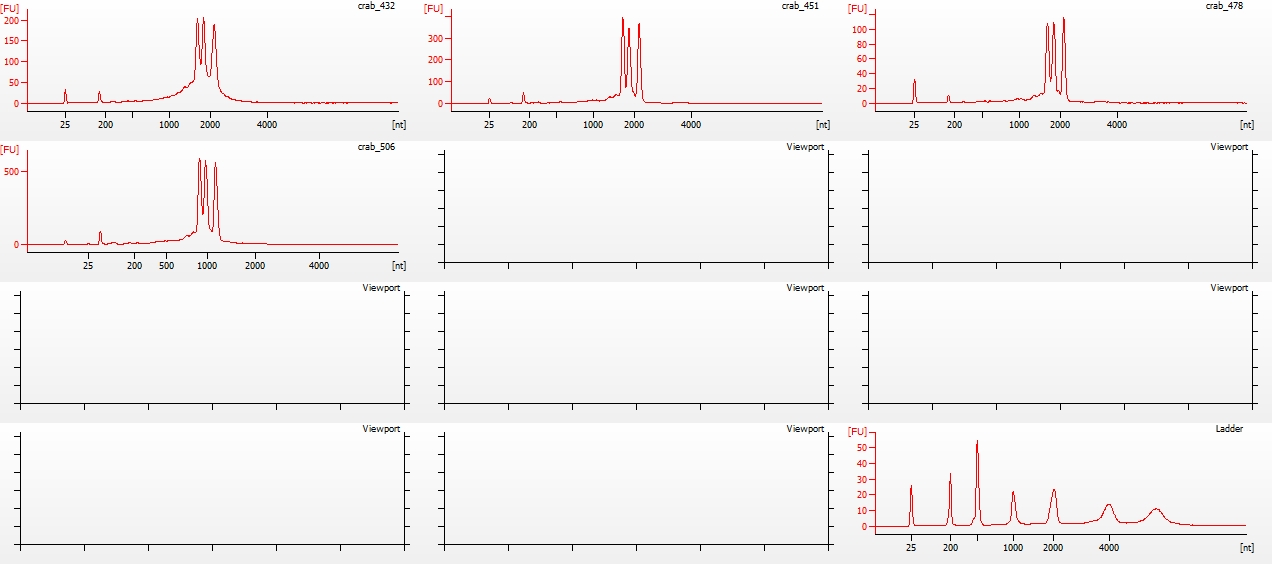
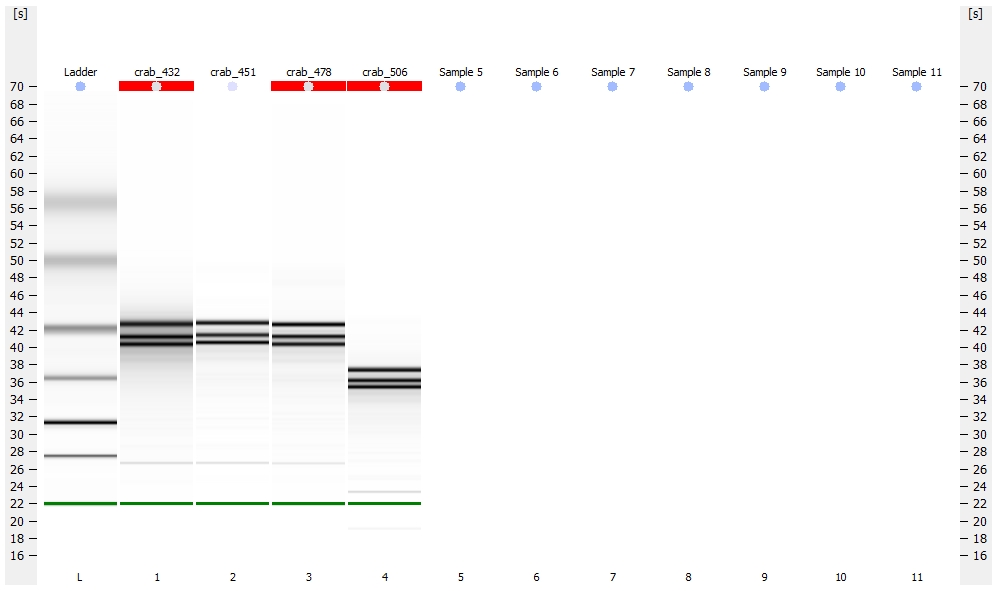
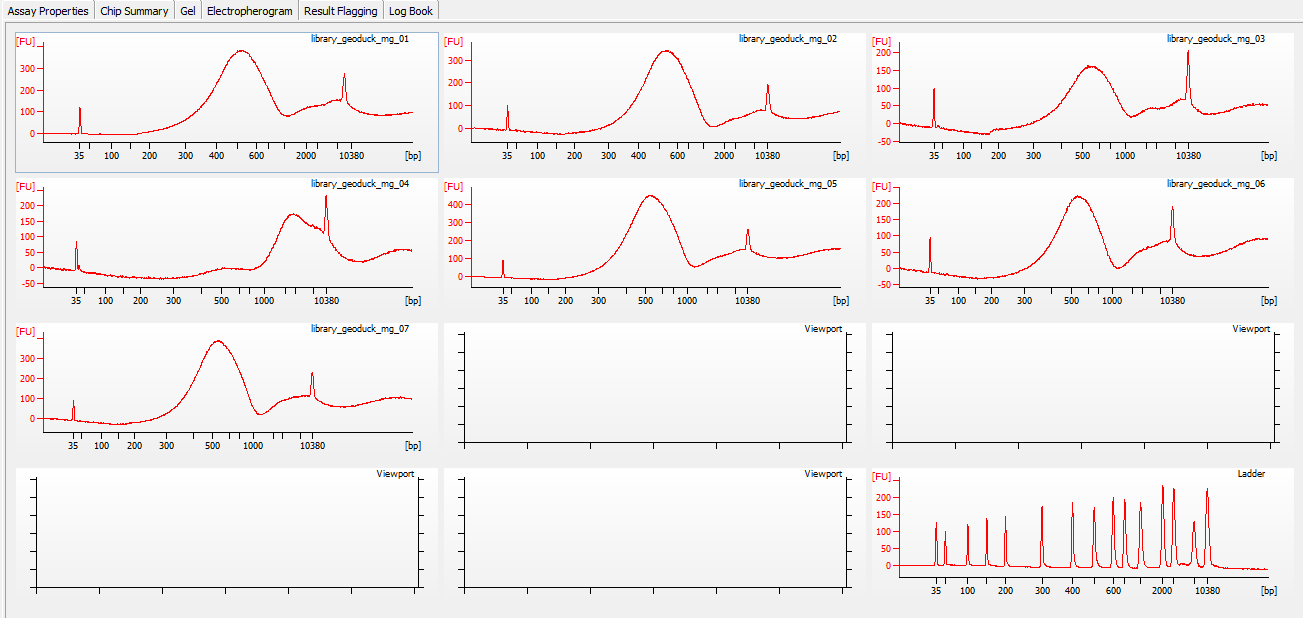
All libraries have DNA in them, so that’s good!

Except for one library (Library Geoduck MG #04 is bad), the other libraries look OK (i.e. not great). Compared to the example on Pg. 12 in the manual, these libraries all have some extra high molecular weight stuff.

When selecting the range listed in the Nextera Kit manual, the average fragment size is ~530bp – the expected size should be ~600bp.

Spoke with Steven about Library Geoduck MG #04 and we’ve opted to just leave it out.

All other samples were pooled into a single samples according to the manufacturer’s protocol.

This pooled sample was stored in the same -20C box as above, in position I4.


UPDATE 20180808

After some confusion with the sequencing facility, I contacted Illumina regarding adapter sequences. I used the sequences provided for the Nextera DNA 24 CD Indexes (which was the index kit we used) on p.18 of the Illumina Index Adapter Pooling Guide.

As it turns out, these sequences are incorrect. The correct sequences are on p.12 of that document (the Nextera DNA 96 CD Indexes).

I’ve updated the Google Sheet (linked above) to reflect the correct index sequences.

Email from Illumina is below. Even though he specifically references the H705 adapter, the correct sequence information for all i7 index adapters is found on p.12.

Hi Sam,

Thanks for the clarification! For the index sequence H705, this sequence is incorrect in the Index Adapters Pooling Guide. The correct information is found on page 12 of the same document and should be:

H705 “AGGAGTCC” (Bases in Adapter) and “GGACTCCT” (bases for sample sheet.

This is also consistent with the Illumina Adapters letter.

We have provided this feed back to our colleagues to update the document so that all the information is consistent.

Thanks for your patience and understanding while we evaluated this issue. If we do have any other questions or concerns, please let us know and we would be happy to discuss this further.

Best,

Russell

Russell Chan, Ph.D.

Technical Applications Scientist

Illumina Technical Support

Telephone available 24 hours

Monday through Friday

Technical Bulletins: https://support.illumina.com/bulletins.html

Trainings: http://support.illumina.com/traidexes

DNA Sonication & Bioanalzyer – C. virginica gDNA for MeDIP

I transferred 8ug (136uL) of Crassotrea virginica gDNA (isolated earlier today) to two separate 1.7mL snap cap tubes for sonication/shearing.

I performed shearing at the NOAA Northwest Fisheries Science Center, using the Qsonica Q800R. Mackenzie Gavery assisted me.

Target fragment size was ~500bp.

Samples were run at the same time with the following settings:

  • 10 minutes
  • 30 seconds on, 30 seconds off
  • 25% power

After sonication, fragmentation was assessed using the Seeb Lab’s Bioanlyzer 2100 (Agilent) and the DNA 12000 Chip Kit (Agilent). NOTE: All of the reagents and the chips were past their expiration dates (most in June 2016).

Results:

Agilent 2100 Bioanalyzer Expert file (XAD): 2100 expert_DNA 12000_DE72902486_2017-12-11_13-45-31.xad

Fragmentation was successful, and pretty consistent.

Both samples appear to have an average fragment size of ~420bp. Will proceed with MeDIP, once reagents are received.

Unsheared gDNA:

Illumina Methylation Library Construction – Oly/C.gigas Bisulfite-treated DNA

Took the bisulfite-treated DNA from 20151218 and made Illumina libraries using the TruSeq DNA Methylation Library Kit (Illumina).

Quantified the completed libraries using the Qubit 3.0 dsDNA BR Kit (ThermoFisher).

Evaluated the DNA with the Bioanalyzer 2100 (Agilent) using the DNA 12000 assay. Illumina recommended using the High Sensitivity assay, but we don’t have access to that so I figured I’d just give the DNA 12000 assay a go.

SampleName IndexNumber BarCode
1NF11 1 ATCACG
1NF15 2 CGATGT
1NF16 3 TTAGGC
1NF17 4 TGACCA
2NF5 5 ACAGTG
2NF6 6 GCCAAT
2NF7 7 CAGATC
2NF8 8 ACTTGA
M2 9 GATCAG
M3 10 TAGCTT
NF2_6 11 GGCTAC
NF_18 12 CTTGTA


Results:

Library Quantification (Google Sheet): 20151221_quantification_illumina_methylation_libraries

Test Name Concentration (ng/μL)
1NF11 Out of range
1NF15 2.14
1NF16 2.74
1NF17 2.64
2NF5 2.92
2NF6 Out of range
2NF7 2.42
2NF8 2.56
M2 Out of range
M3 2.1
NF2_6 2.38
NF2_18 Out of range


I used the Qubit’s BR (broad range) kit because I wasn’t sure what concentrations to expect. I need to use the high sensitivity kit to get a better evaluation of all the samples’ concentrations.


Bioanalyzer Data File (Bioanalyzer 2100): 2100_20expert_DNA_2012000_DE72902486_2015-12-21_16-58-43.xad


Ha! Well, looks like you definitely need to use the DNA High Sensitivty assay for the Bioanalyzer to pick up anything. Although, I guess you can see a slight hump in most of the samples at the appropriate sizes (~300bp); you just have to squint. ;)

Bioanalyzer – Bisulfite-treated Oly/C.gigas DNA

Following the guidelines of the TruSeq DNA Methylation Library Prep Guide (Illumina), I ran 1μL of each sample on an RNA Pico 6000 chip on the Seeb Lab’s Bioanalyzer 2100 (Agilent) to confirm that bisulfite conversion from earlier today worked.

Results:

Data File 1(Bioanlyzer 2100): 2100 expert_Eukaryote Total RNA Pico_DE72902486_2015-12-18_21-05-04.xad

Data File 1(Bioanlyzer 2100): 2100 expert_Eukaryote Total RNA Pico_DE72902486_2015-12-18_21-42-55.xad


Firstly, the ladder failed to produce any peaks. Not sure why this happened. Possibly not denatured? Seems unlikely, but next time I run the Pico assay, I’ll denature the ladder aliquot I use prior to running.

Overall, the samples look as they should (see image from TruSeq DNA Methylation Kit manual below), albeit some are a bit lumpy.

DNA Sonication – Oly gDNA for MBD

In preparation for MBD enrichment, fragmented Olympia oyster gDNA with a target size of ~350bp.

Genomic DNA samples were isolated and provided to us by Katherine Silliman at UIC. Selected samples will compare Hood Canal (HC) and Oyster Bay (SS, South Sound) populations.

Used the Seeb Lab’s Bioruptor 300 (Diagenode) sonicator.

After sonication, samples were run on a the Seeb Lab’s 2100 Bioanalyzer (Agilent) on DNA 12000 chips.

Results:

HOOD CANAL SAMPLES


OYSTER BAY SAMPLES

More detailed analysis (including average fragment size for each samples) will be coming soon…

DNA Quantification & Quality Assessment – Oly 2SN gDNA

Comparison of three different approaches to using the E.Z.N.A. Mollusc Kit:

  • Fresh isolations by me
  • Fresh isolations by Mrunmayee
  • Isolations from tissue frozen in buffer by me

Results:

Bioanalyzer Data File (XAD file): 2100 expert_DNA 12000_DE72902486_2015-11-04_15-06-32.xad

There’s a LOT going on here. Will update this entry tomorrow with more info.

DNA Quantification & Quality Assessment – Geoduck & Oly gDNA

Quantified the following samples with the Roberts Lab NanoDrop1000 (ThermoFisher) and assessed DNA integrity on the Seeb Lab Bioanalyzer 2100 (Agilent) using the DNA 12000 chip assay:

Results:

Bioanalyzer Data File (XAD file): 2100 expert_DNA 12000_DE72902486_2015-11-04_15-06-32.xad


OK, there’s a LOT going on here. Will update this notebook with my thoughts sometime tomorrow…


Bioanalyzer – Geoduck Gonad RNA Quality Assessment

Before proceeding with transcriptomics for this project, we need to assess the integrity of the RNA via Bioanalyzer.

RNA that was previously isolated on 20150508, 20150505, 20150427, and 20150424 (those notebook entries have been updated to report this consolidation and have a link to this notebook entry) were consolidated into single samples (if there had been multiple isolations of the same sample) and spec’d on the Roberts Lab NanoDrop1000:

Google Sheet: 20150528_geoduck_histo_RNA_ODs

NOTE: Screwed up consolidation of Geoduck Block 03 sample (added one of the 04 dupes to the tube, so discarded 03).

RNA was stored in Shellfish RNA Box #5.

RNA was submitted to to Jesse Tsai at University of Washington Department of Environmental and Occupational Health Science Functional Genomics Laboratory for running on the Agilent Bioanalyzer 2100, using either the RNA Pico or RNA Nano chips, depending on RNA concentration (Pico for lower concentrations and Nano for higher concentrations – left decision up to Jesse).


Results:

Bioanalzyer 2100 Pico Data File (XAD): SamWhite_Eukaryote Total RNA Pico_2015-05-28_12-50-00.xad
Bioanalzyer 2100 Nano Data File (XAD): SamWhite_Eukaryote Total RNA Nano_2015-05-28_13-22-53.xad


Pico Gel Representation


Pico Electropherogram


Nano Gel Representation


Nano Electropherogram


Jesse alerted me to the fact that they did not have any ladder to use on the Nano chip, as someone had used the remainder, but failed to order more. I OK’d him to go ahead with the Nano chip despite lacking ladder, as we primarily needed to assess RNA integrity.


Bad Samples:

  • Geo 04 – No RNA detected
  • Geo 65, 67, 68 – These three samples show complete degradation of the RNA (i.e. no ribosomal band present, significant smearing on the gel representation).

All other samples look solid. Will discuss with Steven and Brent on how they want to proceed.

Full list of samples for this project (including the Block 03 sample not included in this analysis; see above). Grace’s notebook will have details on what the numbering indicates (e.g. developmental stage).

  • block 02
  • block 03 (no RNA)
  • block 04 (no RNA)
  • block 07
  • block 08
  • block 09
  • block 34
  • block 35
  • block 38
  • block 41
  • block 42
  • block 46
  • block 51
  • block 65 (degraded RNA)
  • block 67 (degraded RNA)
  • block 68 (degraded RNA)
  • block 69
  • block 70

Bioanalyzer Data – Geoduck RNA from Histology Blocks

I received the Bioanalyzer data back for the geoduck foot RNA samples I submitted 20150422. The two samples were run on the RNA Pico chip assay.


Results:

Bioanalzyer 2100 Data File (XAD): SamWhite_Eukaryote Total RNA Pico_2015-04-23_13-04-16.xad

Data file requires 2100_Expert_B0208_SI648_SR2 version of the software (Windows).

Gel Representation


Electropherogram


The samples look really good! As we’ve seen previously in shellfish RNA, there is a single, prominent rRNA band/peak with very little degradation (smearing and/or no prominent peak/band).

Will proceed with RNA isolation from the remaining histology blocks.