Tag Archives: heat shock

qPCRs – Ronit’s C.gigas ploidy/dessication/heat stress cDNA (1:5 dilution)

IMPORTANT: The cDNA used for the qPCRs described below was a 1:5 dilution of Ronit’s cDNA made 20181017 with the following primers! Diluted cDNA was stored in his -20oC box with his original cDNA.

The following primers were used:

18s

  • Cg_18s_F (SR ID: 1408)

  • Cg_18s_R (SR ID: 1409)

EF1 (elongation factor 1)

  • EF1_qPCR_5′ (SR ID: 309)

  • EF1_qPCR_3′ (SR ID: 308)

HSC70 (heat shock cognate 70)

  • Cg_hsc70_F (SR ID: 1396)

  • Cg_hsc70_R2 (SR ID: 1416)

HSP90 (heat shock protein 90)

  • Cg_Hsp90_F (SR ID: 1532)

  • Cg_Hsp90_R (SR ID: 1533)

DNMT1 (DNA methyltransferase 1)

  • Cg_DNMT1_F (SR ID: 1511)

  • Cg_DNMT1_R (SR ID: 1510)

Prx6 (peroxiredoxin 6)

  • Cg_Prx6_F (SR ID: 1381)

  • Cg_Prx6_R (SR ID: 1382)

Samples were run on Roberts Lab CFX Connect (BioRad). All samples were run in duplicate. See qPCR Report (Results section) for plate layout, cycling params, etc.

qPCR master mix calcs (Google Sheet):


RESULTS

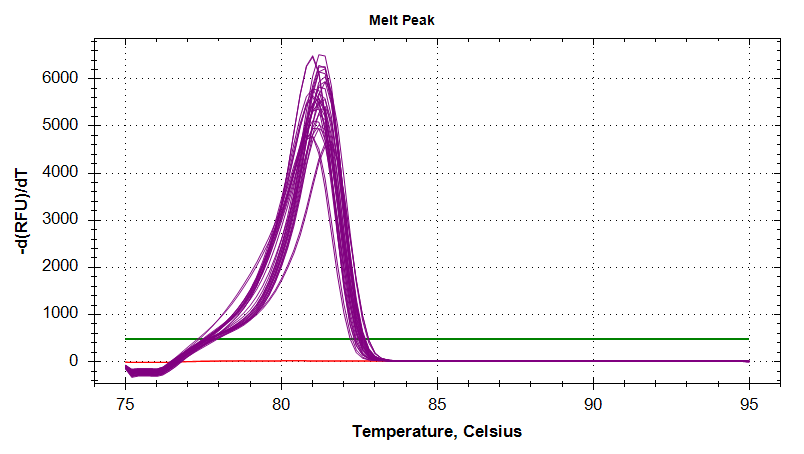
No analysis here. Will analyze data and post in different notebook entry. This entry just contains the qPCR setup, resulting data, and a glimpse of how each primer performed.

Nothing is broken down based on sample ploidy or experimental conditions.

18s

qPCR Report (PDF):

qPCR File (PCRD):

qPCR Data (CSV):

Amplication Plots

Melt Curves


DNMT1

qPCR Report (PDF):

qPCR File (PCRD):

qPCR Data (CSV):

Amplication Plots
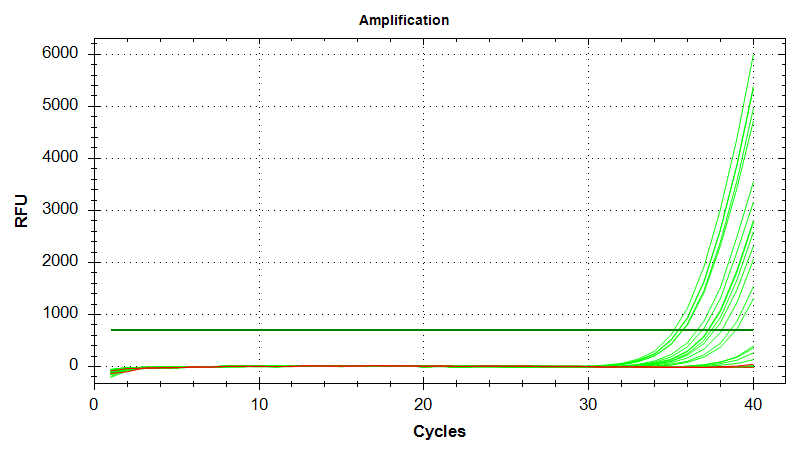
Melt Curves
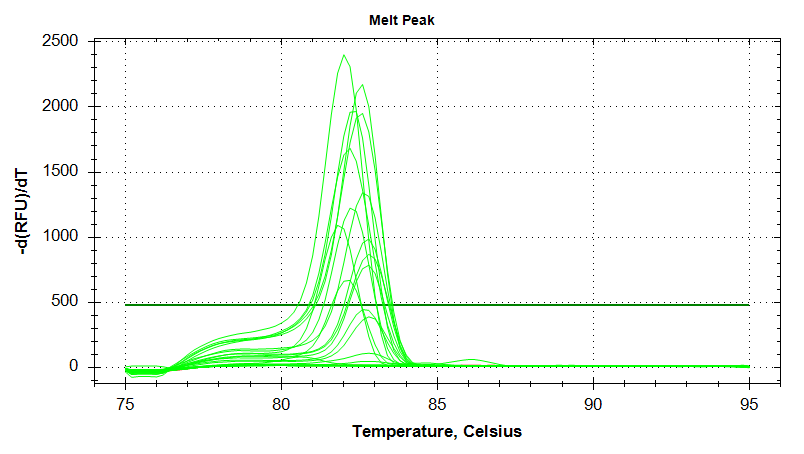

EF1

qPCR Report (PDF):

qPCR File (PCRD):

qPCR Data (CSV):

Amplication Plots – Manual Threshold (Linear)

Amplication Plots – Manual Threshold (Log)

Amplication Plots – Automatic Threshold (Linear)
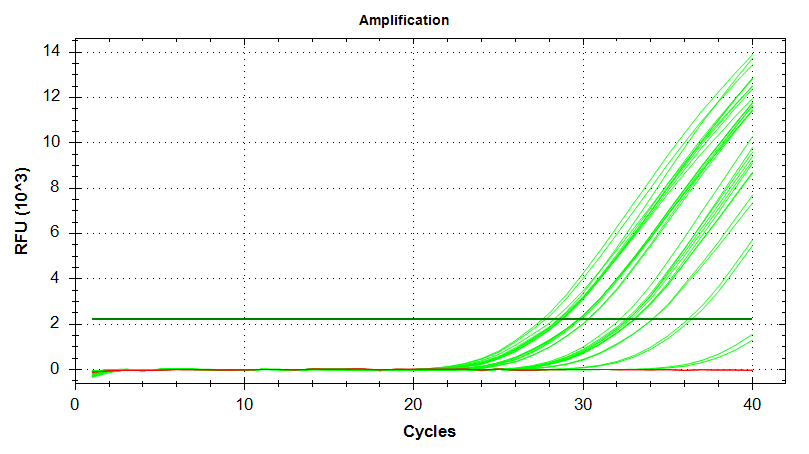
Amplication Plots – Automatic Threshold (Log)
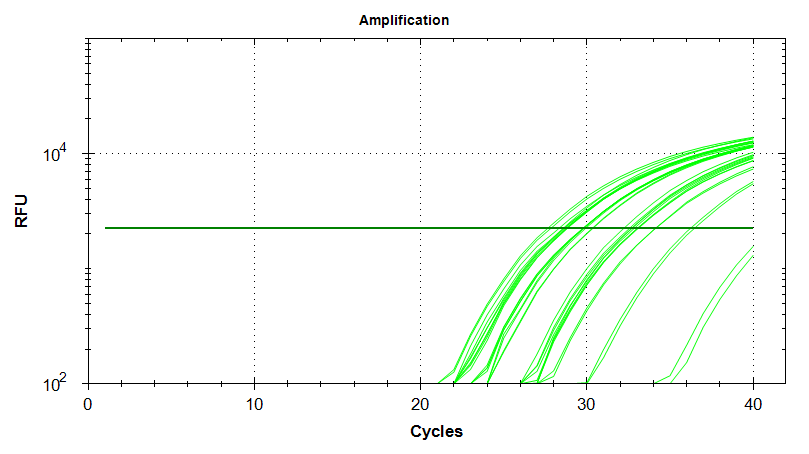
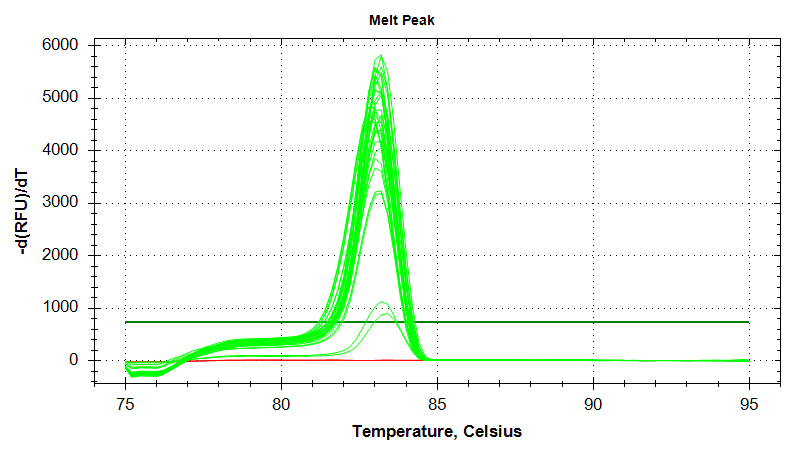
Melt Curves

HSC70

qPCR Report (PDF):

qPCR File (PCRD):

qPCR Data (CSV):

Amplication Plots
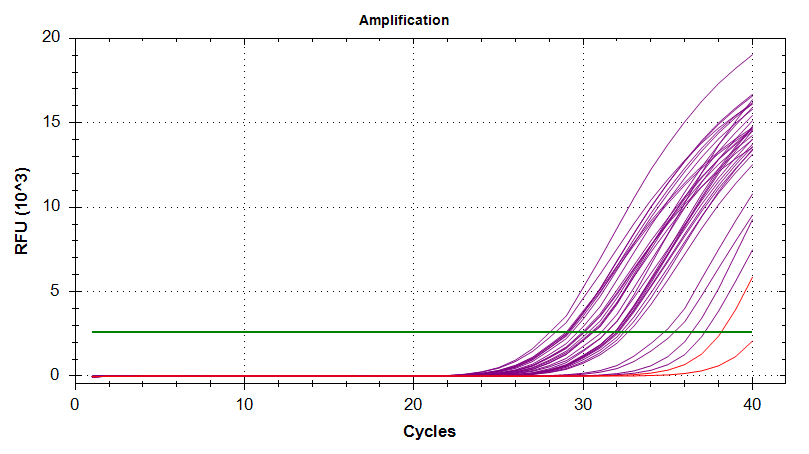
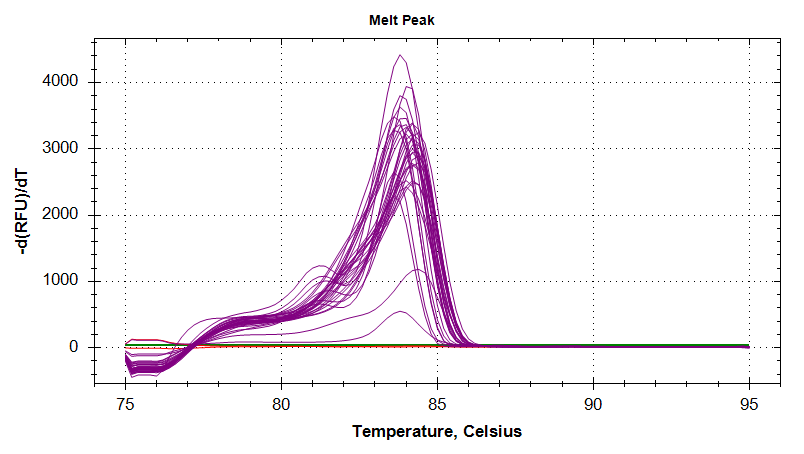
Melt Curves

HSP90

qPCR Report (PDF):

qPCR File (PCRD):

qPCR Data (CSV):

Amplication Plots
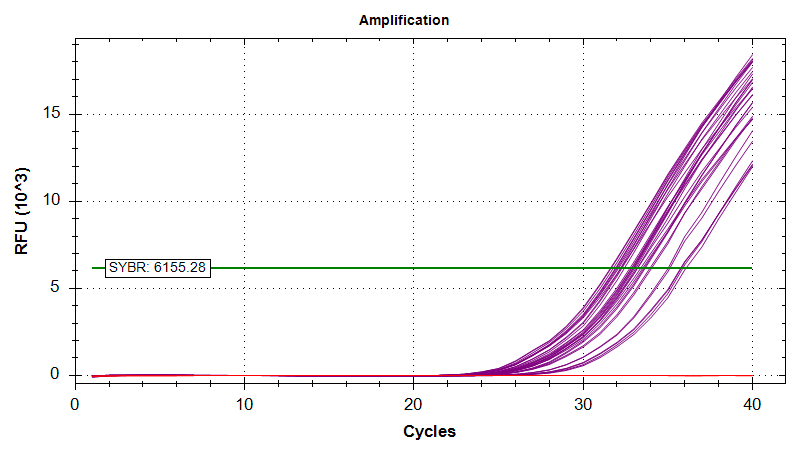
Melt Curves


Prx6

qPCR Report (PDF):

qPCR File (PCRD):

qPCR Data (CSV):

Amplication Plots

Melt Curves
Reverse Transcription – Ronit’s C.gigas DNased ctenidia RNA

Proceeded with reverse transcription of Ronit’s DNased ctenidia RNA (from 20181016).

Reverse transcription was performed using 100ng of each sample with M-MMLV Reverse Transcriptase from Promega.

Briefly, 100ng of DNased RNA was combined with oligo dT primers and brought up to a final volume of 15uL. Tubes were incubated for 5mins at 70oC in a PTC-200 thermal cycler (MJ Research), using a heated lid. Samples were immediately placed on ice.

A master mix of buffer, dNTPs, water, and M-MMLV reverse transcriptase was made, 10uL of the master mix was added to each sample, and mixed via finger flicking. Samples were incubated for 1hr at 42oC in a PTC-200 thermal cycler (MJ Research), using a heated lid, followed by a 5min incubation at 65oC.

Samples were stored on ice for use later this afternoon by Ronit.

Samples will be stored in Ronit’s -20oC box.

Reverse transcription calcs (Google Sheet):

Reverse Transcription – Subset of Jake’s O.lurida DNased RNA

Currently don’t have sufficient reagents to perform reverse transcription on the entire set of DNased RNA (control and 1hr.heat-shocked O.lurida ctenidia samples). To enable Jake to start testing out some of his primers while we wait for reagents to come in, Steven suggested I generate some cDNA for him to use.

Used the following DNased RNA:

  • HC1
  • NC1
  • SC1
  • HT1 1
  • NT1 1
  • ST1 1

Reverse Transcription Calcs: 20150522_Jake_Oly_cDNA_Calcs

Briefly:

  • Reactions run in 0.5mL snap cap tubes
  • 250ng of DNased RNA used in each reaction
  • Combined DNased RNA with oligo dT primers and water; incubated 70C 5mins; immediately placed on ice
  • Added 6.75μL of buffer/dNTP/enzyme master mix to each sample; incubated 42C for 1hr; 95C for 3mins

Samples will be given to Jake and stored @ -20C.

qPCR – Jake O.lurida ctenidia RNA (Heat Shock Samples) from 20150506

Ran qPCRs on the O.lurida total RNA I isolated on 20150506 to assess presence of gDNA carryover with Oly Actin primers (SR IDs: 1505, 1504).

Used 1μL from all templates.

All samples were run in duplicate.

Positive control was HL1 O.lurida DNA isolated by Jake on 20150323.

Master mix calcs are here: 20150512_qPCR_Oly_RNA

Cycling params:

  • 95C – 3mins
  • 40 cycles of:
    • 95C – 5s
    • 60C – 20s
  • Melt curve


Plate layout: 20150512_qPCR_plate_Jake_Oly_HS_RNA

Results:

qPCR Data File (Opticon2): Sam_20150512_123246.tad

qPCR Report (Google Spreadsheet):20150512_qPCR_Report_Jake_Oly_HS_RNA

Excluding the no template controls (NTC), all samples produced amplification. Will require DNasing before making cDNA.

Related to the qPCR I ran earlier today with these same primers, the efficiencies of the reactions on this plate are significantly better (i.e. normal; >80% efficiencies) than the earlier qPCR. The improved efficiency would also explain why the positive control comes up two cycles earlier on this run.

In the amplification plots below, the positive control reps are the two lines coming up at cycle ~20.


Amplification Plots


Melt Curves

RNA Isolation – Jake’s O. lurida Ctenidia Control from 20150422

Isolated RNA from Jake’s Olympia oyster ctenidia, controls, collected on 20150422. Samples had been homogenized and stored @ -80C.

The following sample tubes (heat-shocked oyster ctenidia) were removed from -80C and thawed at RT:

  •  42215 HC 1
  •  42215 HC 2
  • 42215 HC 3
  • 42215 HC 4
  • 42215 HC 5
  • 42215 HC 6
  • 42215 HC 7
  • 42215 HC 8
  • 42215 NC 1
  • 42215 NC 2
  • 42215 NC 3
  • 42215 NC 4
  • 42215 NC 5
  • 42215 NC 6
  • 42215 NC 7
  • 42215 NC 8
  • 42215 SC 1
  • 42215 SC 2
  • 42215 SC 3
  • 42215 SC 4
  • 42215 SC 5
  • 42215 SC 6
  • 42215 SC 7
  • 42215 SC 8


NOTE: 0.1% DEPC-H2O used throughout this procedure was prepared on 7/15/2010 by me.


According to Jake’s notebook entry, the samples should have been previously homogenized in RNAzol RT (Molecular Research Center; MRC). However, none of the samples showed evidence of being homogenized:


Procedure:

Samples were homogenized with disposable pestle in their respective tubes and vortexed.

Added 400μL of 0.1% DEPC-H2O to each sample and vortexed 15s.

Incubated samples 15mins at RT.

Centrifuged tubes 15mins at RT @ 16,000g.

750μL of the supe was transferred to a clean tube, added equal volume of isopropanol (750μL), mixed by inversion (20 times), and incubated at RT for 15mins.

Centrifuged 12,000g for 10mins.

Discarded supe.

Washed pellets with 500μL of 75% EtOH (made with 0.1% DEPC-H2O) and centrifuged 4,000g for 3mins at RT. Repeated one time.

Removed EtOH and resuspended in 100μL of 0.1% DEPC-H2O. Most samples required vortexing to dissolve pellet.

Sample tubes were transferred to ice, quantified on the Roberts Lab NanoDrop1000, and stored @ -80C in their original box, pictured:


Results:

Google Spreadsheet with absorbance data: 20150507_Jake_Oly_control_RNA_ODs


Excellent yields and pretty solid 260/280 ratios (>1.85). Interestingly, the 260/230 ratios aren’t so great (compared to yesterday’s isolations). I suspect that the reason for this is that there appeared to be more starting tissue in these samples than yesterday’s. The greater quantity of tissue explains the higher yields and could be tied to the decrease in the 260/230 ratios…

Anyway, things look good. Next step will be to check for gDNA carryover in these samples and yesterday’s samples.

RNA Isolation – Jake’s O. lurida Ctenidia 1hr Heat Stress from 20150422

Isolated RNA from Jake’s Olympia oyster ctenidia, 1hr heat shock, collected on 20150422. Samples had been homogenized and stored @ -80C.

The following sample tubes (heat-shocked oyster ctenidia) were removed from -80C and thawed at RT:

  • 42215 HT1 1
  • 42215 HT1 2
  • 42215 HT1 3
  • 42215 HT1 4
  • 42215 HT1 5
  • 42215 HT1 6
  • 42215 HT1 7
  • 42215 HT1 8
  • 42215 NT1 1
  • 42215 NT1 1
  • 42215 NT1 2
  • 42215 NT1 3
  • 42215 NT1 4
  • 42215 NT1 5
  • 42215 NT1 6
  • 42215 NT1 7
  • 42215 NT1 8
  • 42215 ST1 1
  • 42215 ST1 2
  • 42215 ST1 3
  • 42215 ST1 4
  • 42215 ST1 5
  • 42215 ST1 6
  • 42215 ST1 7
  • 42215 ST1 8

NOTE: Samples NT1 1 and NT1 2 only had 700μL of RNAzol RT in them. Added additional 300μL of RNAzol RT to each.

NOTE: 0.1% DEPC-H2O used throughout this procedure was prepared on 7/15/2010 by me.

According to Jake’s notebook entry, the samples should have been previously homogenized in RNAzol RT. However, none of the samples showed evidence of being homogenized:


In theory, if these samples were snap frozen on liquid nitrogen after being placed in the RNAzol RT, there should be almost no impact on the RNA.


Procedure:

Samples were homogenized with disposable pestle in their respective tubes and vortexed.

Added 400μL of 0.1% DEPC-H2O to each sample and vortexed 15s.

Incubated samples 15mins at RT.

Centrifuged tubes 15mins at RT @ 16,000g.

750μL of the supe was transferred to a clean tube, added equal volume of isopropanol (750μL), mix by inversion (20 times), and incubated at RT for 15mins.

Centrifuged 12,000g for 10mins.

Discarded supe.

Washed pellets with 500μL of 75% EtOH (made with 0.1% DEPC-H2O) and centrifuged 4,000g for 3mins at RT. Repeated one time.

Removed EtOH and resuspended in  100μL of 0.1% DEPC-H2O. Most samples required vortexing to dissolve pellet.

Sample tubes were transferred to ice, quantified on the Roberts Lab NanoDrop1000, and stored @ -80C in their original box, pictured:


Results:


Google Spreadsheet with absorbance data: 20150506_Jake_Oly_1h_HS_RNA_ODs

Overall, the samples have excellent yields. The exceptions being the two samples that had less than 1mL of RNAzol RT in them to start (their yields are actually fine, but relative to all the other samples, they aren’t great). Should I have left them that way instead of adding additional RNAzol RT? Was there something wrong with these samples in the first place and that’s why they didn’t have a full 1mL of RNAzol RT in the tube already?

The 260/280 ratios are pretty good for most of the samples (>1.8), however I’d prefer to see RNA with 260/280 ratios >1.9.

The 260/230 ratios are amazing! The best I’ve seen coming straight out of an RNA isolation in a long time.

Eventually (once I’ve isolated RNA from the control set that corresponds to these heat shock samples), I’ll check for gDNA carryover and then, probably, DNase the RNA.

DNA Quantification – Claire’s C.gigas Sheared DNA

In an attempt to obtain the most accurate measurement of Claire’s sheared, heat shock mantle DNA, I quantified the samples using a third method: fluorescence.

Samples were quantified using the Quant-It DNA BR Kit (Life Technologies/Invitrogen) according the manufacturer’s protocol. Standards were run in triplicate. Due to low sample volumes, only 1μL of each sample was used and was not replicated.

Plate was read on a Perkin Elmer plate reader using the Wallac software. The plate was measured three times, with each well measured for a one second duration on each read.


Results:

Spreadsheet: 20150303_gigasHSshearedDNApico


Comparison of NanoDrop1000, Bioanalyzer, and fluorescence measurements:

Sample NanoDrop (ng/μL) Bioanalyzer (ng/μL) Fluorescence (ng/μL)
2M sheared 48.03 16.28 4.91
4M sheared 190.96 58.52 48.10
6M sheared 141.56 42.98 28.42
2MHS sheared 221.93 32.45 13.48
4MHS sheared 257.48 43.82 11.75
6MHS sheared 202.02 51.12 8.97


Not entirely surprising, but the fluorescence method is clearly the most conservative measurement of the three methods. However, I do find the difference between the Bioanalyzer and fluorescence measurements very surprising. I suspected the Bioanalyzer would underestimate the concentrations because I actively selected which peak regions to measure, possibly leaving out some aspect of the sample.

Regardless, will use the most conservative measurements (fluorescence) for decision making.

With our yields, we have insufficient DNA to conduct MeDIP and then subsequent bisulfite conversion and library prep on our own. The recovery from the MeDIP will result in too little input DNA for bisulfite conversion and, in turn, library prep.

However, we do have sufficient quantities of starting DNA (>200ng) for Epigentek’s MeDIP Methyl-seq. I have contacted Epigentek to see if their procedure includes bisulfite conversion after MeDIP (which the website workflow suggests that it does not).

DNA Quantification – Claire’s Sheared C.gigas Mantle Heat Shock Samples

I previously checked Claire’s sheared DNA on the Bioanalyzer to verify the fragment size and to quantify the samples. Looking at her notebook, her numbers differ greatly from the Bioanalyzer, possibly due to the fact that the DNA1000 assay chip used only measures DNA fragments up to 1000bp in size. If her shearing was incomplete, then there would be DNA fragments larger than 1000bp that wouldn’t have been measured by the Bioanalyzer. So, I decided to quantify the samples on the NanoDrop1000 (ThermoFisher) again.


Results:

Spreadsheet: 20150226_Claire_sheared_Emma_1000ppm_OD260s


Comparison of NanoDrop1000 and Bioanalyzer measurements.

Sample NanoDrop (ng/μL) Bioanalyzer (ng/μL)
2M sheared 48.03 16.28
4M sheared 190.96 58.52
6M sheared 141.56 42.98
2MHS sheared 221.93 32.45
4MHS sheared 257.48 43.82
6MHS sheared 202.02 51.12

The NanoDrop is known to overestimate sample quantities due to the indiscriminate nature of UV spectrophotometry and that could be the reason for the large discrepancy between the two measurements (i.e. RNA carryover may lead to overestimation). As such, I’ll quantify the samples using a fluorescence-based assay for double stranded DNA tomorrow in hopes of getting the most accurate measurement.

Bioanalyzer – C.gigas Sheared DNA from 20140108

To complement MBD ChiP-seq data and RNA-seq data that we have from this experiment, we want to generate, at a minimum, some BS-seq data from the same C.gigas individuals used for the other aspects of this experiment.  Claire had previously isolated DNA and sheared the DNA on 20140108. If possible, we’d like to perform MBD enrichment, but the current quantities of DNA may prevent us from this.

To quantify the DNA and evaluate the shearing profile, I ran 1μL of each of the following mantle pre-/post-heat shock samples on a DNA 1000 chip (Agilent) on the Agilent 2100 Bioanalyzer. in the Seeb Lab:

M = mantle
HS = heat shocked

  • 2M sheared
  • 4M sheared
  • 6M sheared
  • 2M HS sheared
  • 4M HS sheared
  • 6M HS sheared

Results:

Bioanalyzer Data File (XAD): 2100_expert_DNA_1000_DE72902486_2015-02-19_11-32-35(2).xad


Electropherograms

2100 Bioanalyzer electropherograms of Claire’s sheared C.gigas DNA.


Spreadsheet: 2100 expert_DNA 1000_DE72902486_2015-02-19_11-32-35_Results_001


Claire’s notebook entry doesn’t ever specify what her target shear size was, but the Bioanalyzer analysis suggests an average size of ~500bp.

Also interesting to note is that Claire’s sample concentrations (as measured on the NanoDrop1000) are significantly greater than what is calculated by the Bioanalyzer. Since the Bioanalyzer chip used (DNA1000) only goes to 1000bp, is it possible the differences in concentrations is due to incomplete shearing of the samples (e.g. a significant portion of the DNA is >1000bp in size and thus not factored in to the Bioanlyzer concentrations calculations)?

Will check sample volumes and determine total amount of remaining DNA for each sample and then assess how to proceed next (i.e. MBD or just BS-seq).

UPDATE 20150226:

Sample volumes were measured and total quantity (ng) of DNA in each sample were added to the spreadsheet above.

Based on the quantities of DNA we have for each sample, will discuss sequencing options (e.g. MBD or not, self-prepare libraries or not, etc) with Steven.