NanoDrop1000 Comparison – Roberts vs. Young Lab

Due to an apparent reduction in assay sensitivity for the Hematodidium qPCR assay, we have decided to determine if the spec readings of the plasmid DNA being used for the standard curves are accurate. Used C.gigas gDNA and the lambda DNA Standard (100ng/uL) included in the Quant-iT PicoGreen dsDNA Assay Kit (Invitrogen) that was marked as received 9/1/10. Tested both the Roberts Lab and Young Lab using these DNAs. At least 6 separate measurements were taken of each DNA on each machine. Samples were briefly mixed by flicking the tube 4-5 times prior to each measurement.

Results:

Spreadsheet containing absorbance data and calculations of average concentration and standard deviation for both DNA samples on both machines is here.

A quick table of the results:

Roberts Lab Young Lab
[Avg. gDNA] (ng/uL) 45.656 51.778
Std Dev gDNA 0.2377 0.5825
[Avg. lambda DNA] (ng/uL) 76.01 90.255
Std Dev lambda DNA 3.826 0.9342

The first thing to notice is that the lambda DNA that has been used for standard curves does not have the expected concentration (100ng/uL) on either of the machines. It seems unlikely that BOTH NanoDrop1000s are incorrectly calibrated (which could be a possible explanation for why the lambda DNA is not matching the expected 100ng/uL). This is also supported by recent curves done on the Friedman Lab plate reader using this DNA by Lisa, Vanessa and Elene (data not shown). It’s also interesting to note that the lambda DNA also shows a greater standard deviation (on both machines) than the other DNA (gDNA) used in this test. This is surprising as one would expect a store-bought reagent to be of the highest quality, particularly since it is supposed to be used for DNA quantification. However, it should also be remembered that this DNA is over a year old and has never been aliquoted. As such, it has gone through an extremely high number of freeze/thaw cycles which could have an impact on the long-term quality of the DNA.

The second thing to notice is that the Roberts Lab and Young Lab machines provide different concentrations of each of the two DNAs. Unfortunately, due to the fact that the lambda DNA concentration is not as expected (100ng/uL) on either machine it is impossible to determine which machine is more accurate. However, it appears that the Young Lab NanoDrop1000, overall, is more consistently precise in its readings than the Roberts Lab NanoDrop1000. Of course, both machines do seem to be sufficiently precise that precision shouldn’t be a concern.

I’ve notified Lisa of the potentially inaccurate readings of the lambda DNA. She has ordered a fresh set of DNA standards that will be used to test both machines to help assess their accuracy.

qPCR – Test Young Lab qPCR Calibration (Repeat)

This was repeated from earlier today due to the failure of the previous run, but had to use new gDNA since I ran out of the stock I had previously used. Master mix calcs and cycling params are here.

Results:

Amplification in all wells, however well E4 appears to have had some evaporation (and the effects can clearly be seen in the amplification plot below). Still getting ~3 cycle spread across the entire plate, which is disconcerting. Oddly, this is the second day where the 1st run completely failed, but the 2nd run was successful…

PCR – New C. gigas COX Primers for Sequencing of Isoforms

Used new primers for obtaining bands for additional sequencing of both COX isoforms in C. gigas. Master mix calcs are here. Master mix shorthand (MM##) is described below:

MM07 – Cg_COX_416_F (SR ID: 1193) + Cg_COX1_qPCR_R (SR ID: 1191) Expected band size (if no intron) = ~1540bp

MM08 – Cg_COX_416_F (SR ID: 1193) + Cg_COX2_454align1_R (SR ID: 1190) Expected band size (if no intron) = ~1540bp

MM09 – Cg_COX1/2_qPCR_F (SR ID: 1192) + Cg_COX1_qPCR_R (SR ID: 1191) Expected band size (if no intron) = ~225bp

MM10 – Cg_COX1/2_qPCR_F (SR ID: 1192) + Cg_COX2_454align1_R (SR ID: 1190) Expected band size (if no intron) = ~225bp

MM11 – Cg_COX_1519_F (SR ID: 1146) + Cg_COX2_454align1_R (SR ID: 1190) Expected band size (if no intron) = ~275bp

MM12 – Cg_COX_982_F (SR ID: 1151) + Cg_COX2_454align1_R (SR ID: 1190) Expected band size (if no intron) = ~812bp

Results:

Ladder is Hyperladder I from Bioline.

Master mixes are indicated underneath each group by the labels MM##. The order within each MM group (from left to right) is: template, NTC, NTC.

All bands boxed with green were purified using Millipore’s Ultrafree-DA spin columns. Samples were stored @ -20C in “Sam’s Misc. -20C Box”.

MM07 – Fails to produce any bands of any size. Suggests the presence of intron(s) causing the size of the potential amplicon to exceed the capabilities of the polymerase under these cycling conditions.

MM08 – Produces a band of ~400bp which is well below the expected 1540bp (if no introns) size. Due to the faintness of the band, the band was not excised. Will consult with Steven to see if he thinks it worth repeating to produce sufficient product for sequencing.

MM09 – Produce a ~500bp band. The band was excised. This band size is ~275bp larger than the expected size of 225bp. This implies the presence of an intron in this region. This band size differs from that produced by MM10, which suggests that this primer set can be used for qPCR AND distinguish between the COX1 and COX2 isoforms.

MM10 – Produced a ~700bp band. The band was excised. This band size is ~475bp larger than the expected size of 225bp. This implies the presence of an intron in this region. This band size differs from that produced by MM09, which suggests that this primer set can be used for qPCR AND distinguish between the COX1 and COX2 isoforms.

MM11 – Produced multiple bands, of which two were excised; a ~3000bp band and a ~600bp band. These bands were excised solely based on their intensity and their immediate useability for sequencing. Will discuss with Steven on whether or not this should be repeated and the other bands excised for sequencing purposes. Both bands that were excised exceed the expected band size of ~275bp, suggesting the presence of multiple introns. Additionally, the presence of so many products suggests that the primers are not very specific, in regards to their target.

MM12 – An extremely faint band of ~350bp can be seen, however, due to it’s faintness and it’s small size (expected size was ~812bp), the band was not excised. Will discuss with Steven to see if this warrants repeating to accumulate sufficient product for sequencing purposes. No amplification of any larger products suggests the presence of introns, causing the size of the potential amplicon to exceed the capabilities of the polymerase under these cycling conditions. This is also confirmed by the MM11 PCR results in which a 3000bp band was produced. Since the primer set in MM12 has an additional 600bp at the 5′ end, this has already exceeded the abilities of the polymerase, even if this addtional 600bp does NOT include an additional intron. However, it is curious that the MM12 primer set does not produce smaller, spurious PCR products as is seen in the MM11 primer set (these two primer sets both use the same forward primer).

qPCR – Test Young Lab qPCR Calibration (Repeat)

This is a repeat of a run from 20110204. Here’re master mix calcs. This was being repeated to evaluate whether or not the relative differences in Ct values observed on 20110204 are consistent or not across the plate. Cycling params were as follows:

  • 95C – 10min

40 Cycles of:

  • 95C – 15s
  • 55C – 30s
  • 72C – 1m

Melt curve.

Results:

Absolutely no amplification of any kind! Bizarre. Will repeat.

qPCR – Test Young Lab qPCR Calibration (Repeat)

This is a repeat of an earlier run from today, but with a different qPCR plate. Here’re master mix calcs (bottom half of page). Cycling params were as follows:

  • 95C – 10min

40 Cycles of:

  • 95C – 15s
  • 55C – 30s
  • 72C – 1m

Melt curve.

Results:

All samples amplified and showed a proper dissociation curve. However, it does look like there’s a spread of ~3 Cts across the plate. This is not good, as this is the equivalent of ~10-fold difference in gene expression. Will repeat again and see if specific wells show the same relative differences in Cts.

qPCR – Test Young Lab qPCR Calibration

Recently, the Young Lab’s ABI 7300 qPCR machine was calibrated. Steven asked me to run a plate and see how well the calibration worked. Ran a plate with C.gigas gDNA and Gigas 18s primers (SR ID: 156 and 157) that are known to amplify gDNA. Master mix calcs are here (top half of page). Cycling params were as follows:

  • 95C – 10min

40 Cycles of:

  • 95C – 15s
  • 55C – 30s
  • 72C – 30s

Melt curve.

Results:

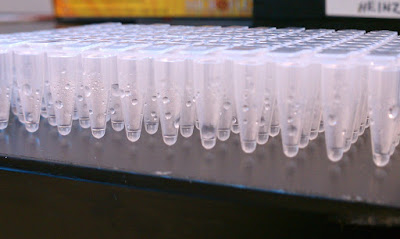
Absolutely no amplification of any kind. However, I did use one of our conventional PCR plates and not one of the ABI “prism” plates. Additionally, when I removed the plate from the machine, the plate looked as though it had been vigorously shaken:

Will repeat this qPCR with a proper ABI “prism” plate.

Genomic PCR – Repeat of C.gigas COX genomic PCR from 20110118

This was repeated to generate more PCR product for sequencing purposes. PCR master mix calcs and cycling params are here. Master mixes 04 and 05 (MM04 and MM05) were repeated to gain more PCR product from the faint 550bp & 1500bp bands(MM04) and 5000bp band (MM05).

MM04 – Cg_COX_982_F (SR ID: 1151) + Cg_COX_1545_R (SR ID: 1148) Band size w/o intron = ~550bp

MM05 – Cg_COX_982_F (SR ID: 1151) + Cg_COX_2138_R (SR ID: 1149) Band size w/o intron = ~1130bp

Results:

Gel was run on 20110203

Samples on the left portion of the gel are from the MM04 primer combo and those on the right are from the MM05. Boxed bands were excised, purified using Millipore Ultra DA-free spin columns and stored @ -20C in Sam’s “Misc. -20C Box.”

Interestingly in the MM05 set, inconsistent, faint bands of ~400-500bp are visible. These were not visible the first time this PCR was conducted (see 20110118), but the exposure of the gel image wasn’t turned up as high as in this image. Due to their inconsistency and extremely low yield, these bands were not excised.

DNase – DNase C.gigas RNA from 20110120, 20110121 and 20110124

5ug of RNA was DNased using Ambion’s Turbo DNA-free kit, following the rigorous protocol (0.5uL of DNase for 30 mins then additional 0.5uL of DNase for 30mins). Calcs for DNase reactions are here. RNA was stored @ -80C in Shellfish RNA Boxes 4 and 5. Samples will be spec’d on Monday.

Results:

Overall, the RNA looks really good (based on OD 260/280 numbers). Not surprisingly, the OD 260/230 values for all samples dropped, likely due to the addition of the buffer (salts) used in the DNase reaction. Emma says she will check these samples for residual DNA.

–UPDATE (20110131)– Emma checked all DNased RNA samples on 20110131 using C.gigas 18s primers (SR ID: ?). She has not listed the results of the whether or not all samples are clean or if some still have residual gDNA carryover.

–UDPATE (20110201– Samples that appear to have residual gDNA carryover based on Emma’s qPCR on 20110131: Muscle C6, Gill 1hr C2 & E2.

RNA Isolation – Various C.gigas Tissue from 20110111

RNA was isolated in 1mL TriReagent, according to protocol. Samples were resuspended in 50uL 0.1% DEPC-H2O and spec’d. RNA was stored @ -80C in “Shellfish RNA Box #4

Results:

RNA looks OK. Not surprising, but mantle and Dg/Gonad tissues ended up with poor OD260/230 ratios. This has been observed in the past with these tissue types.

RNA Isolation – Various C.gigas Tissue from 20110111

RNA was isolated in 1mL TriReagent, according to protocol. Samples were resuspended in 50uL 0.1% DEPC-H2O and spec’d. RNA was stored @ -80C in “Shellfish RNA Box #4“.

Results:

Overall, all RNA looks very good (based on 260/280 and 260/230 values).