Yesterday’s test scale PCR failed to produce any bands in any samples (expected size of ~166bp). This is not particularly surprising, due to the level of degradation in these samples. As such, repeated the test scale PCR, but increased the number of cycles.
Following the Meyer Lab 2bRAD protocol.
I ran PCR reactions on a the same subset of samples as yesterday (Sample #: 4, 7, 14, & 30).
PCR reactions were set up on ice in 0.5mL PCR tubes.
| REAGENT | SINGLE REACTION (μL) | x4.4 |
| Template | 8 | NA |
| NanoPure H2O | 1 | 4.4 |
| dNTPs (1mM) | 4 | 17.6 |
| ILL-LIB1 (10μM) | 0.4 | 1.76 |
| ILL-LIB2 (10μM) | 0.4 | 1.76 |
| ILL-HT1 (1μM) | 1 | 4.4 |
| ILL-BC1 (1μM) | 1 | 4.4 |
| 5x Q5 Reaction Buffer | 4 | 17.6 |
| Q5 DNA Polymerase | 0.2 | 0.88 |
| TOTAL | 20 | 52.8 |
Combined 12μL of master mix with 8μL of the ligation reaction from yesterday.
Cycling was performed on a PTC-200 (MJ Research) with a heated lid:
| STEP | TEMP (C) | TIME (s) |
| Initial Denaturation |
|
|
| 42 cycles |
|
|
We’re following the “1/4 reduced representation” aspect of the protocol. As such, 5μL of each reaction was pulled immediately after the extension (72C – machine was paused) of cycles 27, 32, 37, & 42 in order to determine the ideal number of cycles to use. Also ran the ligation reactions (labelled “ligations” on the gel below) of two samples (samples #: 14 & 30) as a pre-PCR comparison.
These samples were run on a 1x modified TAE 2% agarose gel (w/EtBr).
Results:
NOTE: Today’s gel image was taken with a proper gel imager (yesterday’s gel image was captured with my phone). The 27 cycles appears similar to yesterday’s results, even though the bands are not visible on yesterdays’ gel, due to limitations of the phone’s camera sensitivity.
There are a number of bands visible on this gel.
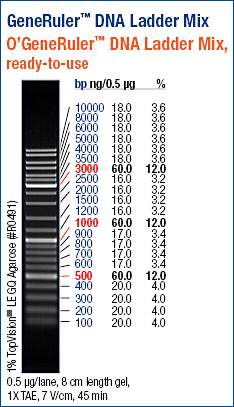
The green arrow on the image identifies what I believe to be the proper size band (~160bp). This band is present in all four cycling groups and at similar intensities across cycling groups.
The two lower molecular weight bands are very likely primer dimers. The Meyer Lab Protocol indicates that primer dimers will likely be present at ~70bp, ~90bp, & ~133bp.
Since we’ve been following along with Katherine Silliman’s 2bRAD progress, here’s an image of her test scale PCR to compare to ours:

Katherine’s test scale PCR. Notice how much more prominent her bands are in all cycle groups, compared to my gel above.
Since this is my first foray into RAD-seq QC, I’m not certain whether or not our test scale PCRs indicate any level of success. I will consult with Katherine and Steven about what they think. Since we’re on a timeline, and we’re just testing the viability of this whole process, I suspect Steven will have me proceed and see how things turnout.


It doesn’t look good. In the Matz 2b rad protocol, they recommend keeping cycles below 15 otherwise you see a loss in heterozygosity.
https://github.com/z0on/2bRAD_GATK/blob/master/2bRAD_protocol_aug25_2014_nnrw.pdf
If the pCR isn’t working, then it’s because there aren’t many fragments with adaptors. The Matz protocol has an overnight ligation, so maybe try that?
Thanks for looking at this and thanks for passing along the Matz protocol! Will definitely give that a read-through.