Continuing the quest for the ideal kmer size to use for our geoduck assembly.
The previous two runs with kmergenie using the diploid setting were no good.
So, this time, I simply increased the maximum kmer size to 301 and left all other settings as default. I’m hoping this is large enough to produce a smooth curve, with a maximal value that can be determined from the output graph.
The job was run on our Mox HPC node.
- Slurm script: 20180421_kmergenie_k301_geoduck_slurm.sh
Results:
Output folder:
Slurm output file:
Kmer histogram (HTML) reports:
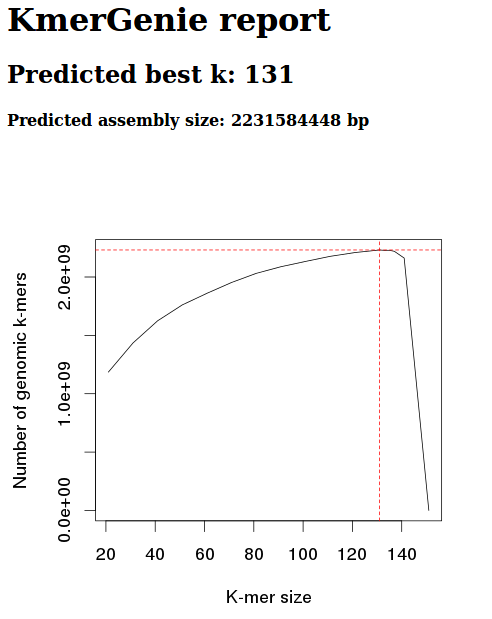
Well, the graph is closer to what we’d expect, in that it appears to reach a zenith, but after that plateau, we see a sharp dropoff, as opposed to a gradual dropoff that mirrors the left half. Not entirely sure what the implications for this are, but I’ll go ahead an run SparseAssembler using a kmer size of 131 and see how it goes.
One comment