Tag Archives: water filter

DNA Isolation & Quantification – Metagenomics Water Filters

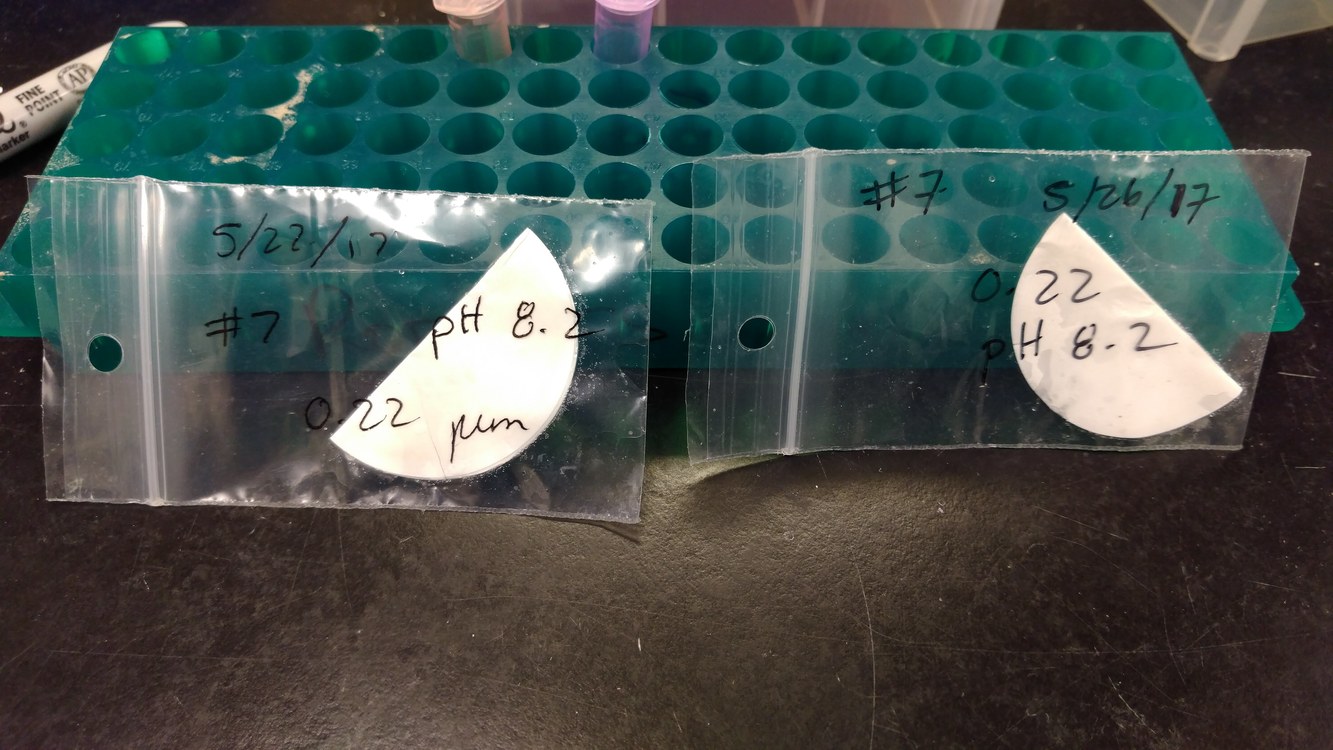
Isolated DNA from the following two filters:

DNA was isolated with the DNeasy Blood & Tissue Kit (Qiagen), following a modified version of the Gram-Positive Bacteria protocol:

  • filters were unfolded and unceremoniously stuffed into 1.7mL snap cap tubes
  • did not perform enzymatic lysis step
  • filters were incubated with 400μL of Buffer AL and 50μL of Proteinase K (both are double the volumes listed in the kit and are necessary to fully coat the filter in a 1.7mL snap cap tube)
  • 56oC incubations were performed overnight
  • 400μL of 100% ethanol was added to each after the 56oC incubation
  • samples were eluted in 50μL of Buffer AE
  • all spins were performed at 20,000g

Samples were quantified with the Roberts Lab Qubit 3.0 and the Qubit 1x dsDNA HS Assay Kit.

Used 10μL of each sample for measurement (see Results for update).

Results:

Raw data (Google Sheet): 20180411_qubit_metagenomics_filters

Sample Concentration(ng/μL) Initial_volume(μL) Yield(ng)
filter 5/22 #7 pH8.2 20.8 50 1040
filter 5/26 #7 pH8.2 11.6 50 580

NOTE: For “filter 5/22 #7 pH8.2″ the initial quantification using 10μL ended up being too concentrated. Re-ran using 5μL.

Both samples have yielded DNA. This is, obviously, an improvement over the previous attempts to isolate DNA from ammonium bicarbonate filter rinses that Emma supplied me with.

Will discuss with Steven and get an idea of which filters to isolate additional DNA from.

Samples were stored Sam gDNA Box #2, positions G6 & G7. (FTR 213, #27 (small -20oC frezer)

qPCR – Taylor Water Filter DNA Extracts from 20120322

Ran qPCR on the Taylor water filter DNA extracts from 20120322 using V.tubiashii VtpA primers (provide by Elene; no SR ID?) instead of 16s primers, which failed to produce acceptable results in the melt curves (see 20120323). Additionally, Elene has a standard curve for V. tubiashii (from 1/12/2011) based off of CFUs/mL, which will allow us to quantify theoretical number of V.tubiashii CFUs present in each sample.

Master mix calcs are here. Plate layout, cycling params, etc. can be found in the qPCR Report (see Results).

Results:

qPCR Date File (CFX96)

qPCR Report (PDF)

Overall, the run looks excellent. Both negative controls and no template controls are clean. Since I was able to use a standard curve, I determined CFUs of V.tubiashii in each sample, as follows:

Mean CFUs per qPCR reaction / template volume per qPCR reaction x filter extraction elution volume (100uL) = total CFUs on water filter.

Total CFUs on filter / filtered water volume = CFUs per mL in Taylor tanks

158 – 16500 copies/2uL = 8250 copies/uL x 100uL = 825000 copies on water filter/1000mL = 825 copies/mL

200 – 5700 copies/2uL = 2850 copies/uL x 100uL = 285000 copies on water filter/1000mL = 285 copies/mL

279 – 325000 copies/2uL = 162500 copies/uL x 100uL = 16250000 copies on water filter/1000mL = 16250 copies/mL

313 – 152 copies/2uL = 76 copies/uL x 100uL = 7600 copies on water filter/1000mL = 7.6 copies/mL

341 – 124000/2uL = 62000 copies/uL x 100uL = 6200000 copies on water filter/1000mL = 6200 copies/mL

410 – 132000/2uL = 66000 copies/uL x 100uL = 6600000 copies on water filter/1000mL = 6600 copies/mL

433 – 63700/2uL = 31850 copies/uL x 100uL = 3185000 copies on water filter/1000mL = 3185 copies/mL

503 – 110/2uL = 55 copies/uL x 100uL = 5500 copies on water filter/1000mL = 5.5 copies/mL

551 – 2000/2uL = 1000 copies/uL x 100uL = 100000 copies on water filter/1000mL = 100 copies/mL

604 – 272/2uL = 136 copies/uL x 100uL = 13600 copies on water filter/1000mL = 13.6 copies/mL

Sample #410 was from the only tank that exhibited mortalities and was the only group of oyster larvae that showed any expression from the V.tubiashii genes (see DATE).

qPCR – Repeat of qPCR from Earlier Today

Repeated exactly what was done earlier today due to apparent contamination in negative controls.

Results:

qPCR Date File (CFX96)

qPCR Report (PDF)

Essentially the same results as the previous run. No template controls do amplify, but EXTREMELY weak and late. Melt curve analysis shows that the signals for the no template controls don’t cross the threshold set by the software.

However, I just looked back at the qPCR results from 20120208 where I used these V. tubiashii 16s primers and realized I got the same results from the cDNA (double-peaks in melt curves and amplification in the no template controls)!! So, I suspect that this primer set isn’t that useful. Will have to examine other sets of V. tubiashii 16s primers to use. Will discuss with Steven.

qPCR – Taylor Water Filter DNA Extracts from Yesterday

Ran qPCR on the Taylor water filter DNA extracts from yesterday using V.tubiashii 16s primers (SR IDs: 455, 456). Used RE22 DNA as a positive control, provided by Elene. Master mix calcs are here. All samples were run in duplicate. Plate layout, cycling params, etc can be found in the qPCR Report (see Results).

Results:

qPCR Data File (CFX96)

qPCR Report (PDF)

All samples amplified, including the negative controls. Negative controls exhibited very weak, late amplification. Additionally, many of the samples have a “shoulder” or apparent double-peak present in the melt curves. Will repeat to see if I can eliminate amplification in negative control samples.

DNA Extraction – Taylor Water Filter Samples from 2011

Extracted DNA from the following water filter samples using the Qiagen DNeasy Blood & Tissue Kit:

  • 158
  • 200
  • 279
  • 313
  • 341
  • 410
  • 433
  • 503
  • 551
  • 604

Filters were cut into ~13 pieces and placed in 1.5mL snap cap tubes containing 50uL of Proteinase K and 400uL of Buffer AL. Samples were incubated O/N @ 56C. Tubes were spun @ 16,000g @ RT for 2mins. 400uL of 100% EtOH was added to each tube and vortexed. Tubes were spun @ 16,000g @ RT for 2mins. Supe was transferred to Qiagen column. Qiagen protocol was followed from this point on. Samples were eluted with 100uL of Buffer AE and stored @ 4C.