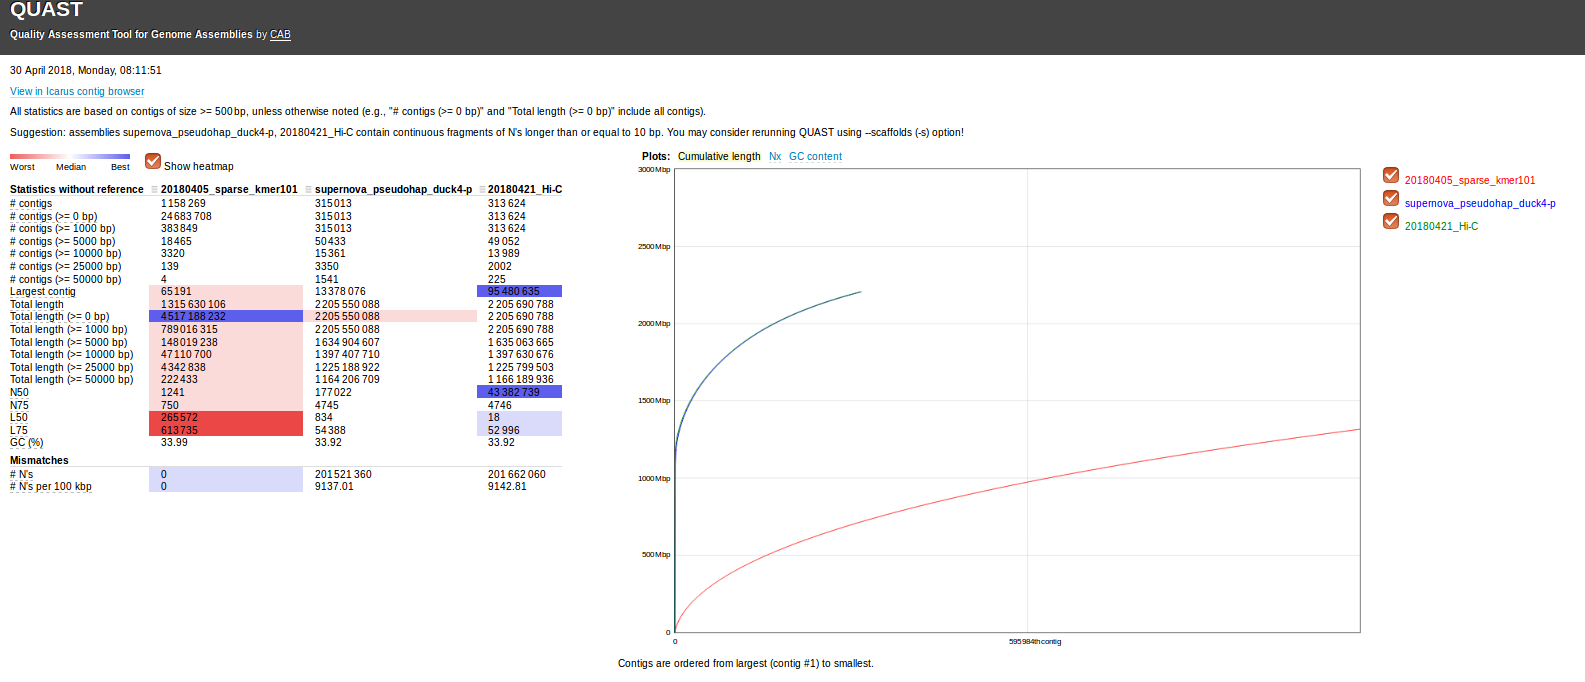
Steven requested a comparison of geoduck genome assemblies.
Ran the following Quast command:
/home/sam/software/quast-4.5/quast.py \
-t 24 \
--labels 20180405_sparse_kmer101,supernova_pseudohap_duck4-p,20180421_Hi-C \
/mnt/owl/Athaliana/20180405_sparseassembler_kmer101_geoduck/Contigs.txt \
/mnt/owl//halfshell/bu-mox/analyses/0305b/duck4-p.fasta.gz \
/mnt/owl/Athaliana/20180419_geoduck_hi-c/Results/geoduck_roberts\ results\ 2018-04-21\ 18\:09\:04.514704/PGA_assembly.fasta
Results:
Quast output folder: results_2018_04_30_08_00_42/
Quast report (HTML): results_2018_04_30_08_00_42/report.html

The data’s pretty interesting and cool!
SparseAssembler has over 2x the amount of data (in bas pairs), yet produces the worst assembly.
SuperNova and Hi-C assemblies are very close in nearly all categories. This isn’t surprising, as the SuperNova assembly was used as a reference assembly for the Hi-C assembly.
However, the Hi-C assembly is insanely better than the SuperNova assembly! For example:
- Largest contig is ~7x larger than the SuperNova assembly.
- The N50 size is ~243x larger than the SuperNova assembly!!
- L50 is only 18, 46x smaller than the SuperNova assembly!
This is pretty amazing, honestly. Even more amazing is that this data was sent over to us as some “preliminary” data for us to take a peak at!