DNA Isolation – Geoduck & Olympia Oyster

Amazingly, we need more gDNA for the two genome sequencing projects (geoduck and Olympia oyster). Used geoduck “foot 1″ sample from Box 1 of the foot samples collected by Brent & Steven on 20150811. Used Olympia oyster adductor muscle from Box 1 of adductor muscle sample collected by Brent & Steven on 20150812.

Also need to evaluate DNA quality of initial broodstock samples from Jake’s Olympia oyster reciprocal transplant experiment. Used mantle samples stored in EtOH collected by Hannah (see her notebook entries on July 25 & Sept 5, 2013)

Tissue weights:

  • Geoduck foot: 108.5mg (gone)
  • Olympia oyster adductor: 258.7mg (gone)
  • Oly NF1A: 7.1mg (gone)
  • Oly SN49A: 20.8mg


Samples were isolated using DNAzol (Molecular Research Center) according to the manufacturer’s protocol, with the following adjustments:


  • Tissues homogenized in 750μL of DNAzol with disposable mortar/pestle tubes using 10 pestle strokes
  • After homogenization, topped off tubes to 960μL with DNAzol, added 40μL RNAse A (100mg/mL) and incubated @ RT for 15mins.
  • Performed optional centrifugation step (10,000g, 10mins @ RT)
  • Initial pellet wash was performed using a 70%/30% DNAzol/EtOH
  • Pellets were resuspended Buffer EB (Qiagen)
  • Insoluble material was pelleted (12,000g, 10mins @ RT) and supe transferred to new tubes


Genome sequencing resuspension volumes: 50μL

Oly reciprocoal resuspension volumes: 25μL

Spec’d on Roberts Lab NanoDrop1000.

Results:


Genome Sequencing Samples

The 260/280 ratios look fine. The 260/230 ratios look poor, as is usually the case after DNAzol isolations.

Yields:

Geoduck: 7.6μg

Oly: 16.5μg

The geoduck yield is insufficient to make up the quantity of gDNA still needed by BGI for sequencing. Will have to isolate more gDNA on Monday.


Reciprocal Transplant Samples

The 260/280 ratios look fine. The 260/230 ratios look poor, as is usually the case after DNAzol isolations.

Yields:

NF1A: 7,1μg

SN49A: 1.375μg

The yields are surprisingly good! Next up is to evaluate the gDNA quality on a gel to see if the samples from this experiment will be usable.
PCR – Oly RAD-seq Test-scale PCR

Yesterday’s test scale PCR failed to produce any bands in any samples (expected size of ~166bp). This is not particularly surprising, due to the level of degradation in these samples. As such, repeated the test scale PCR, but increased the number of cycles.

Following the Meyer Lab 2bRAD protocol.

I ran PCR reactions on a the same subset of samples as yesterday (Sample #: 4, 7, 14, & 30).

PCR reactions were set up on ice in 0.5mL PCR tubes.

REAGENT SINGLE REACTION (μL) x4.4
Template 8 NA
NanoPure H2O 1 4.4
dNTPs (1mM) 4 17.6
ILL-LIB1 (10μM) 0.4 1.76
ILL-LIB2 (10μM) 0.4 1.76
ILL-HT1 (1μM) 1 4.4
ILL-BC1 (1μM) 1 4.4
5x Q5 Reaction Buffer 4 17.6
Q5 DNA Polymerase 0.2 0.88
TOTAL 20 52.8


Combined 12μL of master mix with 8μL of the ligation reaction from yesterday.

Cycling was performed on a PTC-200 (MJ Research) with a heated lid:

STEP TEMP (C) TIME (s)
Initial Denaturation
  • 98
  • 30
42 cycles
  • 98
  • 60
  • 72
  • 5
  • 20
  • 10

We’re following the “1/4 reduced representation” aspect of the protocol. As such, 5μL of each reaction was pulled immediately after the extension (72C – machine was paused) of cycles 27, 32, 37, & 42 in order to determine the ideal number of cycles to use. Also ran the ligation reactions (labelled “ligations” on the gel below) of two samples (samples #: 14 & 30) as a pre-PCR comparison.

These samples were run on a 1x modified TAE 2% agarose gel (w/EtBr).

Results:


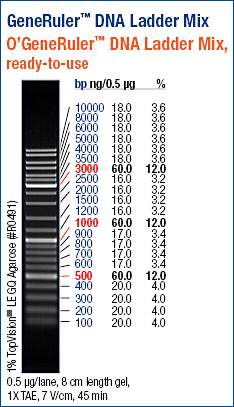
NOTE: Today’s gel image was taken with a proper gel imager (yesterday’s gel image was captured with my phone). The 27 cycles appears similar to yesterday’s results, even though the bands are not visible on yesterdays’ gel, due to limitations of the phone’s camera sensitivity.

There are a number of bands visible on this gel.

The green arrow on the image identifies what I believe to be the proper size band (~160bp). This band is present in all four cycling groups and at similar intensities across cycling groups.

The two lower molecular weight bands are very likely primer dimers. The Meyer Lab Protocol indicates that primer dimers will likely be present at ~70bp, ~90bp, & ~133bp.

Since we’ve been following along with Katherine Silliman’s 2bRAD progress, here’s an image of her test scale PCR to compare to ours:

Katherine’s test scale PCR. Notice how much more prominent her bands are in all cycle groups, compared to my gel above.


Since this is my first foray into RAD-seq QC, I’m not certain whether or not our test scale PCRs indicate any level of success. I will consult with Katherine and Steven about what they think. Since we’re on a timeline, and we’re just testing the viability of this whole process, I suspect Steven will have me proceed and see how things turnout.

PCR – Oly RAD-seq Test-scale PCR

Continuing with the RAD-seq library prep. Following the Meyer Lab 2bRAD protocol.

Prior to generating full-blown libraries, we need to run a “test-scale” PCR to identify the minimum number of cycles needed to produce the intended product size (166bp).

I ran PCR reactions on a subset (Sample #: 4, 7, 14, & 30) of the 10 samples that I performed adaptor ligations on earlier today.

All components were stored on ice.

dNTPs – 1mM working stock was made

  • 10μL dNTPs (10mM)
  • 90μL NanoPure H2O


ILL-LIB1 & 2 – 10μM working stocks were made

  • 10μL ILL-LIB1 or -LIB2 (100μM)
  • 90μL NanoPure H2O


ILL-HT1 & 2 – 1μM working stocks were made

  • 1μL ILL-HT1 or -HT2 (100μM)
  • 99μL NanoPure H2O


ILL-BC1 – 1μM working stock was made

  • 1μL ILL-BC1 (100μM)
  • 99μL NanoPure H2O


PCR reactions were set up on ice in 0.5mL PCR tubes.

REAGENT SINGLE REACTION (μL) x4.4
Template 8 NA
NanoPure H2O 1 4.4
dNTPs (1mM) 4 17.6
ILL-LIB1 (10μM) 0.4 1.76
ILL-LIB2 (10μM) 0.4 1.76
ILL-HT1 (1μM) 1 4.4
ILL-BC1 (1μM) 1 4.4
5x Q5 Reaction Buffer 4 17.6
Q5 DNA Polymerase 0.2 0.88
TOTAL 20 52.8


Combined 12μL of master mix with 8μL of the ligation reaction from earlier today.

Cycling was performed on a PTC-200 (MJ Research) with a heated lid:

STEP TEMP (C) TIME (s)
Initial Denaturation
  • 98
  • 30
27 cycles
  • 98
  • 60
  • 72
  • 5
  • 20
  • 10

We’re following the “1/4 reduced representation” aspect of the protocol. As such, 5μL of each reaction was pulled immediately after the extension (72C – machine was paused) of cycles 12, 17, 22, & 27 in order to determine the ideal number of cycles to use. Also ran the ligation reactions (labelled “Digests” on the gel below) of two samples (samples #: 4 & 7) as a pre-PCR comparison.

These samples were run on a 1x modified TAE 2% agarose gel (w/EtBr).


Results:


The results aren’t great. No band(s) visible in any samples at even the highest cycle number (27 cycles). Although, if you squint pretty hard, an extremely faint band might be visible in between the 100/200bp markers in the 27 cycles group.

Regardless, the PCRs will need to be repeated with an increased number of cycles. This is not terribly surprising, as the Meyer Lab protocol indicates that degraded samples will likely need a greater number of cycles than what they recommend and that cycle number will have to be determined empirically.


Adaptor Ligation – Oly AlfI-Digested gDNA for RAD-seq

Yesterday’s AlfI over night restriction digest was heat inactivated by heating @ 65C for 10mins. Samples were stored on ice.

Continued to follow  the 2bRAD protocol (PDF) developed by Eli Meyer’s lab.

Digested DNA was not run out on a gel due to the fact that the input gDNA was degraded and a shift in the high molecular weight band (indicating the digestion was successful) would not exist because a high molecular weight band is absent in these samples.

The following oligos were reconstituted in TE buffer (pH = 8.0) to 100μM:

  • 3ILL-NR
  • 5ILL-NR
  • anti-ILL
  • ILL-BC1 (Barcode sequence: CGTGAT)
  • ILL-HT1 (Barcode sequence: ATGCAT)
  • ILL-HT2 (Barcode sequence: CGTACG)
  • ILL-LIB1
  • ILL-LIB2

Anneal Adaptors

After preparing the two adaptors below, they were incubated for 10mins @ RT:

  • Adaptor 1 (2μM final concentration of each oligo): 1.5μL of 5ILL-NR (100μM) + 1.5μL of anti-ILL (100μM) + 72μL H2O = 75μL total
  • Adaptor 2 (2μM final concentration of each oligo): 1.5μL of 3ILL-NR (100μM) + 1.5μL of anti-ILL (100μM) + 72μL H2O = 75μL total

After annealing, the adaptors were stored on ice.


Adaptor Ligation

All components were stored on ice. Ligation reactions were prepared on ice and performed in 0.5mL snap cap tubes.

REAGENT SINGLE REACTION (μL) x11
Digested DNA 10 NA
ATP (10mM) 1 11
10x T4 Ligase Buffer 4 44
Adaptor 1 (2μM) 5 55
Adaptor 2 (2μM) 5 55
T4 DNA Ligase 1 11
NanoPure H2O 24 264
TOTAL 50 440

Added 40μL of the master mix to each tube of AlfI-digested DNA (12μL). NOTE: I made a mistake here. I should have only combined 10μL of DNA with the 40μL of master mix for each. My mistake was due, in part, to the way the Meyer Lab 2bRAD protocol is written. In the Digestion section of the protocol, Step 5 (run 2μL of the digests on a gel) is listed as optional. However, in Step 2a of the Ligation section, it says to add the “remaining 10μL of digested DNA”. The use of the word “remaining” in this instance is misleading because it implies to use all that’s left in the tube.

Incubated ligation reaction @ 16C for 3hrs in PTC-200 thermal cycler (MJ Research) – no heated lid.

Transferred tubes to ice while preparing subsequent

Goals – October 2015

I’d review last month’s goals, but I completely forgot to post them!

However, I did accomplish the two most important goals that I needed to get done last month:

  • Prep Olympia oyster (Ostrea lurida) gDNA for genome sequencing

  • Prep geoduck (Panopea generosa) gDNA for genome sequencing


For this month, I’m looking at tackling the following:

  • Prep RAD libraries to assess viability of the process on degraded Olympia oyster gDNA
  • Implement lab safety changes to be in compliance
  • Establish an “onboarding” (that’s fancy corporate speak) guide for getting new lab members up-to-speed
  • Continue working on a revamped primer database that will be a single resource (currently, it’s split in two spreadsheets and is not easily manageable/searchable)

Restriction Digest – Oly gDNA for RAD-seq w/AlfI

Used a subset (10 samples) from the Ostrea lurida gDNA isolated 20150916 to prepare RAD libraries. This will be done to assess whether or not these samples, which appear to be heavily degraded, are viable for RAD-seq.

Followed the 2bRAD protocol (PDF) developed by Eli Meyer’s lab.

Prepared 1.2μg of each of the following samples in a volume of 10μL:

Google Sheet: 20150930_RADseq_DNA_calcs


Prepared a 150μM working stock of the SAM buffer needed for the restriction digestion by diluting 30μL of the supplied stock (500μM) in 70μL NanoPure H2O (total volume = 100μL). This working stock was stored @ -20C in FTR 209 in the “RAD-seq Reagents” box.

Prepared master mix for restriction enzyme reaction:

REAGENT SINGLE REACTION (μL) x11
DNA 8 NA
10x Buffer R 1.2μL 13.2μL
150μM SAM 0.8μL 8.8μL
AlfI 0.5μL 5.5μL
H2O 1.5μL 16.5μL


Combined 4μL of the master mix with 8μL of each sample in 0.5mL snap cap tubes. Incubated @ 37C O/N in thermal cycler (no heated lid).

Uninterruptible Power Supplies (UPS)

A new UPS we installed this week for our qPCR machine (Opticon2 – BioRad) to handle power surges and power outages doesn’t seem to be working properly. With the qPCR machine (and computer and NanoDrop1000) plugged into the “battery” outlets on the UPS, this is what happens when the Opticon goes through a heating cycle:

The UPS becomes overloaded when the Opticon is in a heating cycle.


And, sometimes, that results in triggering a fault, shutting everything off in the middle of a qPCR run:

Fault message indicating unit overload.


This is supremely lame because having a battery backup is a great way to prevent the qPCR machine from shutting off when a power outage occurs!


I switched the Opticon (and computer and NanoDrop1000) to the outlets that are solely for surge protection. Check out what happens when I run the qPCR machine now:

Opticon plugged in to surge protection outlet while in heating cycle. Notice that output load is 0%.


So, I guess we’ll settle for at least having the surge protection aspect of things.


While handling this UPS issue, I realized that the two Synology servers we have possess a built-in UPS monitor. So, I connected the USB cables to/from each of the UPS that each server is plugged into and enabled UPS shutdown in the Synology Diskstation Management (DSM):


Eagle


Owl


Now, both Synology units will enter Safe Mode when the UPS they’re connected to reaches a low battery status. This will help minimize data loss/corruption during the next extended power outage we experience.

Agarose Gel – Geoduck & Olympia oyster gDNA Integrity Check

Ran a 0.8% agarose, 1x modified TAE gel (w/EtBr) with geoduck and Olympia oyster gDNA that was precipitated earlier today. Used 5μL of each sample (~500ng).

Results:

Geoduck gDNA on left. Oly gDNA on right.


Overall, the DNA still looks very good. Slight smearing (indicating slight degradation), but the high molecular weight band is very prominent. Will fill out the necessary BGI forms and ship samples out on Monday.