Category Archives: Miscellaneous

RNA Isolation – Lyophilized Tanner Crab Hemolymph in RNAlater

Due to difficulties getting RNA from hemolymph samples stored in RNAlater, Grace is testing out lyophilizing samples before extraction. Who knows what impact this will have on RNA, but it’s worth a shot!

Isolated RNA from three crab hemolymph samples preserved in RNAlater (Test 1, Test 2, Test 3) that had been lyophilized overnight last week.

Samples were provided by Grace.

I believe the primary purpose for this particular test was to verify that the freeze dryer was a feasible tool, since Grace experienced a minor mishap when she attempted the lyohpilization initially.

Lyophilization was successful, without any mess.

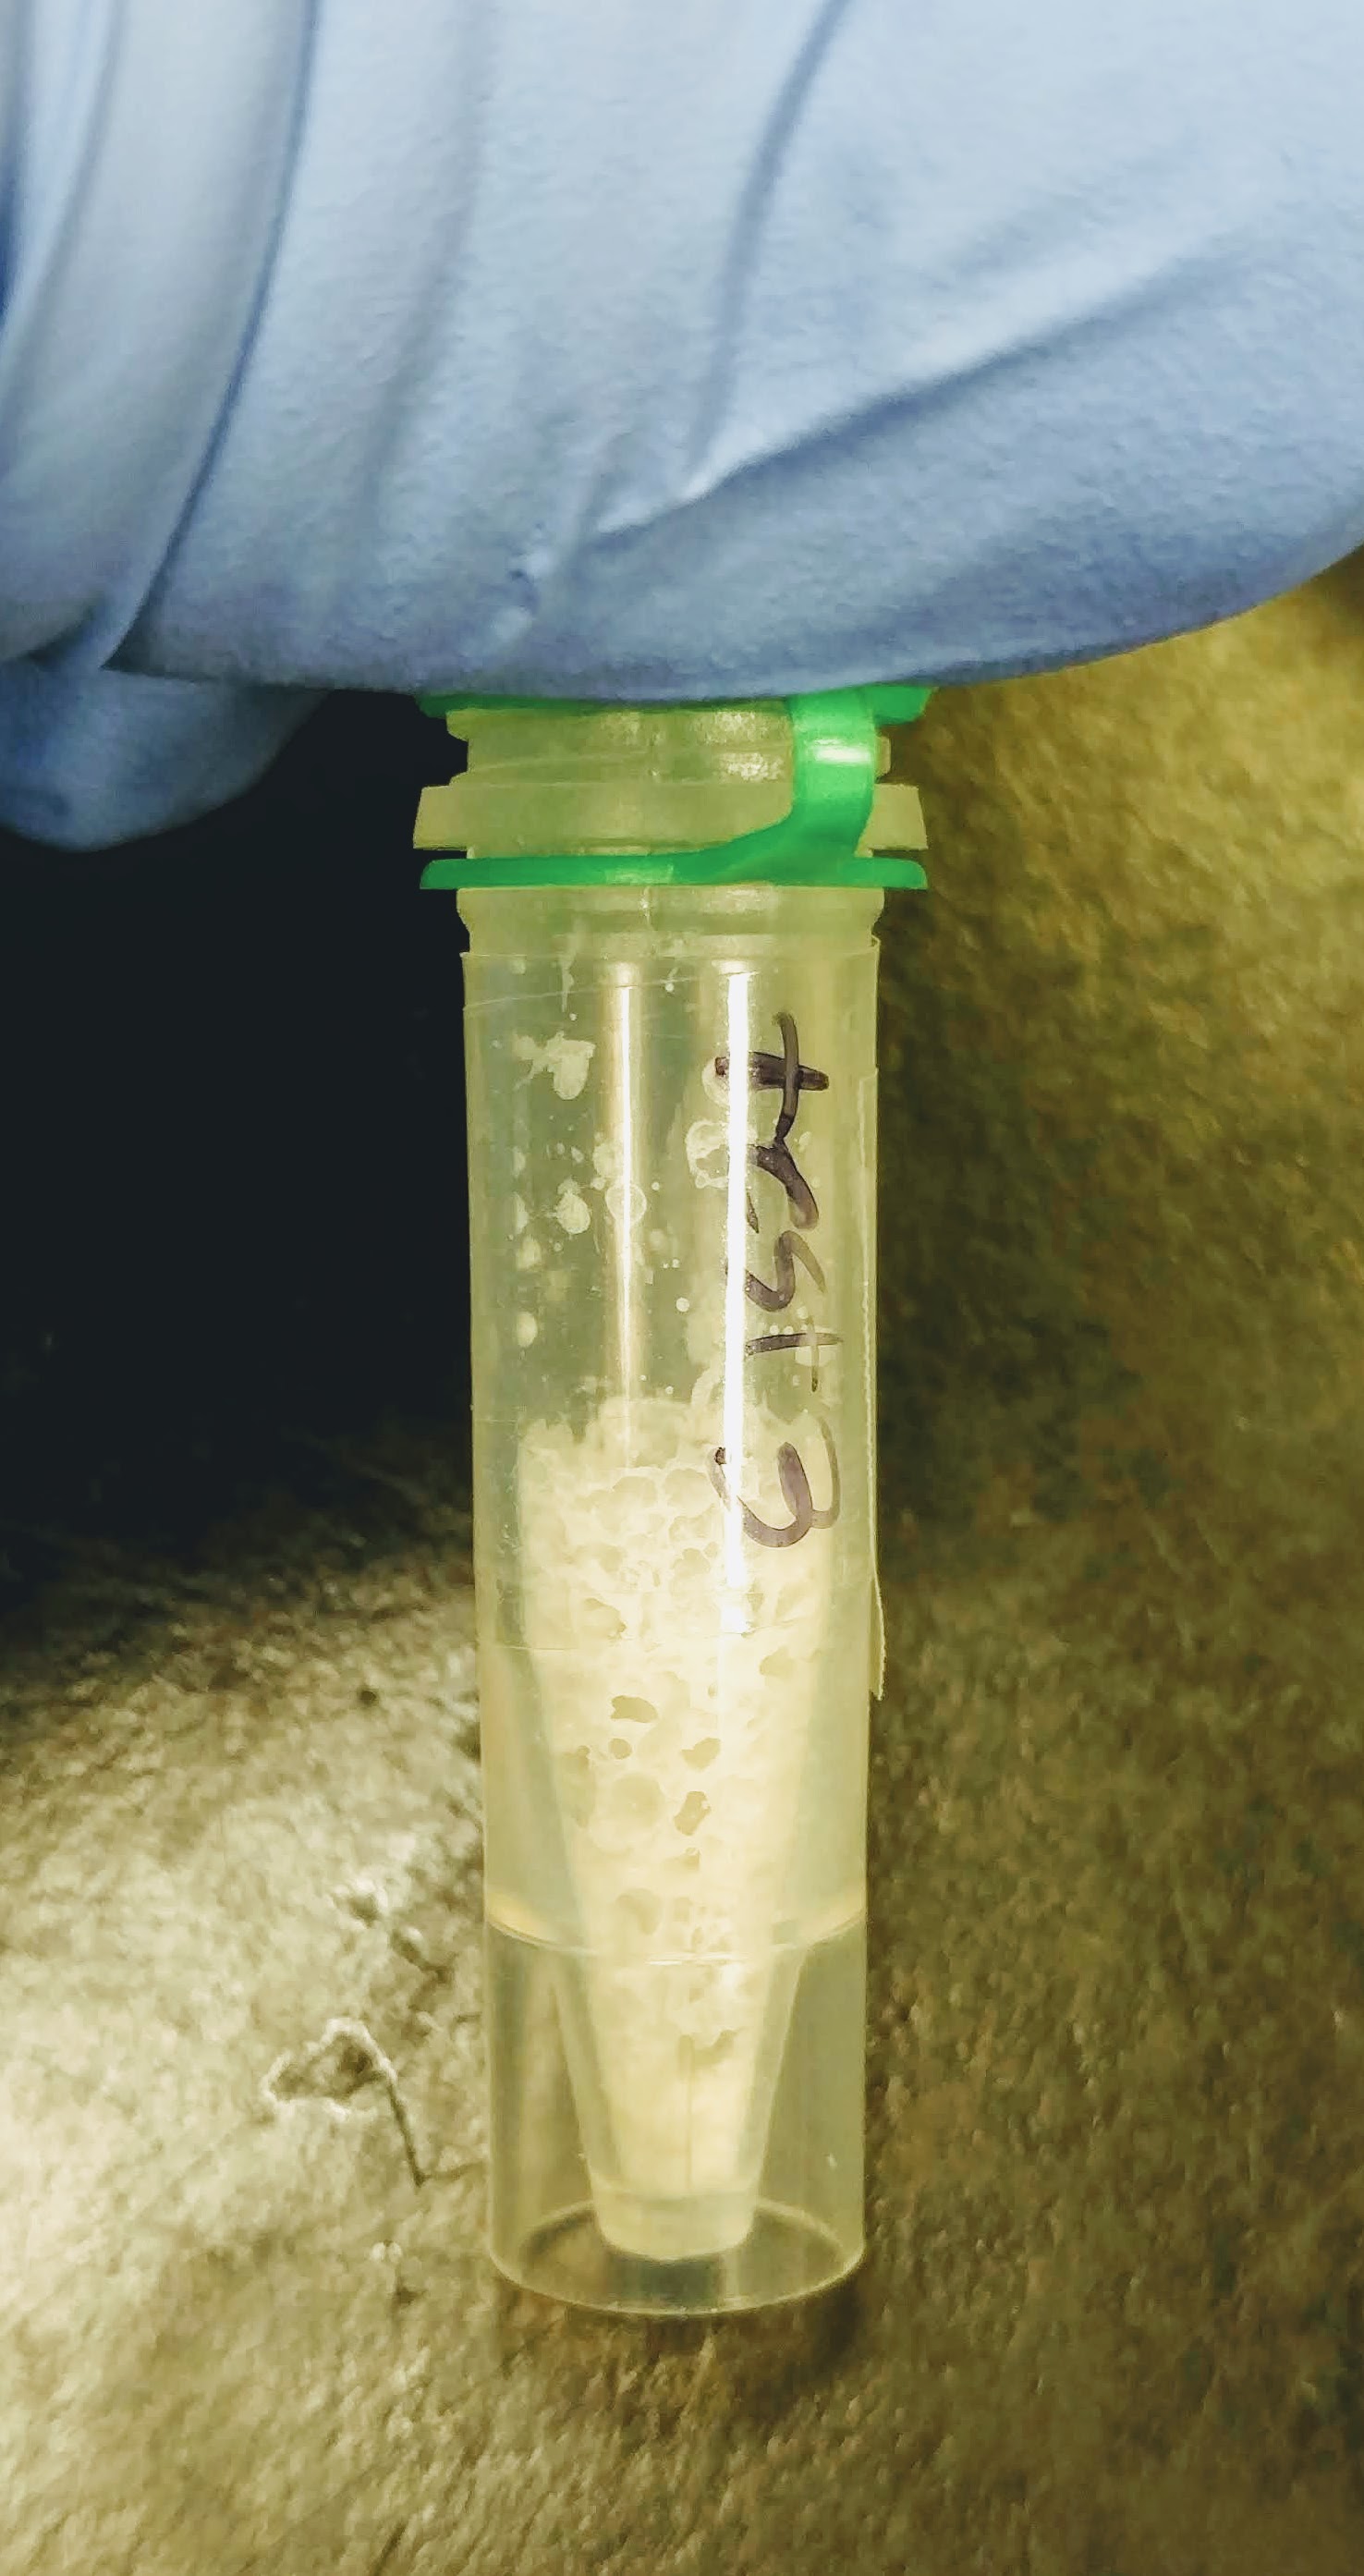
TEST 3 LYOPHILIZATION


Isolated RNA using TriReagent, according to manufacturer’s protocol:

Added 1mL TriReagent to each tube, vortexed to mix/dissolve solute, incubated 5mins at RT, added 200uL of chloroform, vortexed 15s to mix, incubated at RT for 5mins, centrifuged 15mins, 12,000g, 4oC, transferred aqueous phase to new tube, added 500uL isopropanol to aqueous phase, mixed, incubated at RT for 10mins, centrifuged 8mins, 12,000g, at RT, discarded supernatant, added 1mL 75% ethanol, centrifuged 5mins, 12,000g at RT, discarded supernatant and resuspended in 10uL of 0.1% DEPC-treated H2O.

Quantified RNA using Roberts Lab Qubit 3.0 with the Qubit RNA high sensitivity kit. Used 5uL of each sample.


RESULTS

Qubit (Google Sheet):

Only one sample (Test 3) had detectable levels of RNA (20.4ng/uL).

So, this little test demonstrates that RNA can be isolated from lyophilized samples and extracted with TriReagent. However, I have not evaluated RNA integrity on the Bioanalyzer. I think Grace has some additional samples she wanted to test this method on, so I think we’ll wait until there are more samples before we use the Bioanalyzer.

Will give sample to Grace for -80oC storage.

DNA Methylation Analysis – Olympia Oyster Whole Genome BSseq Bismark Pipeline Comparison

Ran Bismark using our high performance computing (HPC) node, Mox, with two different bowtie2 settings:

  1. Default settings

  2. –score_min L,0,-0.6

The second setting is a bit less stringent than the default settings and should result in a higher percentage of reads mapping. However, not entirely sure what the actual implications will be (if any) for interpreting the resulting data.

Input data was previously trimmed per Bismark’s recommendation for Illumina TruSeq libraries (TrimGalore! 5′ 10bp):

List of input files and Bismark configurations can be seen in the SLURM scripts:


RESULTS

Output folders:

DNA Quantification – Sea Lice DNA from 20180523

We previously received sea lice (Caligus tape) DNA from Cris Gallardo-Escarate at Universidad de Concepción.

Steven asked that I quantify and assess the DNA quality.

Ran the samples on the Roberts Lab Qubit 3.0 using the dsDNA BR assay (Invitrogen) and 1uL of template DNA.

Ran the samples on the Roberts Lab NanoDrop1000 to get 260/280 values for quality assessment using 2uL of template DNA. NanoDrop1000 was blanked with water, but I don’t know what solvent the DNA is currently resuspended in.


RESULTS

Qubit data (Google Sheet):

SAMPLE CONCENTRATION (ng/uL)
FEMALE 1 23.8
FEMALE 2 9.6

NANODROP DATA

TABLE


ABSORBANCE PLOTS


DNA looks super clean. Not sure what this DNA is intended for so can’t speculate much on what the implications might be for the concentrations on downstream usage.

DNA Methylation Analysis – Olympia oyster BSseq MethylKit Analysis

NOTE: IMPORTANT CAVEATS – READ POST BEFORE USING DATA.
I’m posting this for posterity and to provide an overview of what (and whatnot) to do. Plus, this has a good R script for using MethylKit that can be used for subsequent analyses.

The goal of this analysis was to compare the methylation profiles of Olympia oysters originating from a common population (Fidalgo Bay) that were raised in two different locations (Fidalgo Bay & Oyster Bay).

An overview of the experiment can be viewed here:

I previously ran all of Olympia oyster DNA methylation sequencing data through the Bismark pipeline, and then processed them using the MethylKit R library.

First mistake (Bismark):

  • Trimmed FastQ files “incorrectly”.

Bismark provides an excellent user guide and provides a handy table on how to decide on trimming parameters, but I mistakenly trimmed these according to the recommendations for a different library preparation technique. I trimmed based on the Zymo Pico-Methyl Kit (which was used for the other group of data that I processed simultaneously), instead of the TruSeq library prep.

So, “incorrectly” isn’t necessarily the proper term here. The analysis can still be used, however, it’s likely that the excessive trimming results in reducing sequencing coverage, and, in turn, making the downstream analysis result in a highly conservative output. Thus, the data isn’t wrong or bad, it is just very limited.

And, this leads to the second mistake (Bismark):

  • Bowtie alignment score too strict

There’s a bit of a weird “battle” between Bismark and bowtie2. Bismark uses bowtie2 for generating alignments, but bowtie2’s default cutoff score overrides Bismark’s. So, to adjust the score value, you have to explicitly add the scoring parameters to your Bismark parameters during the alignment step. I did not do this.

Again, it’s not wrong, per se, but leads to a significantly limited set of data in the final analysis.

The data were analyzed based on a minimum of:

  • 3x coverage

  • 25% difference in methylation


RESULTS:

Methylkit analysis (R project; GitHub):

BedGraph file (BED):

The analysis resulted in a total of seven (yes, 7) differentially methylated loci (DML) between the two groups. It was this result that made Steven and me revisit the initial Bismark analysis. He has done this previously (but differently) and gotten significantly greater numbers of DML.

Knowing all of this, I will re-trim the data and adjust Bismark alignment score thresholds and then re-analyze with MethylKit.

Regardless here’re some plots to add some visual flair to this notebook entry (these, and more, are available in the GitHub repo):

CLUSTERING DENDROGRAM


PCA PLOT

Transcriptome Assembly – Geoduck RNAseq data

Used all of our current geoduck RNAseq data to assemble a transcriptome using Trinity.

Trinity was run our our Mox HPC node. Specifically, I had to use just a single node with 500GB of RAM. Trinity could not run with much less than that. Initially, I attempted to run with two nodes, but our smaller node (120GB) ended up limiting the available RAM (the system only uses the RAM available on the smallest node; it cannot combine RAM or dynamically allocate computing to a node with larger RAM when needed) and Trinity consistently crashed due to memory limitations.

Reads were trimmed using the built-in version of Trimmomatic with the default settings.

SBATCH script:

Due to the huge number of input files, I won’t post the entire script contents here. Instead, here’s a snippet of the script showing the commands used to start the Trinity run:


#!/bin/bash
## Job Name
#SBATCH --job-name=20180829_trinity
## Allocation Definition 
#SBATCH --account=srlab
#SBATCH --partition=srlab
## Resources
## Nodes
#SBATCH --nodes=1
## Walltime (days-hours:minutes:seconds format)
#SBATCH --time=30-00:00:00
## Memory per node
#SBATCH --mem=500G
##turn on e-mail notification
#SBATCH --mail-type=ALL
#SBATCH --mail-user=samwhite@uw.edu
## Specify the working directory for this job
#SBATCH --workdir=/gscratch/scrubbed/samwhite/20180827_trinity_geoduck_RNAseq

# Load Python Mox module for Python module availability

module load intel-python3_2017

# Document programs in PATH (primarily for program version ID)

date >> system_path.log
echo "" >> system_path.log
echo "System PATH for $SLURM_JOB_ID" >> system_path.log
echo "" >> system_path.log
printf "%0.s-" {1..10} >> system_path.log
echo ${PATH} | tr : \\n >> system_path.log


# Run Trinity
/gscratch/srlab/programs/trinityrnaseq-Trinity-v2.8.3/Trinity \
--trimmomatic \
--seqType fq \
--max_memory 500G \
--CPU 28 \

Despite the naming conventions, this job was submitted to the Mox scheduler on 20180829 and finished on 20180901.

After job completion, the entire folder was gzipped (the following method of gzipping is SUPER fast, btw):

tar -c 20180827_trinity_geoduck_RNAseq | pigz > 20180827_trinity_geoduck_RNAseq.tar.gz

RESULTS:

Output folder:

Trinity assembly (FastA):

Next up, I’ll get some annotations going by running through TransDecoder and blastx.

FastQC/MultiQC/TrimGalore/MultiQC/FastQC/MultiQC – O.lurida WGBSseq for Methylation Analysis

I previously ran this data through the Bismark pipeline and followed up with MethylKit analysis. MethylKit analysis revealed an extremely low number of differentially methylated loci (DML), which seemed odd.

Steven and I met to discuss and compare our different variations on the analysis and decided to try out different tweaks to evaluate how they affect analysis.

I did the following tasks:

  1. Looked at original sequence data quality with FastQC.

  2. Summarized FastQC analysis with MultiQC.

  3. Trimmed data using TrimGalore!, trimming 10bp from 5′ end of reads (8bp is recommended by Bismark docs).

  4. Summarized trimming stats with MultiQC.

  5. Looked at trimmed sequence quality with FastQC.

  6. Summarized FastQC analysis with MultiQC.

This was run on the Univ. of Washington High Performance Computing (HPC) cluster, Mox.

Mox SBATCH submission script has all details on how the analyses were conducted:


RESULTS

Output folder:

Raw sequence FastQC output folder:

Raw sequence MultiQC report (HTML):

TrimGalore! output folder (trimmed FastQ files are here):

Trimming MultiQC report (HTML):

Trimmed FastQC output folder:

Trimmed MultiQC report (HTML):

Transposable Element Mapping – Crassostrea virginica Genome, Cvirginica_v300, using RepeatMasker 4.07

Per this GitHub issue, I’m IDing transposable elements (TEs) in the Crassostrea virginica genome.

Genome used:

I ran RepeatMasker (v4.07) with RepBase-20170127 and RMBlast 2.6.0 four times:

  1. Species = all

  2. Species = Crassostrea gigas (Pacific oyster)

  3. Species = Crassostrea virginica (Eastern oyster)

  4. Default settings (i.e. no species select – will use human genome).

The idea with running this with four different settings was to get a sense of how the analyses would differ with species specifications.

All runs were performed on roadrunner.

All commands were documented in a Jupyter Notebook (GitHub):

NOTE: RepeatMasker writes the desired output files (*.out, *.cat.gz, and *.gff) to the same directory that the genome is located in! If you conduct multiple runs with the same genome in the same directory, it will overwrite those files, as they are named using the genome assembly filename. Be sure to move files out of the genome directory after each run!


RESULTS:
RUN 1 (species – all)

Output folder:

Summary table (text):

Output table (GFF):

SUMMARY TABLE

==================================================
file name: Cvirginica_v300.fa       
sequences:            11
total length:  684741128 bp  (684675328 bp excl N/X-runs)
GC level:         34.83 %
bases masked:  113771462 bp ( 16.62 %)
==================================================
               number of      length   percentage
               elements*    occupied  of sequence
--------------------------------------------------
Retroelements        97003     27946871 bp    4.08 %
   SINEs:            48145      9242559 bp    1.35 %
   Penelope           1429       256929 bp    0.04 %
   LINEs:            27022     10570154 bp    1.54 %
    CRE/SLACS           28         2219 bp    0.00 %
     L2/CR1/Rex       2160       316660 bp    0.05 %
     R1/LOA/Jockey    3058       386611 bp    0.06 %
     R2/R4/NeSL        511       226938 bp    0.03 %
     RTE/Bov-B        7377      3276312 bp    0.48 %
     L1/CIN4          1331        95476 bp    0.01 %
   LTR elements:     21836      8134158 bp    1.19 %
     BEL/Pao          1807       936488 bp    0.14 %
     Ty1/Copia        3046       296183 bp    0.04 %
     Gypsy/DIRS1     12789      6060883 bp    0.89 %
       Retroviral     2369       152228 bp    0.02 %

DNA transposons     180693     29492426 bp    4.31 %
   hobo-Activator    12869      1114188 bp    0.16 %
   Tc1-IS630-Pogo    17233      2485049 bp    0.36 %
   En-Spm                0            0 bp    0.00 %
   MuDR-IS905            0            0 bp    0.00 %
   PiggyBac           2388       405926 bp    0.06 %
   Tourist/Harbinger  9302       992476 bp    0.14 %
   Other (Mirage,      238        15946 bp    0.00 %
    P-element, Transib)

Rolling-circles          0            0 bp    0.00 %

Unclassified:       137707     45460608 bp    6.64 %

Total interspersed repeats:   102899905 bp   15.03 %


Small RNA:           45243      9057873 bp    1.32 %

Satellites:           3852       760316 bp    0.11 %
Simple repeats:     203542      8946510 bp    1.31 %
Low complexity:      26205      1281043 bp    0.19 %
==================================================

* most repeats fragmented by insertions or deletions
  have been counted as one element
  Runs of >=20 X/Ns in query were excluded in % calcs


The query species was assumed to be root          
RepeatMasker Combined Database: Dfam_Consensus-20170127, RepBase-20170127
        
run with rmblastn version 2.6.0+


RUN 2 (species – Crassostrea gigas)

Output folder:

Summary table (text):

Output table (GFF):

SUMMARY TABLE

==================================================
file name: Cvirginica_v300.fa       
sequences:            11
total length:  684741128 bp  (684675328 bp excl N/X-runs)
GC level:         34.83 %
bases masked:   93923386 bp ( 13.72 %)
==================================================
               number of      length   percentage
               elements*    occupied  of sequence
--------------------------------------------------
Retroelements        26397     15008601 bp    2.19 %
   SINEs:                4          722 bp    0.00 %
   Penelope            675       190160 bp    0.03 %
   LINEs:            17645      8922188 bp    1.30 %
    CRE/SLACS            0            0 bp    0.00 %
     L2/CR1/Rex         70        39188 bp    0.01 %
     R1/LOA/Jockey       0            0 bp    0.00 %
     R2/R4/NeSL          4         5110 bp    0.00 %
     RTE/Bov-B        6194      2718955 bp    0.40 %
     L1/CIN4             0            0 bp    0.00 %
   LTR elements:      8748      6085691 bp    0.89 %
     BEL/Pao           933       788887 bp    0.12 %
     Ty1/Copia          47        82743 bp    0.01 %
     Gypsy/DIRS1      6819      4822734 bp    0.70 %
       Retroviral        0            0 bp    0.00 %

DNA transposons     163945     26422122 bp    3.86 %
   hobo-Activator     7742       720623 bp    0.11 %
   Tc1-IS630-Pogo    15615      2328538 bp    0.34 %
   En-Spm                0            0 bp    0.00 %
   MuDR-IS905            0            0 bp    0.00 %
   PiggyBac           2246       393498 bp    0.06 %
   Tourist/Harbinger  8431       876020 bp    0.13 %
   Other (Mirage,        0            0 bp    0.00 %
    P-element, Transib)

Rolling-circles          0            0 bp    0.00 %

Unclassified:       160681     41266796 bp    6.03 %

Total interspersed repeats:    82697519 bp   12.08 %


Small RNA:             214        40811 bp    0.01 %

Satellites:           1396       217317 bp    0.03 %
Simple repeats:     216869      9637447 bp    1.41 %
Low complexity:      27520      1418990 bp    0.21 %
==================================================

* most repeats fragmented by insertions or deletions
  have been counted as one element
  Runs of >=20 X/Ns in query were excluded in % calcs


The query species was assumed to be crassostrea gigas
RepeatMasker Combined Database: Dfam_Consensus-20170127, RepBase-20170127
        

RUN 3 (species – Crassostrea virginica)

Output folder:

Summary table (text):

Output table (GFF):

SUMMARY TABLE

==================================================
file name: Cvirginica_v300.fa       
sequences:            11
total length:  684741128 bp  (684675328 bp excl N/X-runs)
GC level:         34.83 %
bases masked:   46637065 bp ( 6.81 %)
==================================================
               number of      length   percentage
               elements*    occupied  of sequence
--------------------------------------------------
Retroelements        43139      8952068 bp    1.31 %
   SINEs:            43139      8952068 bp    1.31 %
   Penelope              0            0 bp    0.00 %
   LINEs:                0            0 bp    0.00 %
    CRE/SLACS            0            0 bp    0.00 %
     L2/CR1/Rex          0            0 bp    0.00 %
     R1/LOA/Jockey       0            0 bp    0.00 %
     R2/R4/NeSL          0            0 bp    0.00 %
     RTE/Bov-B           0            0 bp    0.00 %
     L1/CIN4             0            0 bp    0.00 %
   LTR elements:         0            0 bp    0.00 %
     BEL/Pao             0            0 bp    0.00 %
     Ty1/Copia           0            0 bp    0.00 %
     Gypsy/DIRS1         0            0 bp    0.00 %
       Retroviral        0            0 bp    0.00 %

DNA transposons       3538      1564942 bp    0.23 %
   hobo-Activator        0            0 bp    0.00 %
   Tc1-IS630-Pogo        0            0 bp    0.00 %
   En-Spm                0            0 bp    0.00 %
   MuDR-IS905            0            0 bp    0.00 %
   PiggyBac              0            0 bp    0.00 %
   Tourist/Harbinger     0            0 bp    0.00 %
   Other (Mirage,        0            0 bp    0.00 %
    P-element, Transib)

Rolling-circles          0            0 bp    0.00 %

Unclassified:        65151     23982146 bp    3.50 %

Total interspersed repeats:    34499156 bp    5.04 %


Small RNA:           43353      8992879 bp    1.31 %

Satellites:              1          222 bp    0.00 %
Simple repeats:     232627     10544162 bp    1.54 %
Low complexity:      29762      1561018 bp    0.23 %
==================================================

* most repeats fragmented by insertions or deletions
  have been counted as one element
  Runs of >=20 X/Ns in query were excluded in % calcs


The query species was assumed to be crassostrea virginica
RepeatMasker Combined Database: Dfam_Consensus-20170127, RepBase-20170127
        
run with rmblastn version 2.6.0+

RUN 4 (default settings – human genome)

Output folder:

Summary table (text):

Output table (GFF):

SUMMARY TABLE

==================================================
file name: Cvirginica_v300.fa       
sequences:            11
total length:  684741128 bp  (684675328 bp excl N/X-runs)
GC level:         34.83 %
bases masked:   13461422 bp ( 1.97 %)
==================================================
               number of      length   percentage
               elements*    occupied  of sequence
--------------------------------------------------
SINEs:             2056       120820 bp    0.02 %
      ALUs            0            0 bp    0.00 %
      MIRs          240        14635 bp    0.00 %

LINEs:             3408       331585 bp    0.05 %
      LINE1         240        16835 bp    0.00 %
      LINE2         728        69177 bp    0.01 %
      L3/CR1       1369       135234 bp    0.02 %

LTR elements:       704       236625 bp    0.03 %
      ERVL           14          944 bp    0.00 %
      ERVL-MaLRs     12          892 bp    0.00 %
      ERV_classI    272        36695 bp    0.01 %
      ERV_classII     4          206 bp    0.00 %

DNA elements:      1088       100026 bp    0.01 %
     hAT-Charlie     27         1543 bp    0.00 %
     TcMar-Tigger   142         9891 bp    0.00 %

Unclassified:        57         6096 bp    0.00 %

Total interspersed repeats:   795152 bp    0.12 %


Small RNA:         3698       279669 bp    0.04 %

Satellites:          73         5524 bp    0.00 %
Simple repeats:  247957     10848509 bp    1.58 %
Low complexity:   30084      1536314 bp    0.22 %
==================================================

* most repeats fragmented by insertions or deletions
  have been counted as one element
  Runs of >=20 X/Ns in query were excluded in % calcs


The query species was assumed to be homo sapiens  
RepeatMasker Combined Database: Dfam_Consensus-20170127, RepBase-20170127
        
run with rmblastn version 2.6.0+

DNA Methylation Analysis – Bismark Pipeline on All Olympia oyster BSseq Datasets

Bismark analysis of all of our current Olympia oyster (Ostrea lurida) DNA methylation high-throughput sequencing data.

Analysis was run on Emu (Ubuntu 16.04LTS, Apple Xserve). The primary analysis took ~14 days to complete.

All operations are documented in a Jupyter notebook (GitHub):

Genome used:


Input files ( see Olympia oyster Genomic GitHub wiki for more info ):

WG BSseq of Fidalgo Bay offspring grown in Fidalgo Bay & Oyster Bay
  • 1_ATCACG_L001_R1_001.fastq.gz

  • 2_CGATGT_L001_R1_001.fastq.gz

  • 3_TTAGGC_L001_R1_001.fastq.gz

  • 4_TGACCA_L001_R1_001.fastq.gz

  • 5_ACAGTG_L001_R1_001.fastq.gz

  • 6_GCCAAT_L001_R1_001.fastq.gz

  • 7_CAGATC_L001_R1_001.fastq.gz

  • 8_ACTTGA_L001_R1_001.fastq.gz

MBDseq of two populations (Hood Canal & Oyster Bay) grown in Clam Bay
  • zr1394_10_s456.fastq.gz

  • zr1394_11_s456.fastq.gz

  • zr1394_12_s456.fastq.gz

  • zr1394_13_s456.fastq.gz

  • zr1394_14_s456.fastq.gz

  • zr1394_15_s456.fastq.gz

  • zr1394_16_s456.fastq.gz

  • zr1394_17_s456.fastq.gz

  • zr1394_18_s456.fastq.gz

  • zr1394_1_s456.fastq.gz

  • zr1394_2_s456.fastq.gz

  • zr1394_3_s456.fastq.gz

  • zr1394_4_s456.fastq.gz

  • zr1394_5_s456.fastq.gz

  • zr1394_6_s456.fastq.gz

  • zr1394_7_s456.fastq.gz

  • zr1394_8_s456.fastq.gz

  • zr1394_9_s456.fastq.gz


RESULTS:

With Bismark complete, these two sets of analyses can now be looked into further (and separately, as they are separate experiments) using things like MethylKit (R package) and
the Integrative Genomics Viewer (IGV).

Output folder:

Bismark Summary Report:

Individual Sample Reports:

Data Received – Geoduck Metagenome HiSeqX Data

Received the data from the geoduck metagenome libraries that I prepared and were sequenced at the Northwest Genomics Center at UW on the HiSeqX (Illumina) – PE 151bp.

FastQ files are being transferred to owl/nightingales/P_generosa.

These aren’t geoduck sequences, but they are part of a geoduck project. Maybe I should establish a metagenomics directory under nightingales?

Will verifiy md5 checksums and update readme file once the transfer is complete.

RNA Isolation & Quantificaiton – Tanner Crab Hemolymph

Isolated RNA from 40 Tanner crab hemolymph samples selected by Grace with the RNeasy Plus Micro Kit (Qiagen) according to the manufacturer’s protocol, with the following modifications:

  • Added mercaptoethanol (2-ME) to Buffer RLT Plus.

  • All spins were at 21,130g

  • Did not add RNA carrier

  • Used QIAshredder columns to aid in homogenization and removal of insoluble material

  • Eluted with 14uL

RNA was quantified using the Qubit RNA HS (high sensitivity) Assay and run on the Roberts Lab Qubit 3.0.

Used 1uL of sample for quantification.

RNA was returned to the -80C box from where original samples had been stored (Rack 2, Row 3, Column 4).


RESULTS

Qubit quantification (Google Sheet):

Overall, the results aren’t great. Only 15 samples (out of 40) had detectable amounts of RNA. Yields from those 15 samples ranged from 40ng – 300ng, with most landing between 50 – 100ng.

Will pass info along to Grace. Will likely meet with her and Steven to discuss plan on how to move forward.