Tag Archives: jupyter notebook

BS-seq Mapping – Olympia oyster bisulfite sequencing: TrimGalore > FastQC > Bismark

Steven asked me to evaluate our methylation sequencing data sets for Olympia oyster.

According to our Olympia oyster genome wiki, we have the following two sets of BS-seq data:

All computing was conducted on our Apple Xserve: emu.

All steps were documented in this Jupyter Notebook (GitHub): 20180503_emu_oly_methylation_mapping.ipynb

NOTE: The Jupyter Notebook linked above is very large in size. As such it will not render on GitHub. It will need to be downloaded to a computer that can run Jupyter Notebooks and viewed that way.

Here’s a brief overview of what was done.

Samples were trimmed with TrimGalore and then evaluated with FastQC. MultiQC was used to generate a nice visual summary report of all samples.

The Olympia oyster genome assembly, pbjelly_sjw_01, was used as the reference genome and was prepared for use in Bismark:


/home/shared/Bismark-0.19.1/bismark_genome_preparation \
--path_to_bowtie /home/shared/bowtie2-2.3.4.1-linux-x86_64/ \
--verbose /home/sam/data/oly_methylseq/oly_genome/ \
2> 20180507_bismark_genome_prep.err

Bismark was run on trimmed samples with the following command:


/home/shared/Bismark-0.19.1/bismark \
--path_to_bowtie /home/shared/bowtie2-2.3.4.1-linux-x86_64/ \
--genome /home/sam/data/oly_methylseq/oly_genome/ \
-u 1000000 \
-p 16 \
--non_directional \
/home/sam/analyses/20180503_oly_methylseq_trimgalore/1_ATCACG_L001_R1_001_trimmed.fq.gz \
/home/sam/analyses/20180503_oly_methylseq_trimgalore/2_CGATGT_L001_R1_001_trimmed.fq.gz \
/home/sam/analyses/20180503_oly_methylseq_trimgalore/3_TTAGGC_L001_R1_001_trimmed.fq.gz \
/home/sam/analyses/20180503_oly_methylseq_trimgalore/4_TGACCA_L001_R1_001_trimmed.fq.gz \
/home/sam/analyses/20180503_oly_methylseq_trimgalore/5_ACAGTG_L001_R1_001_trimmed.fq.gz \
/home/sam/analyses/20180503_oly_methylseq_trimgalore/6_GCCAAT_L001_R1_001_trimmed.fq.gz \
/home/sam/analyses/20180503_oly_methylseq_trimgalore/7_CAGATC_L001_R1_001_trimmed.fq.gz \
/home/sam/analyses/20180503_oly_methylseq_trimgalore/8_ACTTGA_L001_R1_001_trimmed.fq.gz \
/home/sam/analyses/20180503_oly_methylseq_trimgalore/zr1394_10_s456_trimmed.fq.gz \
/home/sam/analyses/20180503_oly_methylseq_trimgalore/zr1394_11_s456_trimmed.fq.gz \
/home/sam/analyses/20180503_oly_methylseq_trimgalore/zr1394_12_s456_trimmed.fq.gz \
/home/sam/analyses/20180503_oly_methylseq_trimgalore/zr1394_13_s456_trimmed.fq.gz \
/home/sam/analyses/20180503_oly_methylseq_trimgalore/zr1394_14_s456_trimmed.fq.gz \
/home/sam/analyses/20180503_oly_methylseq_trimgalore/zr1394_15_s456_trimmed.fq.gz \
/home/sam/analyses/20180503_oly_methylseq_trimgalore/zr1394_16_s456_trimmed.fq.gz \
/home/sam/analyses/20180503_oly_methylseq_trimgalore/zr1394_17_s456_trimmed.fq.gz \
/home/sam/analyses/20180503_oly_methylseq_trimgalore/zr1394_18_s456_trimmed.fq.gz \
/home/sam/analyses/20180503_oly_methylseq_trimgalore/zr1394_1_s456_trimmed.fq.gz \
/home/sam/analyses/20180503_oly_methylseq_trimgalore/zr1394_2_s456_trimmed.fq.gz \
/home/sam/analyses/20180503_oly_methylseq_trimgalore/zr1394_3_s456_trimmed.fq.gz \
/home/sam/analyses/20180503_oly_methylseq_trimgalore/zr1394_4_s456_trimmed.fq.gz \
/home/sam/analyses/20180503_oly_methylseq_trimgalore/zr1394_5_s456_trimmed.fq.gz \
/home/sam/analyses/20180503_oly_methylseq_trimgalore/zr1394_6_s456_trimmed.fq.gz \
/home/sam/analyses/20180503_oly_methylseq_trimgalore/zr1394_7_s456_trimmed.fq.gz \
/home/sam/analyses/20180503_oly_methylseq_trimgalore/zr1394_8_s456_trimmed.fq.gz \
/home/sam/analyses/20180503_oly_methylseq_trimgalore/zr1394_9_s456_trimmed.fq.gz \
2> 20180507_bismark_02.err

Results:

TrimGalore output folder:

FastQC output folder:

MultiQC output folder:

MultiQC Report (HTML):

Bismark genome folder: 20180503_oly_genome_pbjelly_sjw_01_bismark/

Bismark output folder:


Whole genome BS-seq (2015)

Prep overview
  • Library prep: Roberts Lab
  • Sequencing: Genewiz
Bismark Report Mapping Percentage
1_ATCACG_L001_R1_001_trimmed_bismark_bt2_SE_report.txt 40.3%
2_CGATGT_L001_R1_001_trimmed_bismark_bt2_SE_report.txt 39.9%
3_TTAGGC_L001_R1_001_trimmed_bismark_bt2_SE_report.txt 40.2%
4_TGACCA_L001_R1_001_trimmed_bismark_bt2_SE_report.txt 40.4%
5_ACAGTG_L001_R1_001_trimmed_bismark_bt2_SE_report.txt 39.9%
6_GCCAAT_L001_R1_001_trimmed_bismark_bt2_SE_report.txt 39.6%
7_CAGATC_L001_R1_001_trimmed_bismark_bt2_SE_report.txt 39.9%
8_ACTTGA_L001_R1_001_trimmed_bismark_bt2_SE_report.txt 39.7%

MBD BS-seq (2015)

Prep overview
  • MBD: Roberts Lab
  • Library prep: ZymoResearch
  • Sequencing: ZymoResearch
Bismark Report Mapping Percentage
zr1394_1_s456_trimmed_bismark_bt2_SE_report.txt 33.0%
zr1394_2_s456_trimmed_bismark_bt2_SE_report.txt 34.1%
zr1394_3_s456_trimmed_bismark_bt2_SE_report.txt 32.5%
zr1394_4_s456_trimmed_bismark_bt2_SE_report.txt 32.8%
zr1394_5_s456_trimmed_bismark_bt2_SE_report.txt 35.2%
zr1394_6_s456_trimmed_bismark_bt2_SE_report.txt 35.5%
zr1394_7_s456_trimmed_bismark_bt2_SE_report.txt 32.8%
zr1394_8_s456_trimmed_bismark_bt2_SE_report.txt 33.0%
zr1394_9_s456_trimmed_bismark_bt2_SE_report.txt 34.7%
zr1394_10_s456_trimmed_bismark_bt2_SE_report.txt 34.9%
zr1394_11_s456_trimmed_bismark_bt2_SE_report.txt 30.5%
zr1394_12_s456_trimmed_bismark_bt2_SE_report.txt 35.8%
zr1394_13_s456_trimmed_bismark_bt2_SE_report.txt 32.5%
zr1394_14_s456_trimmed_bismark_bt2_SE_report.txt 30.8%
zr1394_15_s456_trimmed_bismark_bt2_SE_report.txt 31.3%
zr1394_16_s456_trimmed_bismark_bt2_SE_report.txt 30.7%
zr1394_17_s456_trimmed_bismark_bt2_SE_report.txt 32.4%
zr1394_18_s456_trimmed_bismark_bt2_SE_report.txt 34.9%

Assembly Comparisons – Oly Assemblies Using Quast

I ran Quast to compare all of our current Olympia oyster genome assemblies.

See Jupyter Notebook in Results section for Quast execution.

Results:

Output folder: http://owl.fish.washington.edu/Athaliana/quast_results/results_2018_01_16_10_08_35/

Heatmapped table of results: http://owl.fish.washington.edu/Athaliana/quast_results/results_2018_01_16_10_08_35/report.html

Very enlightening!

After all the difficulties with PB Jelly, it has produced the most large contigs. However, it does also have the highest quantity and rate of N’s of all the assemblies produced to date.

BEST OF:

# contigs (>= 50000 bp): pbjelly_sjw_01 (894)
Largest Contig: redundans_sjw_02 (322,397bp)
Total Length: pbjelly_sjw_01 (1,180,563,613bp)
Total Length (>=50,000bp): pbjelly_sjw_01 (57,741,906bp)
N50: redundans_sjw_03 (17,679bp)

Jupyter Notebook (GitHub): 20180116_swoose_oly_assembly_comparisons_quast.ipynb

Genome Assembly – Olympia Oyster Illumina & PacBio Using PB Jelly w/BGI Scaffold Assembly

After another attempt to fix PB Jelly, I ran it again.

We’ll see how it goes this time…

Re-ran this using the BGI Illumina scaffolds FASTA.

Here’s a brief rundown of how this was run:

See the Jupyter Notebook for full details of run (see Results section below).

Results:

Output folder: http://owl.fish.washington.edu/Athaliana/20171130_oly_pbjelly/

Output FASTA file: http://owl.fish.washington.edu/Athaliana/20171130_oly_pbjelly/jelly.out.fasta

Quast assessment of output FASTA:

Assembly jelly.out
# contigs (>= 0 bp) 696946
# contigs (>= 1000 bp) 159429
# contigs (>= 5000 bp) 68750
# contigs (>= 10000 bp) 35320
# contigs (>= 25000 bp) 7048
# contigs (>= 50000 bp) 894
Total length (>= 0 bp) 1253001795
Total length (>= 1000 bp) 1140787867
Total length (>= 5000 bp) 932263178
Total length (>= 10000 bp) 691523275
Total length (>= 25000 bp) 261425921
Total length (>= 50000 bp) 57741906
# contigs 213264
Largest contig 194507
Total length 1180563613
GC (%) 36.57
N50 12433
N75 5983
L50 26241
L75 60202
# N’s per 100 kbp 6580.58

Have added this assembly to our Olympia oyster genome assemblies table.

This took an insanely long time to complete (nearly six weeks)!!! After some internet searching, I’ve found a pontential solution to this and have initiated another PB Jelly run to see if it will run faster. Regardless, it’ll be interesting to see how the results compare from two independent runs of PB Jelly.

Jupyter Notebook (GitHub): 20171130_emu_pbjelly.ipynb

Genome Assembly – Olympia Oyster Illumina & PacBio Using PB Jelly w/BGI Scaffold Assembly

Yesterday, I ran PB Jelly using Sean’s Platanus assembly, but that didn’t produce an assembly because PB Jelly was expecting gaps in the Illumina reference assembly (i.e. scaffolds, not contigs).

Re-ran this using the BGI Illumina scaffolds FASTA.

Here’s a brief rundown of how this was run:

See the Jupyter Notebook for full details of run (see Results section below).

Results:

Output folder: http://owl.fish.washington.edu/Athaliana/20171114_oly_pbjelly/

Output FASTA file: http://owl.fish.washington.edu/Athaliana/20171114_oly_pbjelly/jelly.out.fasta

OK! This seems to have worked (and it was quick, like less than an hour!), as it actually produced a FASTA file! Will run QUAST with this and some assemblies to compare assembly stats. Have added this assembly to our Olympia oyster genome assemblies table.

Jupyter Notebook (GitHub): 20171114_emu_pbjelly_BGI_scaffold.ipynb

Genome Assembly – Olympia Oyster Illumina & PacBio Using PB Jelly w/Platanus Assembly

Sean had previously attempted to run PB Jelly, but ran into some issues running on Hyak, so I decided to try this on Emu.

Here’s a brief rundown of how this was run:

See the Jupyter Notebook for full details of run (see Results section below).

Results:

Output folder: http://owl.fish.washington.edu/Athaliana/20171113_oly_pbjelly/

This completed very quickly (like, just a couple of hours). I also didn’t experience the woes of multimillion temp file production that killed Sean’s attempt at running this on Mox (Hyak).

However, it doesn’t seem to have produced an assembly!

Looking through the output, it seems as though it didn’t produce an assembly because there weren’t any gaps to fill in the reference. This makes sense (in regards to the lack of gaps in the reference Illumina assembly) because I used the Platanus contig FASTA file (i.e. not a scaffolds file). I didn’t realize PB Jelly was just designed for gap filling. Guess I’ll give this another go using the BGI scaffold FASTA file and see what we get.

Jupyter Notebook (GitHub): 20171113_emu_pbjelly_22mer_plat.ipynb

Genome Assembly – Olympia oyster PacBio Canu v1.6

I decided to run Canu myself, since documentation for Sean’s Canu run is a bit lacking. Additionally, it looks like he specified a genome size of 500Mbp, which is probably too small. For this assembly, I set the genome size to 1.9Gbp (based on the info in the BGI assembly report, using 17-mers for calculating genome size), which is probably on the large size.

Additionally, I remembered we had an old PacBio run that we had been forgetting about and thought it would be nice to have incorporated into an assembly.

See all the messy details of this in the Jupyter Notebook below, but here’s the core info about this Canu assembly.

PacBio Input files (available on Owl/nightingales/O_lurida:

m170308_163922_42134_c101174252550000001823269408211742_s1_p0_filtered_subreads.fastq.gz                                                               m170308_230815_42134_c101174252550000001823269408211743_s1_p0_filtered_subreads.fastq.gz
m130619_081336_42134_c100525122550000001823081109281326_s1_p0.fastq                       m170315_001112_42134_c101169372550000001823273008151717_s1_p0_filtered_subreads.fastq.gz
m170211_224036_42134_c101073082550000001823236402101737_s1_X0_filtered_subreads.fastq.gz  m170315_063041_42134_c101169382550000001823273008151700_s1_p0_filtered_subreads.fastq.gz
m170301_100013_42134_c101174162550000001823269408211761_s1_p0_filtered_subreads.fastq.gz  m170315_124938_42134_c101169382550000001823273008151701_s1_p0_filtered_subreads.fastq.gz
m170301_162825_42134_c101174162550000001823269408211762_s1_p0_filtered_subreads.fastq.gz  m170315_190851_42134_c101169382550000001823273008151702_s1_p0_filtered_subreads.fastq.gz
m170301_225711_42134_c101174162550000001823269408211763_s1_p0_filtered_subreads.fastq.gz

Canu execution command (see the Jupyter Notebook below for more info):

$time canu \
useGrid=false \
-p 20171009_oly_pacbio \
-d /home/data/20171018_oly_pacbio_canu/ \
genomeSize=1.9g \
correctedErrorRate=0.075 \
-pacbio-raw m*

Results:

Well, this took a LONG time to run; a bit over two days!

The report file contains some interesting tidbits. For instance:

  • Unitgigging calculates only 1.84x coverage
  • Trimming removed >5 billion (!!) bases: 867850 reads 5755379456 bases (reads with no overlaps, deleted)
  • Unitigging unassembled: unassembled: 479693 sequences, total length 2277137864 bp

I’ll compare this Canu assembly against Sean’s Canu assembly and see how things look.

Report file (text file): http://owl.fish.washington.edu/Athaliana/20171018_oly_pacbio_canu/20171018_oly_pacbio.report

Contigs Assembly (FASTA): http://owl.fish.washington.edu/Athaliana/20171018_oly_pacbio_canu/20171018_oly_pacbio.contigs.fasta

Complete Canu output directory: http://owl.fish.washington.edu/Athaliana/20171018_oly_pacbio_canu/

Jupyter Notebook (GitHub): 20171018_docker_oly_canu.ipynb

Genome Assembly – Olympia oyster Redundans/Canu vs. Redundans/Racon

Decided to compare the Redundans using Canu as reference and Redundans using Racon as reference. Both reference assemblies were just our PacBio data.

Jupyter notebook (GitHub): 20171005_docker_oly_redundans.ipynb

Notebook is also embedded at the end of this post.

Results:

It should be noted that the paired reads for each of the BGI mate-pair Illumina data did not assemble, just like last time I used them:

  • 160103_I137_FCH3V5YBBXX_L3_WHOSTibkDCABDLAAPEI-62_2.fq.gz
  • 160103_I137_FCH3V5YBBXX_L3_WHOSTibkDCACDTAAPEI-75_2.fq.gz
  • 160103_I137_FCH3V5YBBXX_L4_WHOSTibkDCABDLAAPEI-62_2.fq.gz
  • 160103_I137_FCH3V5YBBXX_L4_WHOSTibkDCACDTAAPEI-75_2.fq.gz
  • 160103_I137_FCH3V5YBBXX_L5_WHOSTibkDCAADWAAPEI-74_2.fq.gz
  • 160103_I137_FCH3V5YBBXX_L6_WHOSTibkDCAADWAAPEI-74_2.fq.gz

Redundans with Canu is better, suggesting that the Canu assembly is the better of the two PacBio assemblies (which we had already suspected).

QUAST comparison using default settings:

Interactive link:http://owl.fish.washington.edu/Athaliana/quast_results/results_2017_10_06_22_21_06/report.html

QUAST comparison using –scaffolds setting:

Interactive link: http://owl.fish.washington.edu/Athaliana/quast_results/results_2017_10_06_22_27_26/report.html

Genome Assembly – Olympia Oyster Redundans with Illumina + PacBio

Redundans should assemble both Illumina and PacBio data, so let’s do that.

Sean had previously performed this – twice actually:

It wasn’t entirely clear how he had run Redundans the first time and the second time he used his Platinus contig FASTA file as the necessary reference assembly when running Redundans.

Since he had produced a good looking assembly from PacBio data using Canu, I decided to give Redundans a rip using that assembly.

I then compared all three Redundans runs using QUAST.

Jupyter notebook (GitHub): 20171004_docker_oly_redundans.ipynb

Notebook is also embedded at the bottom of this notebook entry (but, it should be easier to view at the link provided above).

Of note, is that Redundans didn’t find any alignments for the paired reads for each of the BGI mate-pair Illumina data:

  • 160103_I137_FCH3V5YBBXX_L3_WHOSTibkDCABDLAAPEI-62_2.fq.gz
  • 160103_I137_FCH3V5YBBXX_L3_WHOSTibkDCACDTAAPEI-75_2.fq.gz
  • 160103_I137_FCH3V5YBBXX_L4_WHOSTibkDCABDLAAPEI-62_2.fq.gz
  • 160103_I137_FCH3V5YBBXX_L4_WHOSTibkDCACDTAAPEI-75_2.fq.gz
  • 160103_I137_FCH3V5YBBXX_L5_WHOSTibkDCAADWAAPEI-74_2.fq.gz
  • 160103_I137_FCH3V5YBBXX_L6_WHOSTibkDCAADWAAPEI-74_2.fq.gz

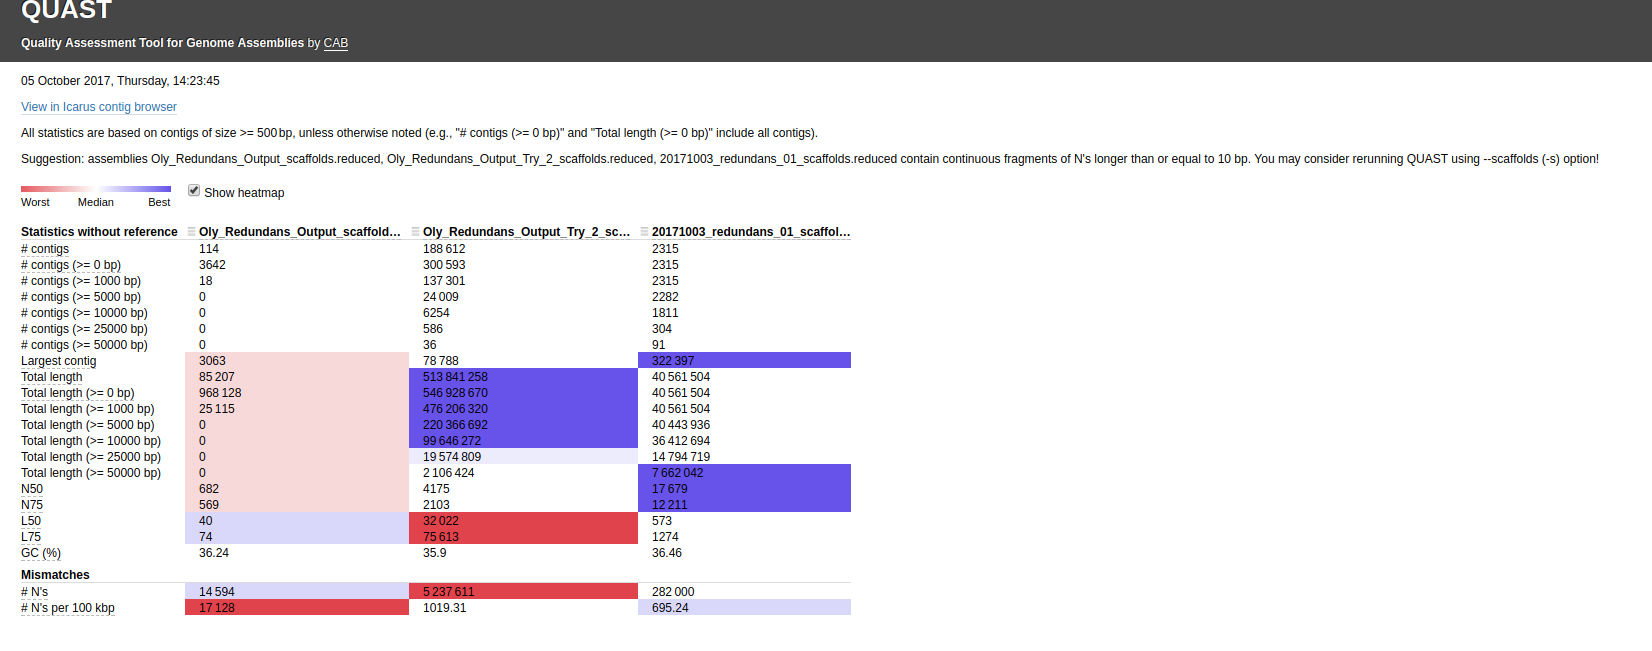
First, I ran QUAST with the default settings:

Interactive link: http://owl.fish.washington.edu/Athaliana/quast_results/results_2017_10_05_14_21_50/report.html

Using that Canu assembly with Redundans certainly seems to results in a better assembly.

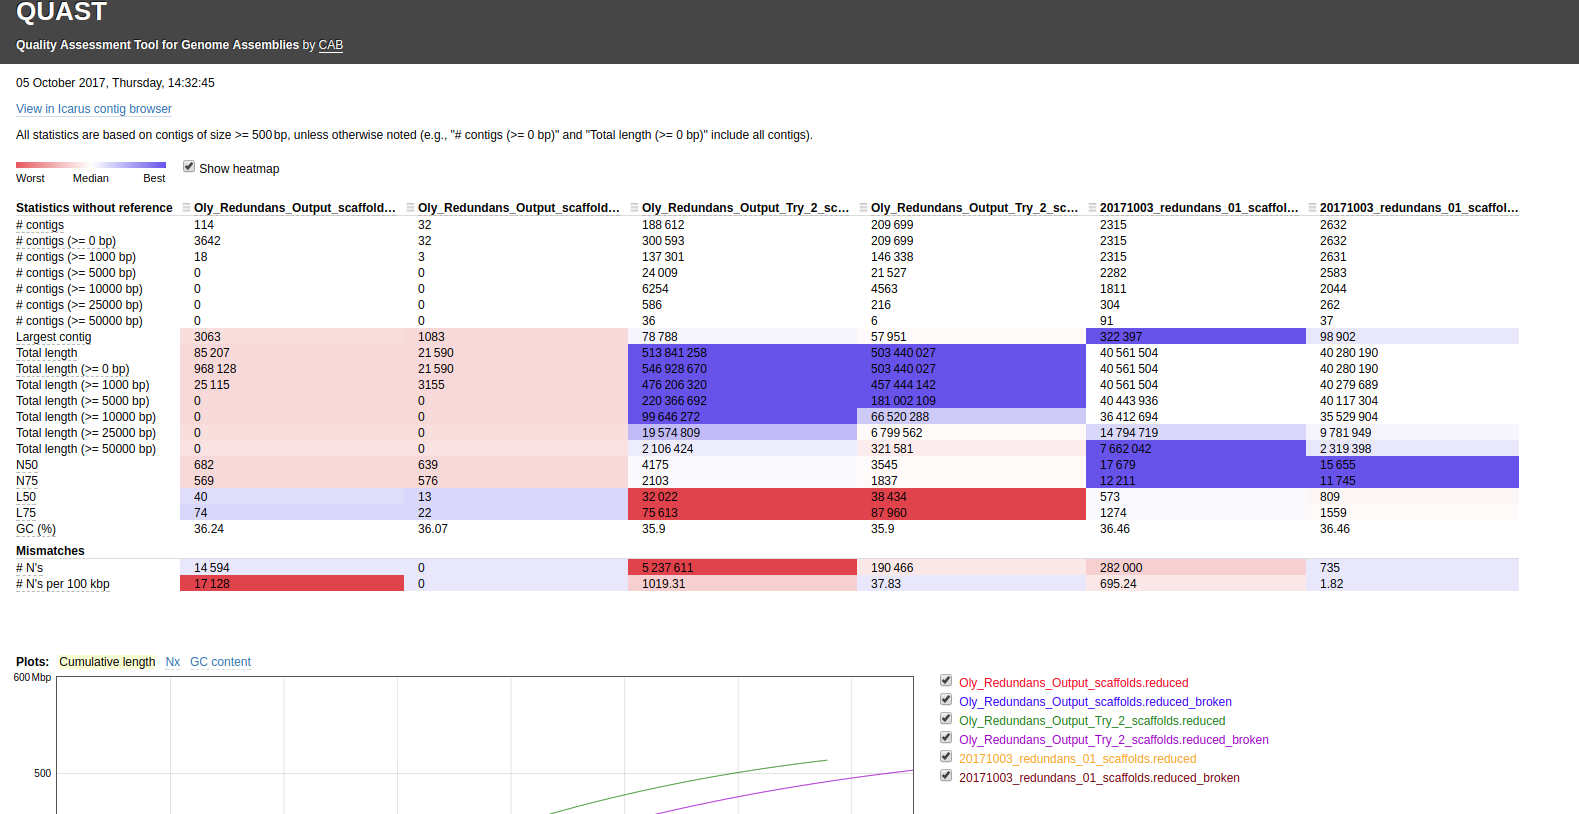
Decided to run QUAST with the –scaffolds option to see what happened:

Interactive link: http://owl.fish.washington.edu/Athaliana/quast_results/results_2017_10_05_14_28_51/report.html

The scaffolds with the “Ns” removed from them are appended with “_broken” – meaning the scaffolds were broken apart into contigs. Things are certainly cleaner when using the --scaffolds option, however, as far as I can tell, QUAST doesn’t actually generate a FASTA file with the “_broken” scaffolds!

Assembly Comparisons – Olympia oyster genome assemblies

— UPDATE 20171009 —

Having run through this a bunch of times now, I realized that the analysis below incorrectly identifies the outputs from Sean’s Redundans runs. The correct output from each of those runs should be the “scaffolds.reduced.fa” FAST files. The “contigs.fa” files that I linked to below are actually the assemblies produced by other programs; which are required as an input for Redudans.


I recently completed an assembly of the UW PacBio sequencing data using Racon and wanted some assembly stats, as well as a way to compare this assembly to the assemblies Sean had completed.

Additionally, Steven recently performed an assembly comparison and I noticed he got some odd results. Specifically, of the three assemblies he compared (PacBio x 1, Illumina x 2), both of the Illumina assemblies had a large quantity of “Ns” in the assemblies. This didn’t seem right and the comparison program he used (QUAST) spit out a message indicating that it seemed like scaffolds were used, instead of contigs. So, I thought I’d give it a shot and see if I could track down non-scaffolded assemblies produced by Sean.

Jupyter notebook (GitHub): 20171003_docker_oly_assembly_comparisons.ipynb

First, I compared the following six assemblies (FASTA files) using QUAST:

Sean’s Assemblies:

Sam’s Assembly:

QUAST output directory: http://owl.fish.washington.edu/Athaliana/20171003_quast_oly_genome_assemblies/

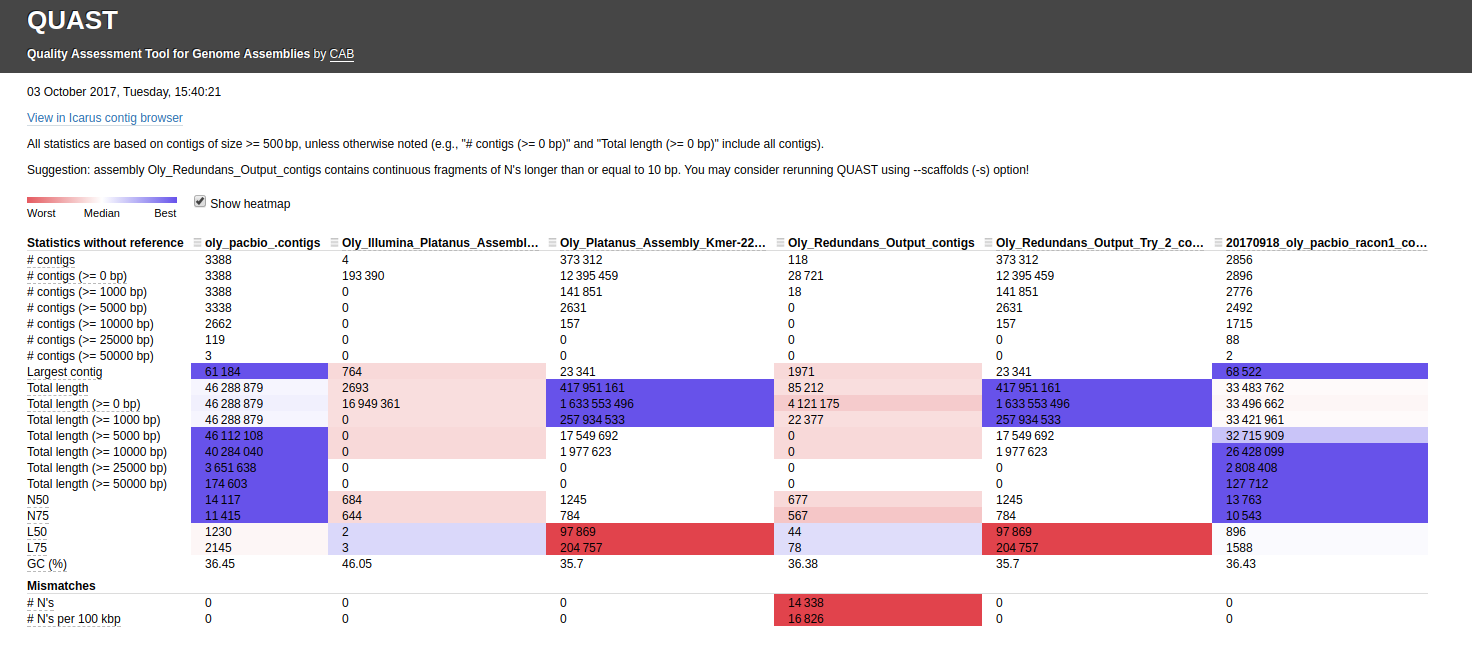
Here’s the assembly comparison of all assemblies (click on image for larger view):

Interactive version of that graphic is here: http://owl.fish.washington.edu/Athaliana/20171003_quast_oly_genome_assemblies/report.html

The first thing that jumps out to me is the fact that two of the Illumina assemblies, which used different assemblers(!!) have the EXACT same assembly stats. This occurrence seems extremely unlikely. I’ve double-checked my Jupyter notebook to make sure that I didn’t assign the same file by accident (see Input #6)

Very strange!

I also noticed that the first Redundans assembly of Sean’s has a ton of “Ns”, suggesting that it’s actually a scaffolded assembly. As with Steven’s QUAST run, QUAST spits out the messages suggesting to use the “–scaffold” option for this file.

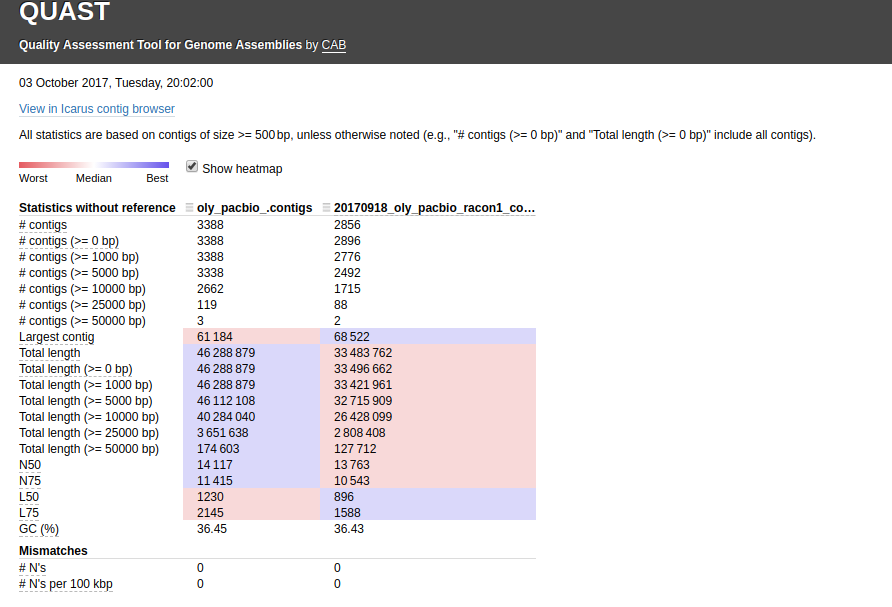
The other thing I noticed is the two PacBio assemblies (Canu & Racon) have a huge difference in the total number of bp (~13,000,000)! I ran a QUAST assembly comparison between just those two for easier viewing/comparison (http://owl.fish.washington.edu/Athaliana/20171003_quast_oly_pacbio_assemblies/):

Interactive version of that graphic is here: http://owl.fish.washington.edu/Athaliana/20171003_quast_oly_pacbio_assemblies/report.html

The fact that there is such a large discrepancy in the total number of bps between these two assemblies really leaves me to believe that I am missing a FASTQ file from my assembly. I’m going to go back and see if that is indeed the case or if this difference in the assemblies is real.

Here’s an embedded version of my Jupyter notebook:

Genome Assembly – Olympia oyster PacBio minimap/miniasm/racon

In this GitHub Issue, Steven had suggested I try out the minimap/miniasm/racon pipeline for assembling our Olympia oyster PacBio data.

I followed the pipeline described by this paper: http://matzlab.weebly.com/uploads/7/6/2/2/76229469/racon.pdf.

Previously, ran the first part of the pipeline: minimap

This notebook entry just contains the miniasm execution. Will follow with racon.

Jupyter Notebook (GitHub): 20170918_docker_pacbio_oly_miniasm0.2.ipynb