Tag Archives: gDNA

DNA Quantification & Quality Assessment – Geoduck & Oly gDNA

Quantified the following samples with the Roberts Lab NanoDrop1000 (ThermoFisher) and assessed DNA integrity on the Seeb Lab Bioanalyzer 2100 (Agilent) using the DNA 12000 chip assay:

Results:

Bioanalyzer Data File (XAD file): 2100 expert_DNA 12000_DE72902486_2015-11-04_15-06-32.xad


OK, there’s a LOT going on here. Will update this notebook with my thoughts sometime tomorrow…


DNA Isolations – Oly Fidalgo 2SN Ctenidia

Isolated DNA from 24 2SN ctenidia samples from Friday’s sampling (#32 – 55). Samples were thawed at RT.

DNA was isolated using the E.Z.N.A. Mollusc Kit (Omega BioTek) according to the manufacturer’s protocol with the following changes:

  • Samples were incubated @ 60C for only 1hr, per Steven’s recommendation (an attempt to prevent degradation)
  • No optional steps were performed
  • Used 300μL of MBL Buffer for all samples (this was more than the recovered volume of aqueous phase from each sample)
  • Single elution of 50μL

Samples were stored @ -20C in: Oly gDNA Oly Reciprocal Transplant Final Sampling Box #1.

Some notes:

  • Total time (including 1hr incubation): 4.5hrs.
  • Short incubation time did not completely digest samples
  • Partial tissue digestions led to difficulties in recovering entire aqueous phase, post chloroform treatment


DNA Isolation – Geoduck & Olympia Oyster

Amazingly, we need more gDNA for the two genome sequencing projects (geoduck and Olympia oyster). Used geoduck adductor muscle sample from Box 1 of the geoduck samples collected by Brent & Steven on 20150811. Used Olympia oyster ctenidia from Box 1 of adductor muscle sample collected by Brent & Steven on 20150812.

Tissues were split in approximately half, minced and transferred to tubes with 1mL of DNAzol + 50μg/mL of Proteinase K (Fermentas). Previously, I had just homogenized samples. I’m hoping that the overnight digestion with Proteinase K will help increase yields from these.

Tissue weights:

  • Geoduck adductor muscle tube 1: 292mg (gone)
  • Geoduck adductor muscle tube 2: 320mg (gone)
  • Olympia oyster ctenidia tube 1: 135mg (gone)
  • Olympia oyster ctenidia tube 2: 130mg (gone)

Samples were isolated using DNAzol (Molecular Research Center) according to the manufacturer’s protocol, with the following adjustments:


  • Samples were incubated O/N @ RT on a rotator.
  • After Proteinase K digestion, added 40μL RNAse A (100mg/mL) and incubated @ RT for 15mins.
  • Performed optional centrifugation step (10,000g, 10mins @ RT)
  • Initial pellet wash was performed using a 70%/30% DNAzol/EtOH
  • Pellets were resuspended Buffer EB (Qiagen)

Resuspension volume = 500μL total for each species

Samples were incubated O/N at RT to facilitate pellet resuspension.

NOTE: Geoduck “pellets” were not very DNA pellet-like. Very loose, white, and sort of disintegrate (but not dissolve in solution) when attempted to resuspend.

Adaptor Ligation – Oly AlfI-Digested gDNA for RAD-seq

Continued to follow the 2bRAD protocol (PDF) developed by Eli Meyer’s lab.

Digested DNA from yesterday was heat inactivated for 10mins @ 65C and was not run out on a gel due to the fact that the input gDNA was degraded and a shift in the high molecular weight band (indicating the digestion was successful) would not exist because a high molecular weight band is absent in these samples.


Anneal Adaptors

After preparing the two adaptors below, they were incubated for 10mins @ RT:

  • Adaptor 1 (2μM final concentration of each oligo): 1.5μL of 5ILL-NR (100μM) + 1.5μL of anti-ILL (100μM) + 72μL H2O = 75μL total
  • Adaptor 2 (2μM final concentration of each oligo): 1.5μL of 3ILL-NR (100μM) + 1.5μL of anti-ILL (100μM) + 72μL H2O = 75μL total

After annealing, the adaptors were stored on ice.


Adaptor Ligation

All components were stored on ice. Ligation reactions were prepared on ice and performed in 0.5mL snap cap tubes.

REAGENT SINGLE REACTION (μL) x11
Digested DNA 10 NA
ATP (10mM) 1 11
10x T4 Ligase Buffer 4 44
Adaptor 1 (2μM) 5 55
Adaptor 2 (2μM) 5 55
T4 DNA Ligase 1 11
NanoPure H2O 24 264
TOTAL 50 440

Combined 40μL of the master mix with 10μL of AlfI-digested DNA in a 0.5mL snap cap tube.

Incubated ligation reaction @ 16C O/N in PTC-200 thermal cycler (MJ Research) – no heated lid.

Ligations will be stored @ -20C until I can continue working with them on Tuesday.

Restriction Digest – Oly gDNA for RAD-seq w/AlfI

The previous attempt at making these RAD libraries failed during the prep-scale PCR, likely due to a discrepancy in the version of the Meyer Lab protocol I was following, so I have to start at the beginning to try to make these libraries again.

Since the input DNA is so degraded, I’ve repeated this using 9μg of input DNA (instead of the recommended 1.2μg). This should increase the number of available cleavage sites for AlfI, thus improving the number of available ligation sites for the adaptors.

Used a subset (10 samples) from the Ostrea lurida gDNA isolated 20150916 to prepare RAD libraries.

Followed the 2bRAD protocol (PDF) developed by Eli Meyer’s lab.

Prepared 9.0μg of each of the following samples in a volume of 9.5μL:

Google Sheet: 20151028_RADseq_DNA_calcs


Prepared master mix for restriction enzyme reaction:

REAGENT SINGLE REACTION (μL) x11
DNA 9.5 NA
10x Buffer R 1.2μL 13.2μL
150μM SAM 0.8μL 8.8μL
AlfI 0.5μL 5.5μL


Combined 2.5μL of the master mix with 9.5μL of each DNA sample in 0.5mL snap cap tubes. Incubated @ 37C O/N in thermal cycler (PTC-200; no heated lid).

Restriction Digest – Oly gDNA for RAD-seq w/AlfI

Previously initiated the RAD-seq procedure for the sample set described below. However, the test scale PCR yielded poor results. Katherine Silliman suggested that the poor performance of the test scale PCR was likely due to low numbers of adaptor-ligated fragments. Since the input DNA is so degraded, I’ve repeated this using 9μg of input DNA (instead of the recommended 1.2μg). This should increase the number of available cleavage sites for AlfI, thus improving the number of available ligation sites for the adaptors.

Used a subset (10 samples) from the Ostrea lurida gDNA isolated 20150916 to prepare RAD libraries.

Followed the 2bRAD protocol (PDF) developed by Eli Meyer’s lab.

Prepared 9.0μg of each of the following samples in a volume of 10μL:

Google Sheet: 20151009_RADseq_DNA_calcs


Prepared a 150μM working stock of the SAM buffer needed for the restriction digestion by diluting 30μL of the supplied stock (500μM) in 70μL NanoPure H2O (total volume = 100μL). This working stock was stored @ -20C in FTR 209 in the “RAD-seq Reagents” box.

Prepared master mix for restriction enzyme reaction:

REAGENT SINGLE REACTION (μL) x11
DNA 8 NA
10x Buffer R 1.2μL 13.2μL
150μM SAM 0.8μL 8.8μL
AlfI 0.5μL 5.5μL
H2O 1.5μL 16.5μL


Combined 4μL of the master mix with 8μL of each sample in 0.5mL snap cap tubes. Incubated @ 37C 2hrs. in thermal cycler (PTC-200; no heated lid). Heat inactivated the digest @ 65C for 10mins.

Sample Submission – Additional Geoduck gDNA for Genome Sequencing @ BGI

Previous shipment of gDNA proved to be of insufficient quantity when assessed by BGI, so needed to isolate more.

Shipped the pooled gDNA we’ve been accumulating to BGI to contine the geoduck genome sequencing project.

Sample was shipped on dry ice with the appropriate paperwork required by BGI (sample declaration letter).

Assigned BGI Lot: 1510071003

Agarose Gel – Geoduck & Olympia Oyster gDNA

Needed to assess the integrity of the newest gDNA isolated for the two genome sequencing projects: Geoduck gDNA from earlier today and Olympia oyster gDNA from 20151002.

Also needed to assess the integrity of the gDNA of ethanol-preserved Olympia oyster mantle tissue from Jake’s reciprocal transplant experiment, isolated on 20151002: samples NF1A & SN49A.

Ran samples on a 0.8% agarose, 1X modified TAE gel.

Loaded 1μL (~300ng) of the geoduck, Oly and NF1A samples.

Loaded 2μL (~100ng) of the SN49A sample.
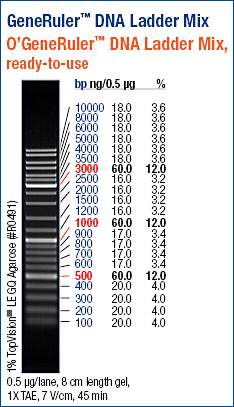
Used 5μL of ladder.

Results:


Genome Sequencing Samples

The geoduck and the Oly samples look good. Intact, high molecular weight band. My only concern is the noticeable difference in band intensities between these two. Both samples should be ~300ng/μL, based on the NanoDrop1000 readings. However, it’s evident that the concentrations of these two samples differ greatly. Additionally, we can use the ladder to gauge the concentrations of the samples, since I loaded 0.5μg of the ladder, which is the quantity referenced on the ladder guide above.

It would appear that the geoduck sample concentration is closer to 60ng/μL (band intensity is similar to that of the 500, 1000, & 3000bp markers), as opposed to the 292ng/μL that the NanoDrop1000 indicated.

The Oly sample appears to have even less and appears less intense than the lowest concentration bands on the marker (16.0ng/μL). That’s not even remotely close to the 331ng/μL measured by the NanoDrop1000.

It’s difficult to say why this might be, as both samples were RNased and neither of them show extensive smearing (both of those factors would contribute to inflated spec readings).

Regardless, will ship them off to BGI to supplement the previous gDNA for this project.

Ethanol-Preserved Samples

Both samples show extensive smearing and no high molecular weight band, indicating they are both completely degraded. This is a very bad result for this project, as the tissue in this group is/was a bit of grasping at straws to obtain some intact DNA to use for the RAD-seq that we intend to pursue.

DNA Quantification – Pooled geoduck gDNA

Pooled the gDNA samples from earlier today & from 20151002.

The pooled volume = 260μL

Quantified on the Roberts Lab NanoDrop1000.

Results:


Besides the weird peak at 240nm, everything looks great – perfect 260/280 & 260/230 ratios.

Yield = 75.92μg

This gDNA has been RNase treated, so the concentration should be semi-accurate. Regardless, even if there’s a discrepancy of 50%, this should provide enough additional DNA for BGI to work with.

Will run on gel to evaluate integrity and then send to BGI.