Tag Archives: Eastern oyster

DNA Sonication & Bioanalzyer – C. virginica gDNA for MeDIP

I transferred 8ug (136uL) of Crassotrea virginica gDNA (isolated earlier today) to two separate 1.7mL snap cap tubes for sonication/shearing.

I performed shearing at the NOAA Northwest Fisheries Science Center, using the Qsonica Q800R. Mackenzie Gavery assisted me.

Target fragment size was ~500bp.

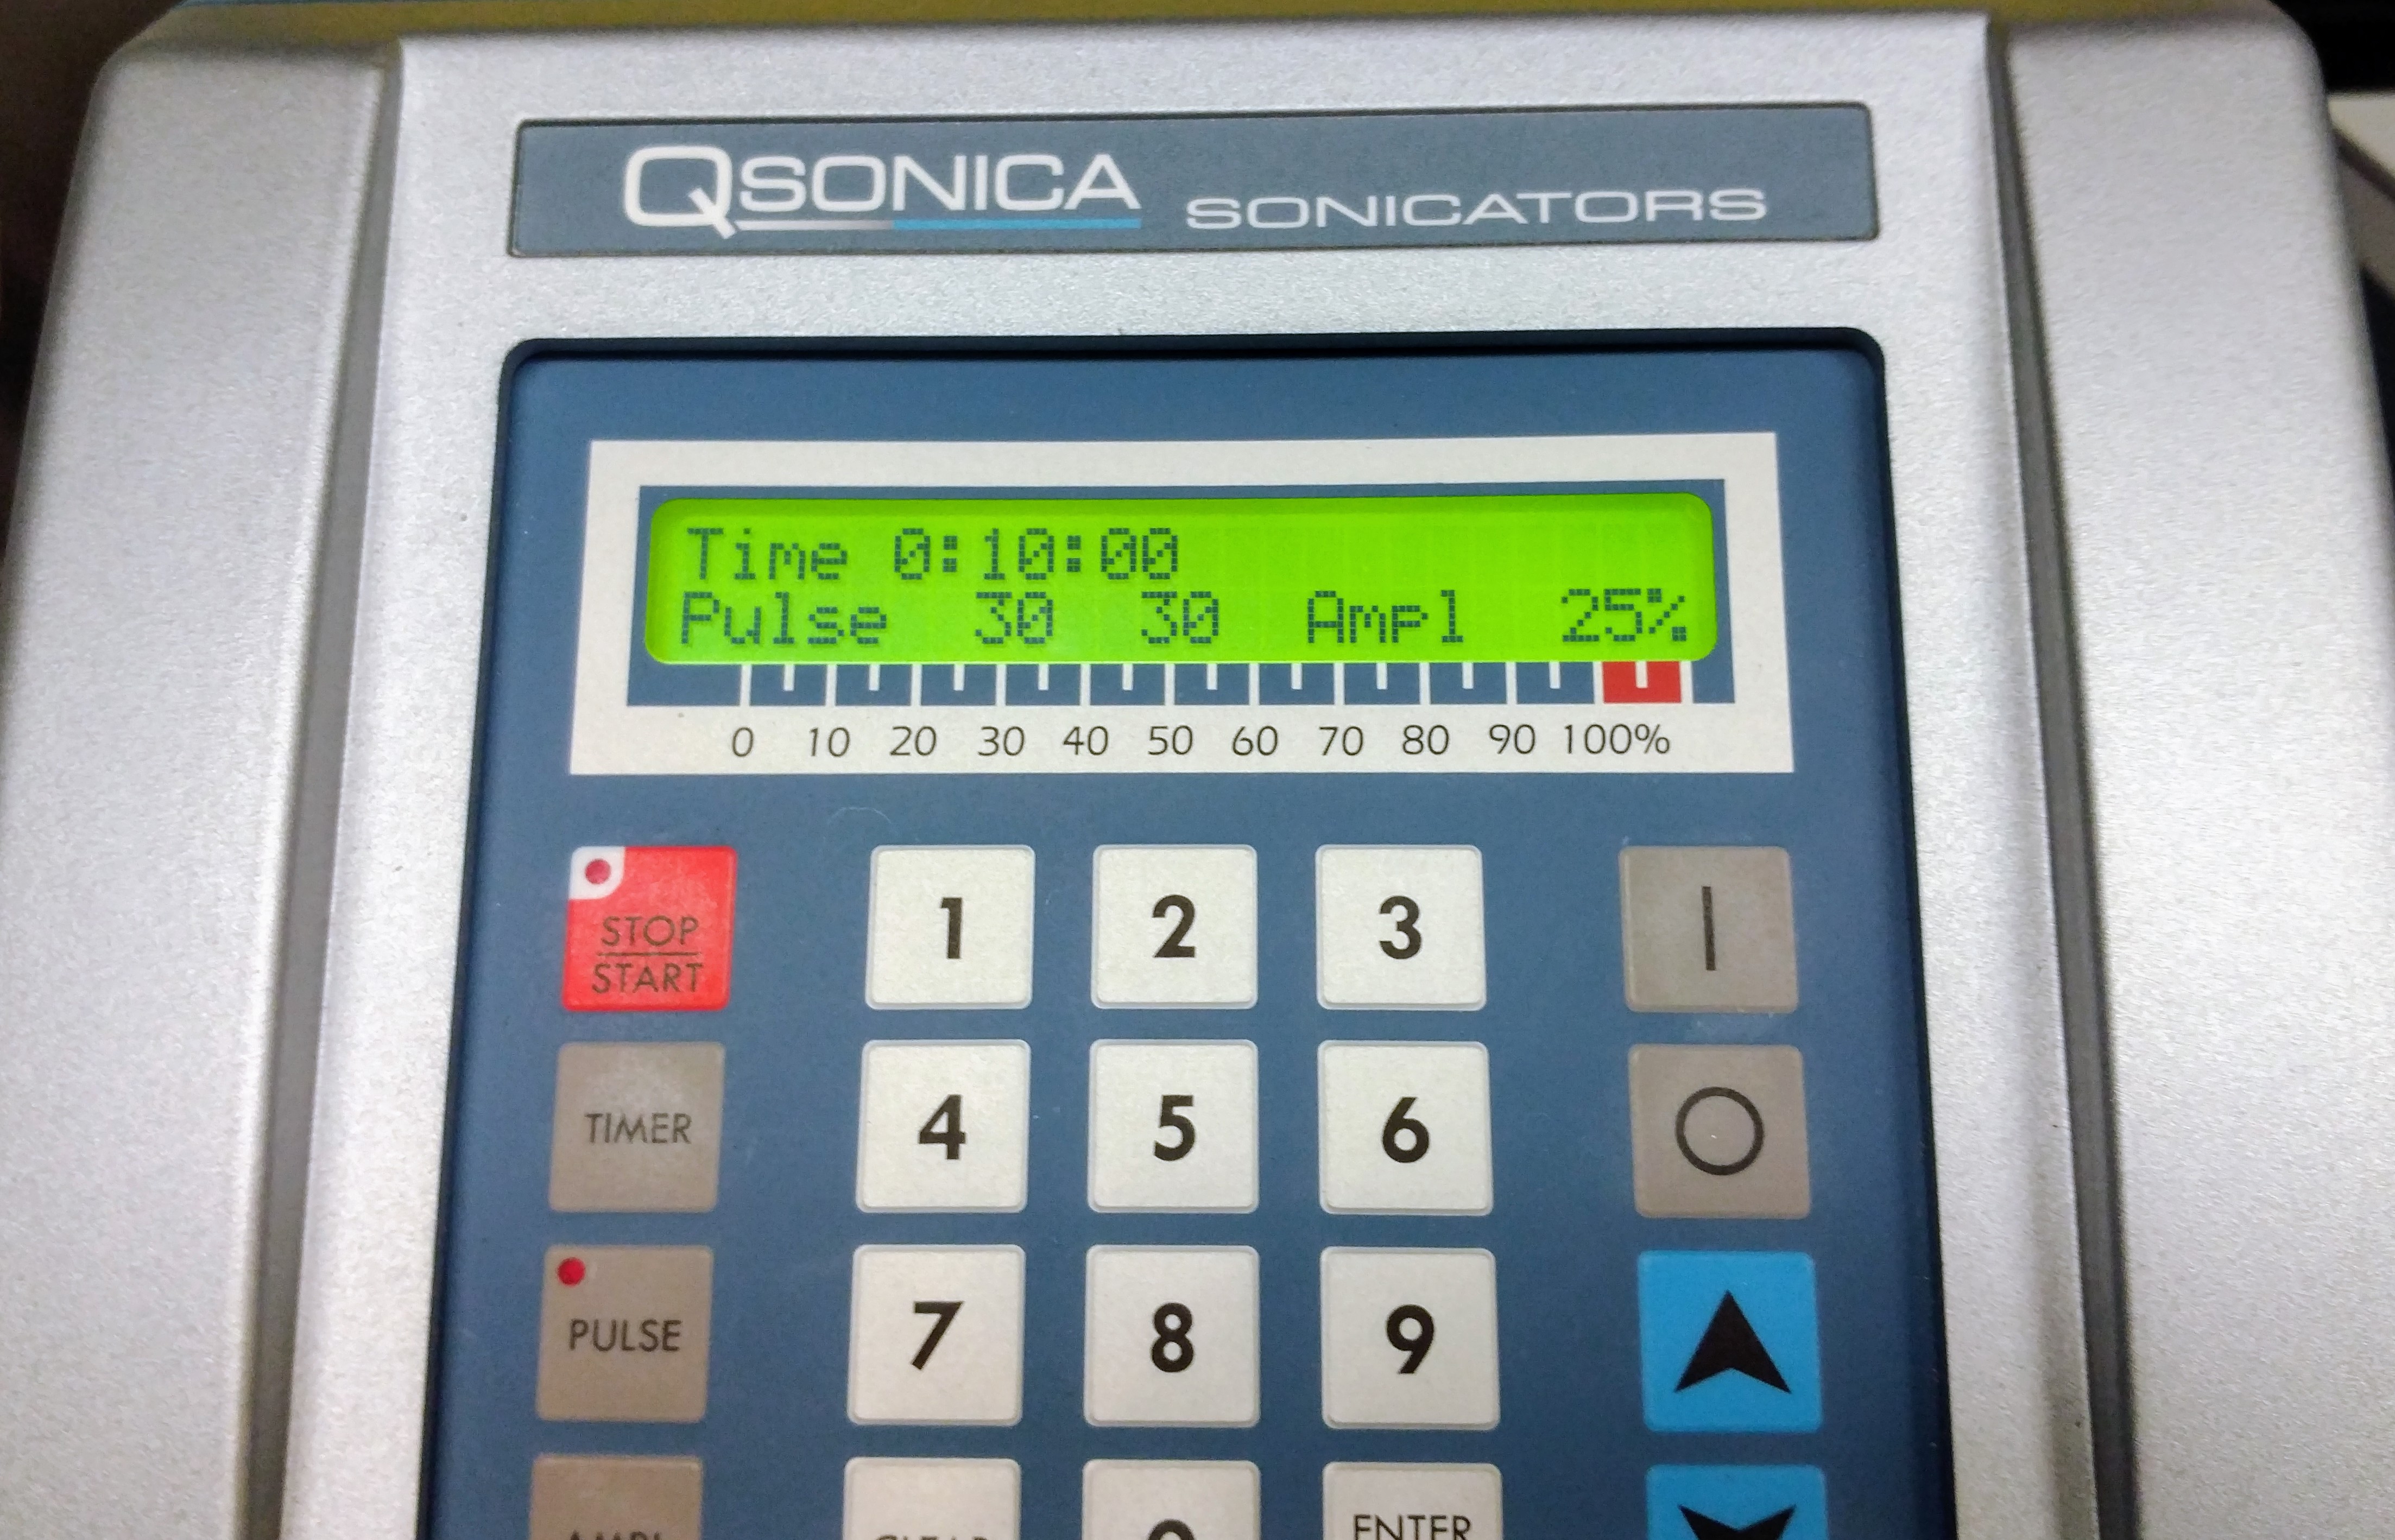
Samples were run at the same time with the following settings:

  • 10 minutes
  • 30 seconds on, 30 seconds off
  • 25% power

After sonication, fragmentation was assessed using the Seeb Lab’s Bioanlyzer 2100 (Agilent) and the DNA 12000 Chip Kit (Agilent). NOTE: All of the reagents and the chips were past their expiration dates (most in June 2016).

Results:

Agilent 2100 Bioanalyzer Expert file (XAD): 2100 expert_DNA 12000_DE72902486_2017-12-11_13-45-31.xad

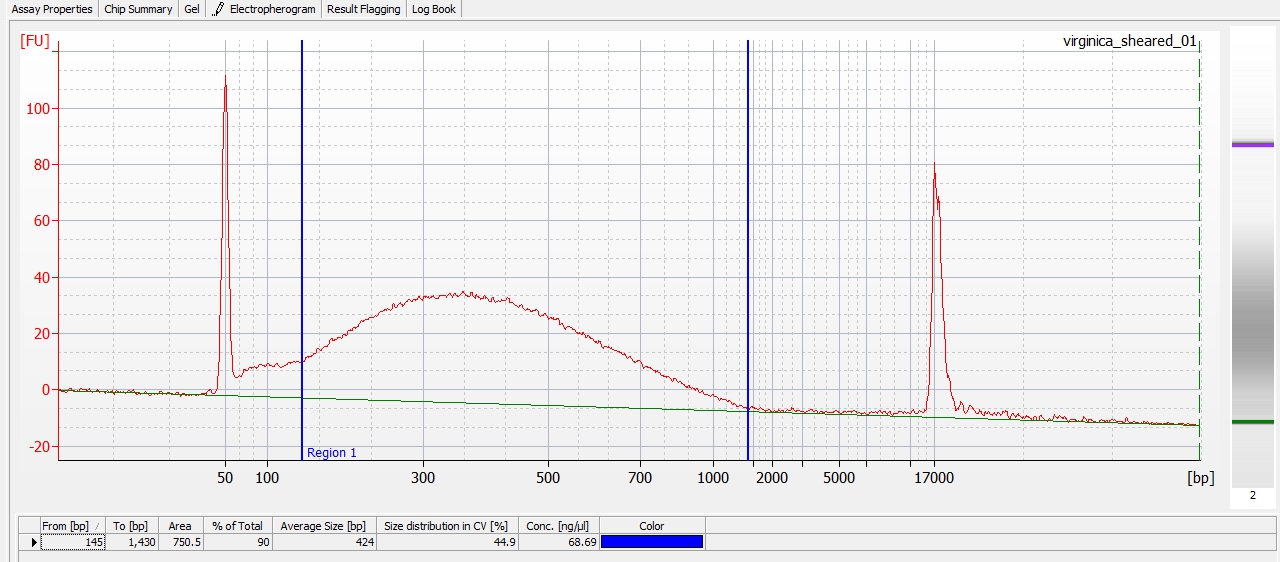
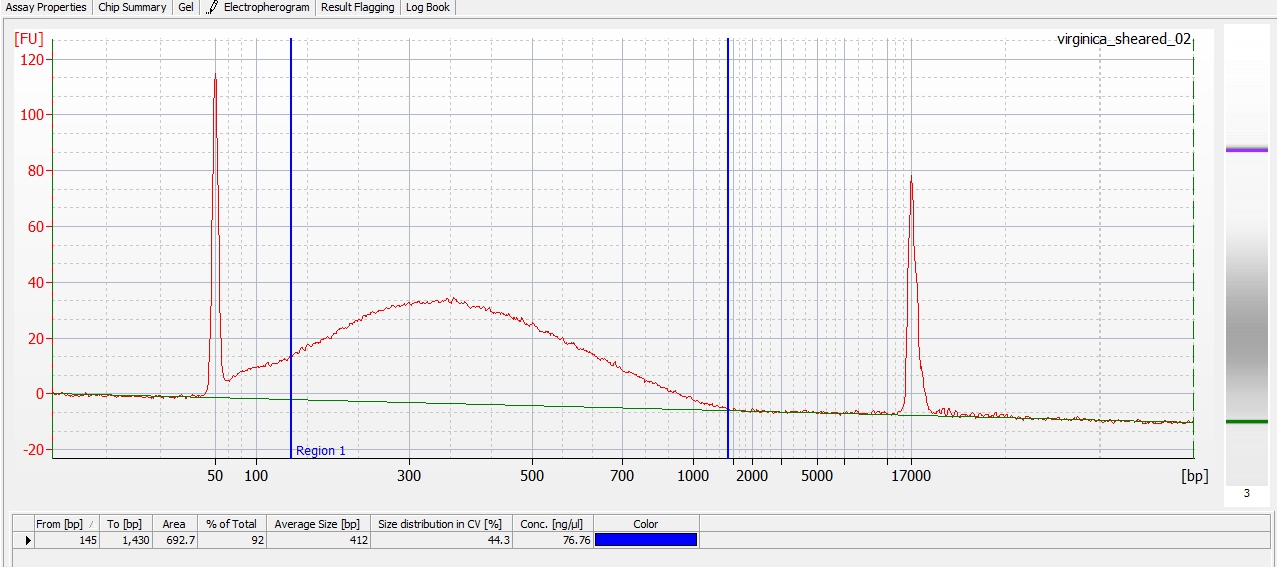
Fragmentation was successful, and pretty consistent.

Both samples appear to have an average fragment size of ~420bp. Will proceed with MeDIP, once reagents are received.

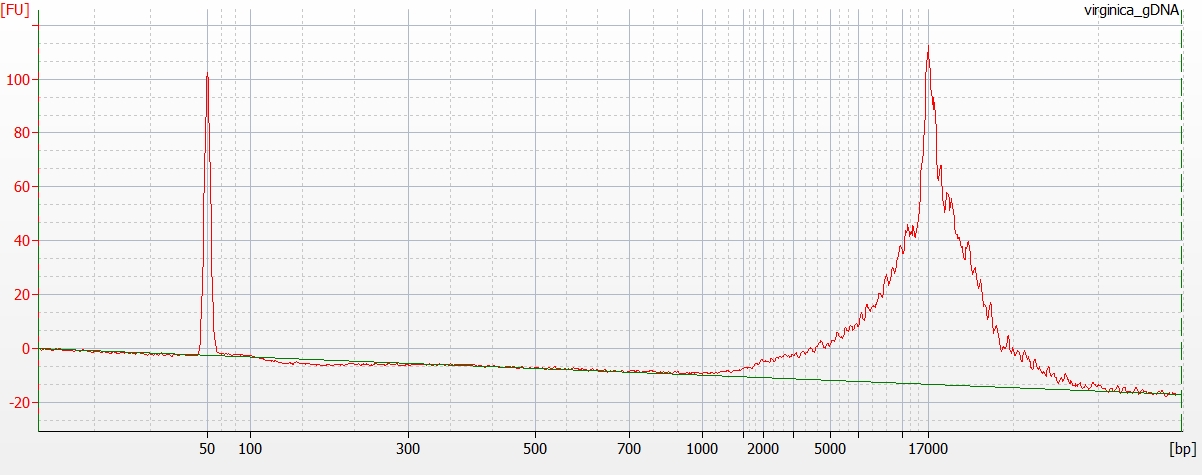
Unsheared gDNA:

DNA Isolation & Quantification – Crassostrea virginica Mantle gDNA

DNA was isolated from a single adult Eastern oyster (Crassostrea virginica) for a pilot project with Qiagen to test their new DNA bisulfite conversion kit. The oyster was obtained yesterday afternoon (20171210) from the Taylo rShellfish Pioneer Square location. The oyster was stored @ 4C O/N.

The oyster was shucked and four pieces of upper mantle tissue (~35mg each) were snap frozen in liquid nitrogen (LN2). Tissues were pulverized under LN2 and then DNA was isolated separately from each sample using the E.Z.N.A. Mollusc DNA Kit (Omega) according to the manufcaturer’s protocol.

Samples were eluted with 100uL of Elution Buffer and were pooled into a single tube.

The gDNA was quantified using the Qubit 3.0 (Invitrogen) and Qubit dsDNA Broad Range Kit (Invitrogen), using 5uL of sample.

Results:

Qubit (Google Sheet): 20171211_qubit_virginica_DNA

Concentration is 58.4ng/uL.

That makes the total yield ~23.36ug (23360ng). This is more than enough to perform two separate MeDIP preps and two separate reduced representation digestions with MspI.

Will proceed with shearing of DNA for MeDIP.

Goals – May 2015

Here are the things I plan to tackle throughout the month of May:

Geoduck Reproductive Development Transcriptomics

My primary goal for this project is to successfully isolate RNA from the remaining, troublesome paraffin blocks that have yet to yield any usable RNA. The next approach to obtain usable quantities of RNA is to directly gouge tissue from the blocks instead of sectioning the blocks (as recommended in the PAXgene Tissue RNA Kit protocol). Hopefully this approach will eliminate excess paraffin, while increasing the amount of input tissue. Once I have RNA from the entire suite of samples, I’ll check the RNA integrity via Bioanalyzer and then we’ll decide on a facility to use for high-throughput sequencing.


BS-Seq Illumina Data Assembly/Mapping

Currently, there are two projects that we have performed BS-Seq with (Crassostrea gigas larvae OA (2011) bisulfite sequencing and LSU C.virginica Oil Spill MBD BS Sequencing) and we’re struggling to align sequences to the C.gigas genome. Granted, the LSU samples are C.virginica, but the C.gigas larvae libraries are not aligning to the C.gigas genome via standard BLASTn or using a dedicated bisulfite mapper (e.g. BS-Map). I’m currently BLASTing a de-novo assembly of the C.gigas larvae OA 400ppm sequencing that Steven made against the NCBI nt DB in an attempt to assess the taxonomic distribution of the sequences we received back. I’ll also try using a different bisulfite mapper, bismark, that Mackenzie Gavery has previously used and has had better results with than BS-Map.


C.gigas Heat Stress MeDIP/BS-Seq

As part of Claire’s project, there’s still some BS-Seq data that would be nice to have to complement the data she generated via microarray. It would be nice to make a decision about how to proceed with the samples. However, part of our decision on how to proceed is governed by the results we get from the two projects above. Why do those two projects impact the decision(s) regarding this project? They impact this project because in the two projects above, we produced our own BS-Seq libraries. This is extremely cost effective. However, if we can’t obtain usable data from doing the library preps in-house, then that means we have to use an external service provider. Using an external company to do this is significantly more expensive. Additionally, not all companies can perform bisulfite treatment, which limits our choices (and, in turn, pricing options) on where to go for sequencing.


Miscellany

When I have some down time, I’ll continue working on migrating my Wikispaces notebook to this notebook. I only have one year left to go and it’d be great is all my notebook entries were here so they’d all be tagged/categorized and, thus, be more searchable. I’d also like to work on adding README files to our plethora of electronic data folders. Having these in place will greatly facilitate the ability of people to quickly and more easily figure out what these folders contain, file formats within those folders, etc. I also have a few computing tips/tricks that I’d like to add to our Github “Code” page. Oh, although this isn’t really lab related, I was asked to teach the Unix shell lesson (or, at least, part of it) at the next Software Carpentry Workshop that Ben Marwick is setting up at UW in early June. So, I’m thinking that I’ll try to incorporate some of the data handling stuff I’ve been tackling in lab in to the lesson I end up teaching. Additionally, going through the Software Carpentry materials will help reinforce some of the “fundamental” tasks that I can do with the shell (like find, cut and grep).

In the lab, I plan on sealing up our nearly overflowing “Broken Glass” box and establishing a new one. I need to autoclave, and dispose of, a couple of very full biohazard bags. I’m also going to vow that I will get Jonathan to finally obtain a successful PCR from his sea pen RNA.

Quality Trimming – LSU C.virginica Oil Spill MBD BS-Seq Data

Jupyter (IPython) Notebook: 20150414_C_virginica_LSU_Oil_Spill_Trimmomatic_FASTQC.ipynb

NBviewer: 20150414_C_virginica_LSU_Oil_Spill_Trimmomatic_FASTQC.ipynb

Trimmed FASTQC

NB3 No oil Index – ACAGTG

20150414_trimmed_2112_lane1_ACAGTG_L001_R1_001_fastqc.html
20150414_trimmed_2112_lane1_ACAGTG_L001_R1_002_fastqc.html

NB6 No oil Index – GCCAAT

20150414_trimmed_2112_lane1_GCCAAT_L001_R1_001_fastqc.html
20150414_trimmed_2112_lane1_GCCAAT_L001_R1_002_fastqc.html

NB11 No oil Index – CAGATC

20150414_trimmed_2112_lane1_CAGATC_L001_R1_001_fastqc.html
20150414_trimmed_2112_lane1_CAGATC_L001_R1_002_fastqc.html
20150414_trimmed_2112_lane1_CAGATC_L001_R1_003_fastqc.html

HB2 25,000ppm oil Index – ATCACG

20150414_trimmed_2112_lane1_ATCACG_L001_R1_001_fastqc.html
20150414_trimmed_2112_lane1_ATCACG_L001_R1_002_fastqc.html
20150414_trimmed_2112_lane1_ATCACG_L001_R1_003_fastqc.html

HB16 25,000ppm oil Index – TTAGGC

20150414_trimmed_2112_lane1_TTAGGC_L001_R1_001_fastqc.html
20150414_trimmed_2112_lane1_TTAGGC_L001_R1_002_fastqc.html

HB30 25,000ppm oil Index – TGACCA

20150414_trimmed_2112_lane1_TGACCA_L001_R1_001_fastqc.html

Sequence Data Analysis – LSU C.virginica Oil Spill MBD BS-Seq Data

Performed some rudimentary data analysis on the new, demultiplexed data downloaded earlier today:

2112_lane1_ACAGTG_L001_R1_001.fastq.gz
2112_lane1_ACAGTG_L001_R1_002.fastq.gz
2112_lane1_ATCACG_L001_R1_001.fastq.gz
2112_lane1_ATCACG_L001_R1_002.fastq.gz
2112_lane1_ATCACG_L001_R1_003.fastq.gz
2112_lane1_CAGATC_L001_R1_001.fastq.gz
2112_lane1_CAGATC_L001_R1_002.fastq.gz
2112_lane1_CAGATC_L001_R1_003.fastq.gz
2112_lane1_GCCAAT_L001_R1_001.fastq.gz
2112_lane1_GCCAAT_L001_R1_002.fastq.gz
2112_lane1_TGACCA_L001_R1_001.fastq.gz
2112_lane1_TTAGGC_L001_R1_001.fastq.gz
2112_lane1_TTAGGC_L001_R1_002.fastq.gz


Compared total amount of data (in gigabytes) generated from each index. The commands below send the output of the ‘ls -l’ command to awk. Awk sums the file sizes, found in the 5th field ($5) of the ‘ls -l’ command, then prints the sum, divided by 1024^3 to convert from bytes to gigabytes.

Index: ACAGTG

$ls -l 2112_lane1_AC* | awk '{sum += $5} END {print sum/1024/1024/1024}'
1.49652


Index: ATCACG

$ls -l 2112_lane1_AT* | awk '{sum += $5} END {print sum/1024/1024/1024}'
3.02269


Index: CAGATC

$ls -l 2112_lane1_CA* | awk '{sum += $5} END {print sum/1024/1024/1024}'
3.49797


Index: GCCAAT

$ls -l 2112_lane1_GC* | awk '{sum += $5} END {print sum/1024/1024/1024}'
2.21379


Index: TGACCA

$ls -l 2112_lane1_TG* | awk '{sum += $5} END {print sum/1024/1024/1024}'
0.687374


Index: TTAGGC

$ls -l 2112_lane1_TT* | awk '{sum += $5} END {print sum/1024/1024/1024}'
2.28902


Ran FASTQC on the following files downloaded earlier today. The FASTQC command is below. This command runs FASTQC in a for loop over any files that begin with “2212_lane2_C” or “2212_lane2_G” and outputs the analyses to the Arabidopsis folder on Eagle:

$for file in /Volumes/nightingales/C_virginica/2112_lane1_[ATCG]*; do fastqc "$file" --outdir=/Volumes/Eagle/Arabidopsis/; done


From within the Eagle/Arabidopsis folder, I renamed the FASTQC output files to prepend today’s date:

$for file in 2112_lane1_[ATCG]*; do mv "$file" "20150413_$file"; done


Then, I unzipped the .zip files generated by FASTQC in order to have access to the images, to eliminate the need for screen shots for display in this notebook entry:

$for file in 20150413_2112_lane1_[ATCG]*.zip; do unzip "$file"; done


The unzip output retained the old naming scheme, so I renamed the unzipped folders:

$for file in 2112_lane1_[ATCG]*; do mv "$file" "20150413_$file"; done


The FASTQC results are linked below:

20150413_2112_lane1_ACAGTG_L001_R1_001_fastqc.html
20150413_2112_lane1_ACAGTG_L001_R1_002_fastqc.html
20150413_2112_lane1_ATCACG_L001_R1_001_fastqc.html
20150413_2112_lane1_ATCACG_L001_R1_002_fastqc.html
20150413_2112_lane1_ATCACG_L001_R1_003_fastqc.html
20150413_2112_lane1_CAGATC_L001_R1_001_fastqc.html
20150413_2112_lane1_CAGATC_L001_R1_002_fastqc.html
20150413_2112_lane1_CAGATC_L001_R1_003_fastqc.html
20150413_2112_lane1_GCCAAT_L001_R1_001_fastqc.html
20150413_2112_lane1_GCCAAT_L001_R1_002_fastqc.html
20150413_2112_lane1_TGACCA_L001_R1_001_fastqc.html
20150413_2112_lane1_TTAGGC_L001_R1_001_fastqc.html
20150413_2112_lane1_TTAGGC_L001_R1_002_fastqc.html


Sequence Data – LSU C.virginica Oil Spill MBD BS-Seq Demultiplexed

I had previously contacted Doug Turnbull at the Univ. of Oregon Genomics Core Facility for help demultiplexing this data, as it was initially returned to us as a single data set with “no index” (i.e. barcode) set for any of the libraries that were sequenced. As it turns out, when multiplexed libraries are sequenced using the Illumina platform, an index read step needs to be “enabled” on the machine for sequencing. Otherwise, the machine does not perform the index read step (since it wouldn’t be necessary for a single library). Surprisingly, the sample submission form for the Univ. of Oregon Genomics Core Facility  doesn’t request any information regarding whether or not a submitted sample has been multiplexed. However, by default, they enable the index read step on all sequencing runs. I provided them with the barcodes and they demultiplexed them after the fact.

I downloaded the new, demultiplexed files to Owl/nightingales/C_virginica:

lane1_ACAGTG_L001_R1_001.fastq.gz
lane1_ACAGTG_L001_R1_002.fastq.gz
lane1_ATCACG_L001_R1_001.fastq.gz
lane1_ATCACG_L001_R1_002.fastq.gz
lane1_ATCACG_L001_R1_003.fastq.gz
lane1_CAGATC_L001_R1_001.fastq.gz
lane1_CAGATC_L001_R1_002.fastq.gz
lane1_CAGATC_L001_R1_003.fastq.gz
lane1_GCCAAT_L001_R1_001.fastq.gz
lane1_GCCAAT_L001_R1_002.fastq.gz
lane1_TGACCA_L001_R1_001.fastq.gz
lane1_TTAGGC_L001_R1_001.fastq.gz
lane1_TTAGGC_L001_R1_002.fastq.gz

Notice that the file names now contain the corresponding index!

Renamed the files, to append the order number to the beginning of the file names:

$for file in lane1*; do mv "$file" "2112_$file"; done

New file names:

2112_lane1_ACAGTG_L001_R1_001.fastq.gz
2112_lane1_ACAGTG_L001_R1_002.fastq.gz
2112_lane1_ATCACG_L001_R1_001.fastq.gz
2112_lane1_ATCACG_L001_R1_002.fastq.gz
2112_lane1_ATCACG_L001_R1_003.fastq.gz
2112_lane1_CAGATC_L001_R1_001.fastq.gz
2112_lane1_CAGATC_L001_R1_002.fastq.gz
2112_lane1_CAGATC_L001_R1_003.fastq.gz
2112_lane1_GCCAAT_L001_R1_001.fastq.gz
2112_lane1_GCCAAT_L001_R1_002.fastq.gz
2112_lane1_TGACCA_L001_R1_001.fastq.gz
2112_lane1_TTAGGC_L001_R1_001.fastq.gz
2112_lane1_TTAGGC_L001_R1_002.fastq.gz

Updated the checksums.md5 file to include the new files (the command is written to exclude the previously downloaded files that are named “2112_lane1_NoIndex_”; the [^N] regex excludes any files that have a capital ‘N’ at that position in the file name):

$for file in 2112_lane1_[^N]*; do md5 "$file" >> checksums.md5; done

Updated the readme.md file to reflect the addition of these new files.


Epinext Adaptor 1 Counts – LSU C.virginica Oil Spill Samples

Before contacting the Univ. of Oregon facility for help with this sequence demultiplexing dilemma, I contacted Epigentek to find out what the other adaptor sequence that is used in the EpiNext Post-Bisulfite DNA Library Preparation Kit (Illumina). I used grep and fastx_barcode_splitter to determine how many reads (if any) contained this adaptor sequence. All analysis was performed in the embedded Jupyter (IPython) notebook embedded below.

NBviewer: 20150317_LSU_OilSpill_EpinextAdaptor1_ID.ipynb


Results:

This adaptor sequence is not present in any of the reads in the FASTQ file analyzed.

TruSeq Adaptor Counts – LSU C.virginica Oil Spill Sequences

Initial analysis, comparing barcode identification methods, revealed the following info about demultiplexing on untrimmed sequences:

Using grep:

long barcodes: Found in ~12% of all reads

short barcodes: Found in ~25% of all reads

Using fastx_barcode_splitter:

long barcodes, beginning of line: Found in ~15% of all reads

long barcodes, end of line: Found in < 0.008% of all reads (yes, that is actually percentage)

short barcodes, beginning of line: Found in ~1.3% of all reads

short barcodes, end of line: Found in ~2.7% of all reads


Decided to determine what percentage of the sequences in this FASTQ file have just the beginning of the adaptor sequence (up to the 6bp barcode/index):

GATCGGAAGAGCACACGTCTGAACTCCAGTCAC

This was done to see if the numbers increased without the barcode index (i.e. see if majority of sequences are being generated from “empty” adaptors lacking barcodes).

The analysis was performed in a Jupyter (IPython) notebook and the notebook is linked, and embedded, below.

NBViewer: 20150316_LSU_OilSpill_Adapter_ID.ipynb


Results:

Using grep:

15% of the sequences match

That’s about 3% more than when the adaptor and barcode are searched as one sequence.

Using fastx_barcode_splitter:

beginning of line – 17% match

end of line – 0.06% match

The beginning of line matches are ~2% higher than when the adaptor and barcode are searched as one sequence.

Will contact Univ. of Oregon to see if they can shed any light and/or help with the demultiplexing dilemma we have here. Lots of sequence, but how did it get generated if adaptors aren’t present on all of the reads?

TruSeq Adaptor Identification Method Comparison – LSU C.virginica Oil Spill Sequences

We recently received Illumina HiSeq2500 data back from this project. Initially looking at the data, something seems off.  Using FASTQC, the quality drops of drastically towards the last 20 bases of the reads. We also see a high degree of Illumina TruSeq adaptor/index sequences present in our data.

Since this sequencing run was multiplexed (i.e. multiple libraries were pooled and run together on the HiSeq), we need to demultiplex our sequences before performing any trimming. Otherwise, the trimming could remove the index (barcodes) sequences from the data and prevent us from separating out the different libraries from each other.

However, it turns out, demultiplexing is not a simple, straightforward task. There are a variety of programs available and they all have different options. I decided to compare TruSeq index identification using two programs:

-grep (grep is a built-in command line (bash) program that searches through files to find matches to user-provided information.)
-fastx_barcode_splitter.pl (fastx_barcode_splitter.pl is a component of the fastx_tookit that searches through FASTQ files to identify matches to user-provided index/barcode sequences.)

The advantage(s) of using grep is that it’s extremely fast, easy to use, and already exists on most Unix-based computers (Linux, OS X), thus not requiring any software installation. The disadvantage(s) of using grep for a situation like this is that it is not amenable to allowing for mismatches and/or partial matches to the user-provided information.

The advantage(s) of using fastx_barcode_splitter.pl is that it can accept a user-defined number of mismatches and/or partial matches to the user-defined index/barcode sequences. The disadvantage(s) of using fastx_barcode_splitter.pl is that it requires the user to specify the expected location of the index/barcode sequence in the target sequence: either the beginning of the line or the end of the line. It will not search beyond the length(s) of the provided index/barcode sequences. That means if you index/barcode exists in the middle of your sequences, this program will not find it. Additionally, since this program doesn’t exist natively on Unix-based machines, it must be downloaded and installed by the user.

So, I tested both of these programs to see how they compared at matching both long (the TruSeq adaptor/index sequences identified with FASTQC) and “short” (the actual 6bp index sequence) barcodes.

To simplify testing, only a single sequence file was used from the data set.

All analysis was done in a Jupyter (IPython) notebook.

FASTQC HTML file for easier viewing of FASTQC output.

NBViewer version of embedded notebook below.


Result:

grep

long barcodes: Found in ~12% of all reads

short barcodes: Found in ~25% of all reads


fastx_barcode_splitter

long barcodes, beginning of line: Found in ~15% of all reads

long barcodes, end of line: Found in < 0.008% of all reads (yes, that is actually percentage)


short barcodes, beginning of line: Found in ~1.3% of all reads

short barcodes, end of line: Found in ~2.7% of all reads


Overall, the comparison is interesting, however, the important take home from this is that in the best-case scenario (grep, short barcodes), we’re only able to identify 25% of the reads in our sequences!

It should also be noted that my analysis only used sequences in one orientation. It would be a good idea to also do this analysis by searching with the reverse and reverse complements of these sequences.
Sequencing Data – LSU C.virginica MBD BS-Seq

Our sequencing data (Illumina HiSeq2500, 100SE) for this project has completed by Univ. of Oregon Genomics Core Facility (order number 2112).

Samples sequenced/pooled for this run:

Sample Treatment Barcode
HB2 25,000ppm oil ATCACG
HB16 25,000ppm oil TTAGGC
HB30 25,000ppm oil TGACCA
NB3 No oil ACAGTG
NB6 No oil GCCAAT
NB11 No oil CAGATC

All code listed below was run on OS X 10.9.5

Downloaded all 15 fastq.gz files to Owl/web/nightingales/C_virginica:

$curl -O http://gcf.uoregon.edu:8080/job/download/2112?fileName=lane1_NoIndex_L001_R1_001.fastq.gz
$curl -O http://gcf.uoregon.edu:8080/job/download/2112?fileName=lane1_NoIndex_L001_R1_002.fastq.gz
$curl -O http://gcf.uoregon.edu:8080/job/download/2112?fileName=lane1_NoIndex_L001_R1_003.fastq.gz
$curl -O http://gcf.uoregon.edu:8080/job/download/2112?fileName=lane1_NoIndex_L001_R1_004.fastq.gz
$curl -O http://gcf.uoregon.edu:8080/job/download/2112?fileName=lane1_NoIndex_L001_R1_005.fastq.gz
$curl -O http://gcf.uoregon.edu:8080/job/download/2112?fileName=lane1_NoIndex_L001_R1_006.fastq.gz
$curl -O http://gcf.uoregon.edu:8080/job/download/2112?fileName=lane1_NoIndex_L001_R1_007.fastq.gz
$curl -O http://gcf.uoregon.edu:8080/job/download/2112?fileName=lane1_NoIndex_L001_R1_008.fastq.gz
$curl -O http://gcf.uoregon.edu:8080/job/download/2112?fileName=lane1_NoIndex_L001_R1_009.fastq.gz
$curl -O http://gcf.uoregon.edu:8080/job/download/2112?fileName=lane1_NoIndex_L001_R1_010.fastq.gz
$curl -O http://gcf.uoregon.edu:8080/job/download/2112?fileName=lane1_NoIndex_L001_R1_011.fastq.gz
$curl -O http://gcf.uoregon.edu:8080/job/download/2112?fileName=lane1_NoIndex_L001_R1_012.fastq.gz
$curl -O http://gcf.uoregon.edu:8080/job/download/2112?fileName=lane1_NoIndex_L001_R1_013.fastq.gz
$curl -O http://gcf.uoregon.edu:8080/job/download/2112?fileName=lane1_NoIndex_L001_R1_014.fastq.gz
$curl -O http://gcf.uoregon.edu:8080/job/download/2112?fileName=lane1_NoIndex_L001_R1_015.fastq.gz


Renamed all files by removing the beginning of each file name (2112?fileName=) and replacing that with 2112_:

$for file in 2112*lane1_NoIndex_L001_R1_0*; do mv "$file" "${file/#2112?fileName=/2112_}"; done


Created a directory readme.md (markdown) file to list & describe directory contents: readme.md

$ls *.gz >> readme.md

Note: In order for the readme file to appear in the web directory listing, the file cannot be all upper-case.


Created MD5 checksums for each fastq.gz file: checksums.md5

$md5 *.gz >> checksums.md5