Assembly – SparseAssembler (k 131) on Geoduck Sequence Data

After some runs with kmergenie, I’ve decided to try re-running SparseAssembler using a kmer setting of 131.

The job was run on our Mox HPC node.

Results:

Output folder:

Slurm output file:

This failed with the following error message:

Error! K-mer size too large!

Looking into this, it’s because the maximum kmer size for kmergenie is 127! Doh!

It’d be nice if the program looked at that setting first before processign all the data files…

A bit disappointing, but I’ll give this a go with a lower kmer setting and see how it goes.

Data Management – Geoduck Phase Genomics Hi-C Data

We received sequencing/assembly data from Phase Genomics.

The data contains two assemblies, produced on two different dates.

All data is here: 20180421_geoduck_hi-c

All FASTQ files (four files; Geoduck_HiC*.gz) were copied to Nightingales:

MD5 checksums were verified and appended to the Nightingales checksum file:

Nightingales sequencing inventory was updated (Google Sheet):

The two assemblies (and assembly stats) they provided are here:

I’ve updated the project-geoduck-genome GitHub wiki with this info.

Kmer Estimation – Kmergenie (k 301) on Geoduck Sequence Data

Continuing the quest for the ideal kmer size to use for our geoduck assembly.

The previous two runs with kmergenie using the diploid setting were no good.

So, this time, I simply increased the maximum kmer size to 301 and left all other settings as default. I’m hoping this is large enough to produce a smooth curve, with a maximal value that can be determined from the output graph.

The job was run on our Mox HPC node.

Results:

Output folder:

Slurm output file:

Kmer histogram (HTML) reports:

Well, the graph is closer to what we’d expect, in that it appears to reach a zenith, but after that plateau, we see a sharp dropoff, as opposed to a gradual dropoff that mirrors the left half. Not entirely sure what the implications for this are, but I’ll go ahead an run SparseAssembler using a kmer size of 131 and see how it goes.

Kmer Estimation – Kmergenie Tweaks on Geoduck Sequence Data

Earlier today, I ran kmergenie on our all of geoduck DNA sequencing data to see what it would spit out for an ideal kmer setting, which I would then use in another assembly attempt using SparseAssembler; just to see how the assembly might change.

The output from that kmergenie run suggested that the ideal kmer size exceeded the default maximum (k = 121), so I decided to run kmergenie a few more times, with some slight changes.

All jobs were run on our Mox HPC node.

Run 1
Run 2
Results:

Output folders:

Slurm output files:

Kmer histogram (HTML) reports:

Diploid


Diploid, k 301

Okay, well, these graphs clearly show that the diploid setting is no good.

We should be getting a nice, smooth, concave curve.

Will try running again, without diploid setting and just increasing the max kmer size.

Kmer Estimation – Kmergenie on Geoduck Sequence Data (default settings)

After the last SparseAssembler assembly completed, I wanted to do another run with a different kmer size (last time was arbitrarily set at 101). However, I didn’t really know how to decide, particularly since this assembly consisted of mixed read lenghts (50bp and 100bp). So, I ran kmergenie on all of our geoduck (Panopea generosa) sequencing data in hopes of getting a kmer determination to apply to my next assembly.

The job was run on our Mox HPC node.

Slurm script: 20180419_kmergenie_geoduck_slurm.sh

Input files list (needed for kmergenie command – see Slurm script linked above): geoduck_fastq_list.txt

Results:

Output folder: 20180419_kmergenie_geoduck/

Slurm output file: 20180419_kmergenie_geoduck/slurm-161551.out

Kmer histograms (HTML): 20180419_kmergenie_geoduck/histograms_report.html

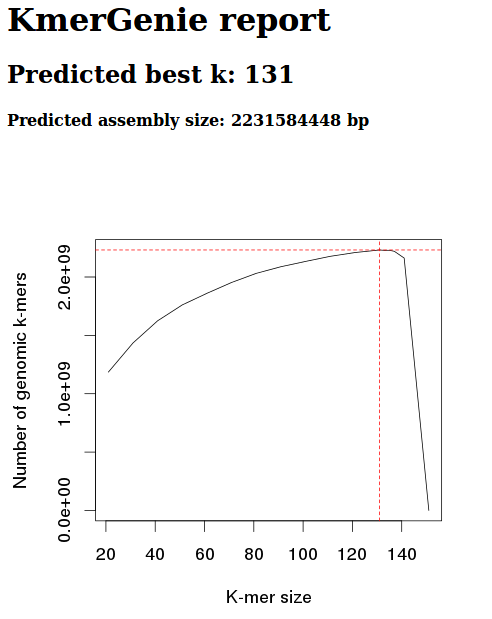
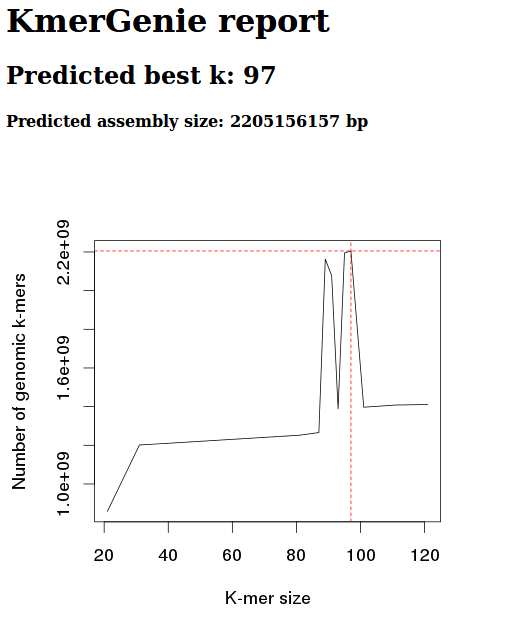
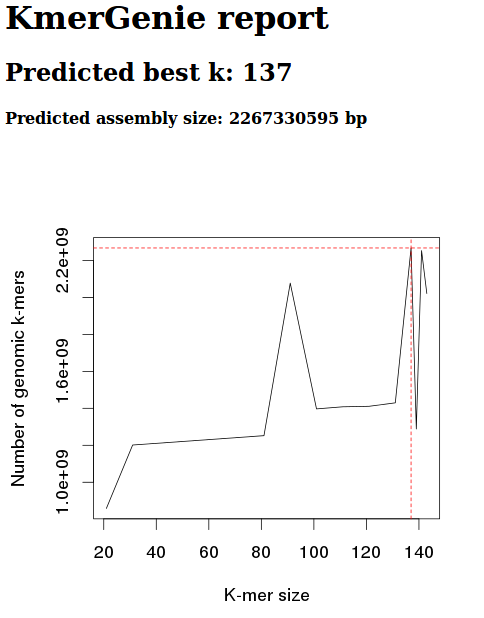
Screen cap from Kmer report:

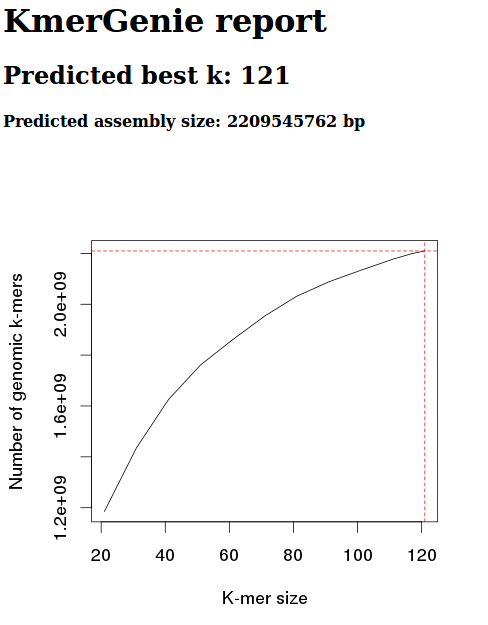
This data estimates the best kmer size for this data to be 121.

However, based on the kmergenie documentation, this is likely to be inaccurate. This inaccuracy is based on the fact that our kmer graph should be concave. Our graph, instead, is only partial – we haven’t reached a kmer size where the number of kmers is decreasing.

As such, I’ll try re-running with a different maximum kmer settting (default max is 121).

Assembly Stats – Quast Stats for Geoduck SparseAssembler Job from 20180405

The geoduck genome assembly started 20180405 completed this weekend.

This assembly utilized the BGI data and all of the Illumina project data (NMP and NovaSeq) with a kmer 101 setting.

I ran Quast to gather some assembly stats, using the following command:

python /home/sam/software/quast-4.5/quast.py -t 24 /mnt/owl/Athaliana/20180405_sparseassembler_kmer101_geoduck/Contigs.txt
Results:

Quast output folder: results_2018_04_15_13_45_03/

Quast report (HTML): results_2018_04_15_13_45_03/report.html

I’ve embedded the Quast HTML report below, but it may be easier to view by using the link above.

Data Management – SRA Submission LSU C.virginica Oil Spill MBD BS-seq Data

Submitted the Crassostrea virginica (Eastern oyster) MBD BS-seq data we received on 20150413 to NCBI Sequence Read Archive.

Data was uploaded via the web browser interface, as the FTP method was not functioning properly.

SRA deets are below (assigned FASTQ files to new BioProject and created new BioSamples).

SRA Study: SRP139854
BioProject: PRJNA449904

BioSamples Table

Sample Treatment BioSample
HB2 oil 25,000ppm SAMN08919868
HB16 oil 25,000ppm SAMN08919921
HB30 oil 25,000ppm SAMN08919953
NB3 unexposed SAMN08919461
NB6 unexposed SAMN08919577
NB11 unexposed SAMN08919772

TrimGalore/FastQC/MultiQC – Trim 10bp 5’/3′ ends C.virginica MBD BS-seq FASTQ data

Steven found out that the Bismarck documentation (Bismarck is the bisulfite aligner we use in our BS-seq pipeline) suggests trimming 10bp from both the 5′ and 3′ ends. Since this is the next step in our pipeline, we figured we should probably just follow their recommendations!

TrimGalore job script:

Standard error was redirected on the command line to this file:

MD5 checksums were generated on the resulting trimmed FASTQ files:

All data was copied to my folder on Owl.

Checksums for FASTQ files were verified post-data transfer (data not shown).

Results:

Output folder:

FastQC output folder:

MultiQC output folder:

MultiQC HTML report:

Hey! Look at that! Everything is much better! Thanks for the excellent documentation and suggestions, Bismarck!

DNA Isolation & Quantification – Metagenomics Water Filters

Isolated DNA from the following two filters:

DNA was isolated with the DNeasy Blood & Tissue Kit (Qiagen), following a modified version of the Gram-Positive Bacteria protocol:

  • filters were unfolded and unceremoniously stuffed into 1.7mL snap cap tubes
  • did not perform enzymatic lysis step
  • filters were incubated with 400μL of Buffer AL and 50μL of Proteinase K (both are double the volumes listed in the kit and are necessary to fully coat the filter in a 1.7mL snap cap tube)
  • 56oC incubations were performed overnight
  • 400μL of 100% ethanol was added to each after the 56oC incubation
  • samples were eluted in 50μL of Buffer AE
  • all spins were performed at 20,000g

Samples were quantified with the Roberts Lab Qubit 3.0 and the Qubit 1x dsDNA HS Assay Kit.

Used 10μL of each sample for measurement (see Results for update).

Results:

Raw data (Google Sheet): 20180411_qubit_metagenomics_filters

Sample Concentration(ng/μL) Initial_volume(μL) Yield(ng)
filter 5/22 #7 pH8.2 20.8 50 1040
filter 5/26 #7 pH8.2 11.6 50 580

NOTE: For “filter 5/22 #7 pH8.2″ the initial quantification using 10μL ended up being too concentrated. Re-ran using 5μL.

Both samples have yielded DNA. This is, obviously, an improvement over the previous attempts to isolate DNA from ammonium bicarbonate filter rinses that Emma supplied me with.

Will discuss with Steven and get an idea of which filters to isolate additional DNA from.

Samples were stored Sam gDNA Box #2, positions G6 & G7. (FTR 213, #27 (small -20oC frezer)

TrimGalore/FastQC/MultiQC – 2bp 3′ end Read 1s Trim C.virginica MBD BS-seq FASTQ data

Earlier today, I ran TrimGalore/FastQC/MultiQC on the Crassostrea virginica MBD BS-seq data from ZymoResearch and hard trimmed the first 14bp from each read. Things looked better at the 5′ end, but the 3′ end of each of the READ1 seqs showed a wonky 2bp blip, so decided to trim that off.

I ran TrimGalore (using the built-in FastQC option), with a hard trim of the last 2bp of each first read set that had previously had the 14bp hard trim and followed up with MultiQC for a summary of the FastQC reports.

TrimGalore job script:

Standard error was redirected on the command line to this file:

MD5 checksums were generated on the resulting trimmed FASTQ files:

All data was copied to my folder on Owl.

Checksums for FASTQ files were verified post-data transfer (data not shown).

Results:

Output folder:

FastQC output folder:

MultiQC output folder:

MultiQC HTML report:

Well, this is a bit strange, but the 2bp trimming on the read 1s looks fine, but now the read 2s are weird in the same region!

Regardless, while this was running, Steven found out that the Bismarck documentation (Bismarck is the bisulfite aligner we use in our BS-seq pipeline) suggests trimming 10bp from both the 5′ and 3′ ends. So, maybe this was all moot. I’ll go ahead and re-run this following the Bismark recommendations.